Android web testing with Playwright: CI and real devices
Master Android web testing with Playwright, from seamless CI integration to real device execution. Ensure reliable, cross-browser validation and deliver mobile-perfect web experiences every time.
A CI/CD pipeline fails at 3 AM. Instead of guessing, the developer downloads a single Playwright trace file. They scrub through DOM snapshots, the network waterfall, and console logs, find a timeout, ship a fix, and go back to sleep.
That is the difference a modern testing stack makes: fast diagnosis, fewer reruns, and far less guesswork.
Legacy stacks often leave teams with flaky tests and long triage loops. Playwright testing addresses this with auto-waiting, parallelization, flexible reporters, and deep diagnostics.
Playwright also leverages a real browser input pipeline to simulate user interactions in a way that closely matches real user behavior, ensuring reliable and accurate testing of dynamic web features.
This guide is a practical playbook for senior QA engineers, SDETs, and engineering managers.
We cover CI setup, advanced Playwright reporting, framework patterns for scale, visual and accessibility checks, mobile coverage, fast debugging with traces, and a safe Selenium to Playwright migration strategy.
What is Playwright testing and when should teams adopt it?
Playwright testing is an end-to-end automation framework which uses browsers across Chromium, Firefox, and WebKit with a single API and first-class tooling for CI.
Playwright is a popular browser automation library developed by Microsoft, known for its versatility and robust automation capabilities.
Why Teams need it:
- Reliable cross-browser coverage without juggling vendor drivers.
- Fast, deterministic feedback via auto-waiting and web-first assertions.
- Rich evidence for failures (traces, screenshots, network/console logs).
- CI-friendly Playwright reporting (HTML, JUnit XML, JSON) to feed dashboards.
Key Features of Playwright:
- Direct browser control for reliable automation
- Built-in auto waiting to reduce flakiness
- Integrated diagnostics for debugging
- Built-in test runner (Playwright Test) for managing and running tests across browsers
- Simple setup to write and run your first test quickly
Playwright's Architectural Edge: The Direct Connection
Playwright is faster and more reliable because it connects directly to browsers instead of using the older WebDriver protocol.
Key points:
- WebDriver vs Direct Control: WebDriver sends commands over HTTP using browser-specific drivers, which adds delay. Playwright skips that and uses a direct WebSocket connection to talk to the browser engine, making tests faster and smoother.
- Built-in Waiting and Network Control: Playwright waits for elements automatically and tracks the DOM and network in real time. It can mock APIs, block or edit requests, and replay network data, which helps reduce flaky tests and makes debugging easier.
This direct communication model gives Playwright more speed, stability, and accuracy in end-to-end testing.
Why Playwright outperforms legacy browser testing stacks
The core benefit of Playwright is its ability to eliminate the most common sources of E2E test flakiness: element visibility, network latency, and driver management overhead.
Playwright tackles this with a philosophy of determinism and integrated diagnostics.
Playwright's automatic waiting feature eliminates the need for manual wait commands, reducing test flakiness and making tests more efficient.
- Network and browser control: Playwright manages browser drivers and network conditions internally, removing a major source of test instability.
- Rich debugging tools: Features like trace viewers and video recordings make it much easier to diagnose and fix the failures in it.
Additionally, configuring any test retry strategy in Playwright can be further enhanced by test reliability by capturing execution traces and reducing the impact of transient failures from it.
Addressing Flakiness at the Source
Flakiness wastes engineering time and destroys confidence in the test suite. Playwright tackles this with a philosophy of determinism and integrated diagnostics.
- Auto-Waiting Logics: Unlike any other legacy frameworks where you often need to explicitly wait or sleep, Playwright automatically waits for the elements to be more actionable.
It also waits for the elements to be more visible, enabled, stable, and ready to receive events. This cuts boilerplate code and makes tests more robust against UI loading shifts. - Web-First Assertions: Playwright’s expected assertions are built on auto-waiting.
For example, await expect(locator).toHaveText() will retry checking the text until the timeout is reached, ensuring you assert against the final, stable state of the UI.
This is superior to asserting immediately, which will often cause transient failures. - Cross-Browser Consistency: Playwright bundles up all the necessary browser binaries like Chromium, Firefox, WebKit, etc., ensuring that the same version of the automation API is used on every run, regardless of the host machine’s installed browsers. This removes a major variable in cross-browser testing.
Playwright also provides detailed execution of logs that includes screenshots, step-by-step actions and troubleshooting data which makes it easier to analyse issues and monitor test activities.
By capturing their execution trace data, you can also analyze test failures, identify flaky tests and can improve overall test reliability.
Trace-First Debugging: A Diagnostic Leap
When a test fails, the output must be the answer, not the start of a deep investigation. Playwright's Trace Viewer provides a full diagnostic file, which is a key differentiator from simpler screenshots or raw logs.
The trace records the context of failure:
- Action Steps: A list of every command (click, fill, goto).
- DOM Snapshots: Before and after snapshots of the DOM for every action.
- Network Log: A complete waterfall of all requests and responses.
- Console and Error Logs: All browser console output.
You can view the trace locally or upload the zip to trace.playwright.dev to visually scrub through the entire test run, seeing exactly what the user and the browser saw at every step. This drastically reduces the Time-to-fix (TTF) for failed tests.
Playwright vs. Selenium: a quick comparison
This comparison highlights the fundamental shift from protocol-based communication (Selenium) to direct control and integrated tooling (Playwright).
| Feature | Selenium (WebDriver) | Playwright (Direct Control) |
|---|---|---|
| Communication Model | HTTP/JSON Wire Protocol | Direct persistent WebSocket (control channel) |
| Flakiness Handling | Requires explicit/implicit waits | Built-in auto-waiting for all actions |
| Browser Support | All major browsers (requires separate drivers) | Chromium, Firefox, WebKit (bundled binaries) |
| CI Diagnostics | Screenshots, raw logs, JUnit XML | Full trace viewer, video, screenshots, HAR |
| Network Control | Requires proxying or third-party libraries | Native page.route() and HAR replay |
| Parallelism | Managed by runner (e.g., TestNG, Jest) | First-class built-in workers in Playwright Test |
| Mobile Emulation | Device farm or third-party emulation libraries | Built-in device descriptors for responsive and touch testing |
Playwright stands out for its comprehensive features, which includes strong support for modern browsers like Chromium, Firefox, WebKit, etc.
These features of Playwright enables reliable, cross-browser automation by giving them excellent control over browser processes, integrated diagnostics, and built-in auto-wait.
Its architecture and tools are designed to handle such complex testing scenarios across various platforms and languages, making it superior to other legacy tools.
How do I set up Playwright testing in CI/CD quickly?
A production-ready CI setup is the bridge between writing a test and getting fast feedback.
The main goal is to set up everything that your tests need, and run them all at the same time to save your time, and safely keep all the test results and their screenshots.
To do this, it's important to have a good setup file (like playwright.config.ts) and keep all your test files and scripts organized.
This will help your automated tests run smoothly and fit neatly in your CI/CD process.
GitHub Actions configuration for instant CI integration
The following GitHub Actions workflow installs dependencies and browsers, runs tests, and uploads artifacts (Playwright reporting, test results, traces). This is based on Playwright's official CI guidance.
name: Playwright Tests
on:
  push:
    branches: [ main, develop ]
  pull_request:
    branches: [ main, develop ]
jobs:
  test:
    runs-on: ubuntu-latest
    steps:
      - uses: actions/checkout@v4
      - uses: actions/setup-node@v4
        with:
          node-version: 20
      - name: Install dependencies and browsers
        run: |
          npm ci
          npx playwright install --with-deps
      - name: Run Playwright tests
        # Common reporter combo: console + JUnit + HTML
        run: npx playwright test --reporter=list,junit,html
      - name: Upload Playwright artifacts
        if: always()
        uses: actions/upload-artifact@v4
        with:
          name: playwright-artifacts
          path: |
            playwright-report/
            test-results/
            test-results/*.xml
          retention-days: 14
Understanding Playwright Reporters for CI
Playwright supports running multiple reporters at once. You must select the right combination to satisfy both developer triage and continuous integration tooling.
| Reporter Type | Purpose | Output Format | Use Case in CI |
|---|---|---|---|
| list | Readable console output | Text/Console | Instant feedback in CI logs (human-readable) |
| junit | Standardized machine-readable summary | XML (junit.xml) | Pipeline summaries, gating checks, and test intelligence dashboards |
| html | Full interactive report with traces | HTML + Assets (playwright-report/) | Deep developer triage (download artifact to debug) |
| json | Machine-readable for custom systems | JSON (results.json) | Feeding custom analytics or specialized Playwright reporting backends |
Optimal Playwright Configuration for CI
The playwright.config.ts file is where you apply crucial scaling and reliability settings.
import { defineConfig } from '@playwright/test';
export default defineConfig({
  // Only retry on CI to detect instability, not hide it.
  retries: process.env.CI ? 1 : 0,
  // Set workers to match your CI machine capacity (e.g., 4 or 8)
  workers: process.env.CI ? 4 : undefined,
  use: {
    // Trace only when a test fails after a retry (saves artifact space)
    trace: 'on-first-retry',
    screenshot: 'only-on-failure',
    video: 'retain-on-failure',
  },
  reporter: [
    ['list'],
    ['junit', { outputFile: 'test-results/junit.xml' }],
    ['html', { open: 'never', outputFolder: 'playwright-report' }],
    ['json', { outputFile: 'test-results/results.json' }],
  ],
  timeout: 30000, // Global test timeout
  expect: { timeout: 5000 }, // Timeout for assertions (web-first)
});
Reporting vs Intelligence: Get Beyond “One Run at a Time”
Playwright’s built-in reporters (HTML, JUnit) are excellent for debugging a single failed run.
However, scaling review across hundreds of runs, multiple branches, and dozens of Pull Requests (PRs) requires cross-run history, flake detection, and a unified view.
Tracking test execution time and being able to explore execution logs are also crucial for optimizing feedback loops and improving overall testing efficiency.
This is the role of a test intelligence layer.
The Problem with Single-Run Reports at Scale
When a team scales to running thousands of Playwright tests a day, simple reports break down:
- No Cross-Run Context: A single run report cannot tell you if a failure is New (a regression), Persistent (an open bug), or Unstable (a flake).
- Triage Bottleneck: Developers and QA must download large artifact bundles (HTML, traces) for every failed PR, slowing the feedback loop.
- No Historical Proof: Without history, you cannot prove that a fix improved stability or that a flaky test was successfully deflaked.
Proof of Change (Where TestDino Fits)
A test intelligence platform, like TestDino, ingests the standard Playwright outputs (like the JUnit and JSON files specified in the config) and transforms them into actionable insights.
TestDino achieves this by:
- Ingesting Artifacts: It reads the Playwright JSON/JUnit/HTML outputs.
- Mapping Run Context: It links runs to the associated commit, branch, and Pull Request. This is crucial for the Pull Requests view, where reviewers see risk before opening code.
- Failure Classification: Using heuristics and AI Insights, it separates failures by cause (Actual Bug, UI Change, Unstable Test, Miscellaneous).
- Trend Analytics: It provides clear views of stability over time (Pass Rate Trends, Flaky Rate) and highlights the slowest tests and environments.
Reviewers see risk before opening code in PRs, and managers get trend proof. For instance, the TestDino Dashboard provides a Developer view that lists Active blockers and Ready to ship PRs, flagging flaky tests so developers know exactly what to prioritize.
The Analytics view shows Pass Rate Trends by environment and tracks flakiness. The AI Insights tab turns many raw failures into a few signals, separating product bugs from test instability, so teams can fix the right thing first.
Playwright Framework Patterns That Scale
The Playwright software stack is the easy part. Playwright automation supports robust test automation and streamlines testing processes for modern web applications, enabling efficient and reliable end-to-end testing across multiple browsers.
The Playwright framework you build around it determines your team’s velocity and stability over time.
1. Intent-first locators and page objects
Brittle locators (long CSS or XPath chains) are a top cause of UI change failures.
- Prefer role-based and test-id locators: These are resilient to styling and structure changes. Always use role-based locators first, as they also help with accessibility testing.
- page.getByRole('button', { name: 'Checkout' })
- page.getByTestId('user-menu')
- Keep Page Objects Thin: A page object should contain only locators and high-level methods that can represent a user's action like (login(), addToCart()). And push complex setup (like authentication) into fixtures.
- Enforce a data-test-id Convention: Work with your frontend development team to enforce a dedicated attribute (e.g., data-test-id="user-menu") that developers should promise not to change without the consultancy of QA. This is the most stable selector for elements without an inherent Accessible Role.
2. Test isolation with fixtures
State leakage between tests is a common source of Unstable Test (flaky) behavior. Playwright fixtures are the solution.
Creating a new browser context for each test ensures full test isolation, enabling independent tests and fast execution in browser contexts.
- Provide Contexts: Use fixtures to create authenticated user contexts, seed unique data, or enable feature flags. Each browser context functions as a separate, lightweight browser instance, ensuring no shared state between tests.
- Share Expensive Setup: Use worker-scoped fixtures to run a costly setup once per worker process (e.g., creating and saving a reusable authenticated session state to a file) and reuse it across multiple tests.
// example fixture for authenticated state
import { test as base } from '@playwright/test';
import { StorageState } from '@playwright/test';
// Define the shape of the fixture
export const test = base.extend<{ authedPage: any }>({
  authedPage: async ({ browser }, use) => {
    // Load pre-saved authentication state from 'auth.json'
    const storageState: StorageState = 'auth.json';
    const ctx = await browser.newContext({ storageState });
    const page = await ctx.newPage();
    // Pass the authenticated page to the test
    await use(page);
    await ctx.close();
  },
});
// Use it in a test
test('check authed dashboard loads', async ({ authedPage }) => {
  await authedPage.goto('/dashboard');
  await expect(authedPage.getByRole('heading', { name: 'Dashboard' })).toBeVisible();
});
3. Projects for coverage, not chaos
Use the Playwright configuration to define logical groupings for your tests.
- Browser Projects: Define projects for necessary browser targets (Desktop Chrome, Mobile Safari).
- Target Projects: Use a project to define a specific environment or test type (e.g., a project that only runs against a staging environment).
- Retries Policy: Keep retries set to 1 in CI. A retry of 1 is enough to detect a transient failure (Unstable Test). More than 1 often hides a real, intermittent defect that needs to be deflaked.
4. Stable parallelism
Playwright is fast because it runs tests in parallel using workers. Poor parallelism can cause race conditions.
- Cap Workers: Set a stable number of workers in CI (e.g., workers: 4). This provides a consistent timing baseline and prevents resource exhaustion.
- Avoid using Global State: Never to use global variables or shared resources (like a single database row or user account) that multiple tests running in parallel might modify. Use fixtures to inject unique, isolated data for each test.
- Use Serial Blocks Spacingly: Reserve test.describe.serial() for very specific scenarios where a flow cannot be parallelized (e.g., an admin setup that affects the entire application).
5. Grep, serial, and annotations for control
Use built-in control mechanisms to manage test execution effectively.
- Annotations: Mark slow or unstable tests with annotations: test.slow(), test.fixme(), or test.skip(). Ensure the TestDino platform or your reporting layer surfaces these so they are not forgotten.
- Grep and Tags: Use tags in your test titles (e.g., @smoke, @regression) and use the --grep flag in CI to scope runs. This allows for a fast smoke test suite on every commit and a full regression suite overnight.
Network Control and Test Data: Less Flakiness, Faster Feedback
E2E tests often fail because of slow or unpredictable external service calls. Playwright’s network mocking removes this external variability.
In addition, Playwright can be used for performing API tests, which will allow you to validate the backend services as a part of your web application testing workflows and ensuring API testing alongside browser automation.
Native Network Control (page.route)
- page.route(): Stub specific endpoints with canned JSON responses. This lets you mock server errors, empty states, or specific data payloads without needing a complex mock server setup.
// Mock a user profile API call with a specific payload
await page.route('**/api/v1/profile', route => {
  route.fulfill({
    status: 200,
    contentType: 'application/json',
    body: JSON.stringify({ name: 'Dino Tester', role: 'SDET' }),
  });
});
HAR Replay for Offline Testing
- HAR (HTTP Archive) Replay: Use the routeFromHAR feature to record an entire session's network traffic and replay it later. This is great for debugging or running tests without a live backend, making them significantly faster and more deterministic.
// Replay all network traffic from a recorded HAR file
await page.routeFromHAR('tests/data/login.har', {
  url: '**/api/v1/**',
  update: false, // Do not update the HAR file
  notFound: 'abort', // Abort any un-matched requests
});
Establishing a Test Data Contract
Test data management is critical for stability.
| Step | Action | Goal |
|---|---|---|
| Create | Use API helpers or database seeders to create unique, idempotent data before the UI steps. | Data is clean, isolated, and predictable for the current test. |
| Assert | Run the UI test steps and use web-first assertions. | Verify the application behaved as expected with the seeded data. |
| Cleanup | Delete the created data using API calls or database commands. | Avoid hidden cross-test coupling and pollution for subsequent runs. |
Playwright mobile testing and device emulation
Playwright mobile testing provides high-fidelity emulation for responsive design and core mobile behaviors (touch, viewport).
Built-in Device Descriptors
Playwright includes a library of device configurations (devices) for common phones and tablets.
import { defineConfig, devices } from '@playwright/test';
export default defineConfig({
  projects: [
    { name: 'Desktop Chrome', use: { ...devices['Desktop Chrome'] } },
    { name: 'Mobile Chrome',  use: { ...devices['Pixel 5'] } },
    { name: 'Mobile Safari',  use: { ...devices['iPhone 13'] } },
  ],
});
Emulation excels at: viewport, DPR, touch, UA, locale/timezone, geolocation, and permissions. Use emulation for the majority of responsive and functional checks..
Native emulation vs. real devices (cloud)
| Testing type | Playwright emulation | Real devices (cloud) |
|---|---|---|
| Primary use | Responsive layout, viewport, touch, locale/timezone, functional parity. | Performance nuances, OS/hardware quirks, low-level sensor access. |
| Speed & cost | Very fast; included, runs on standard CI infrastructure. | Slower; vendor subscription, higher per-minute cost. |
| Fidelity | High for rendering and input; sufficient for ~95% of E2E scenarios. | Full hardware/OS fidelity required for the final ~5% of high-risk scenarios. |
Reserve real devices for critical flows and pre-release sign-off where performance or low-level interaction is a high risk.
CI Engineering: Make It Fast and Reproducible
CI engineering is what turns a few local tests into a high-signal quality gate for the entire team.
Features like test execution screencast, support for test frames, and clearly defined test scenarios enable comprehensive test coverage and make debugging in CI environments much easier.
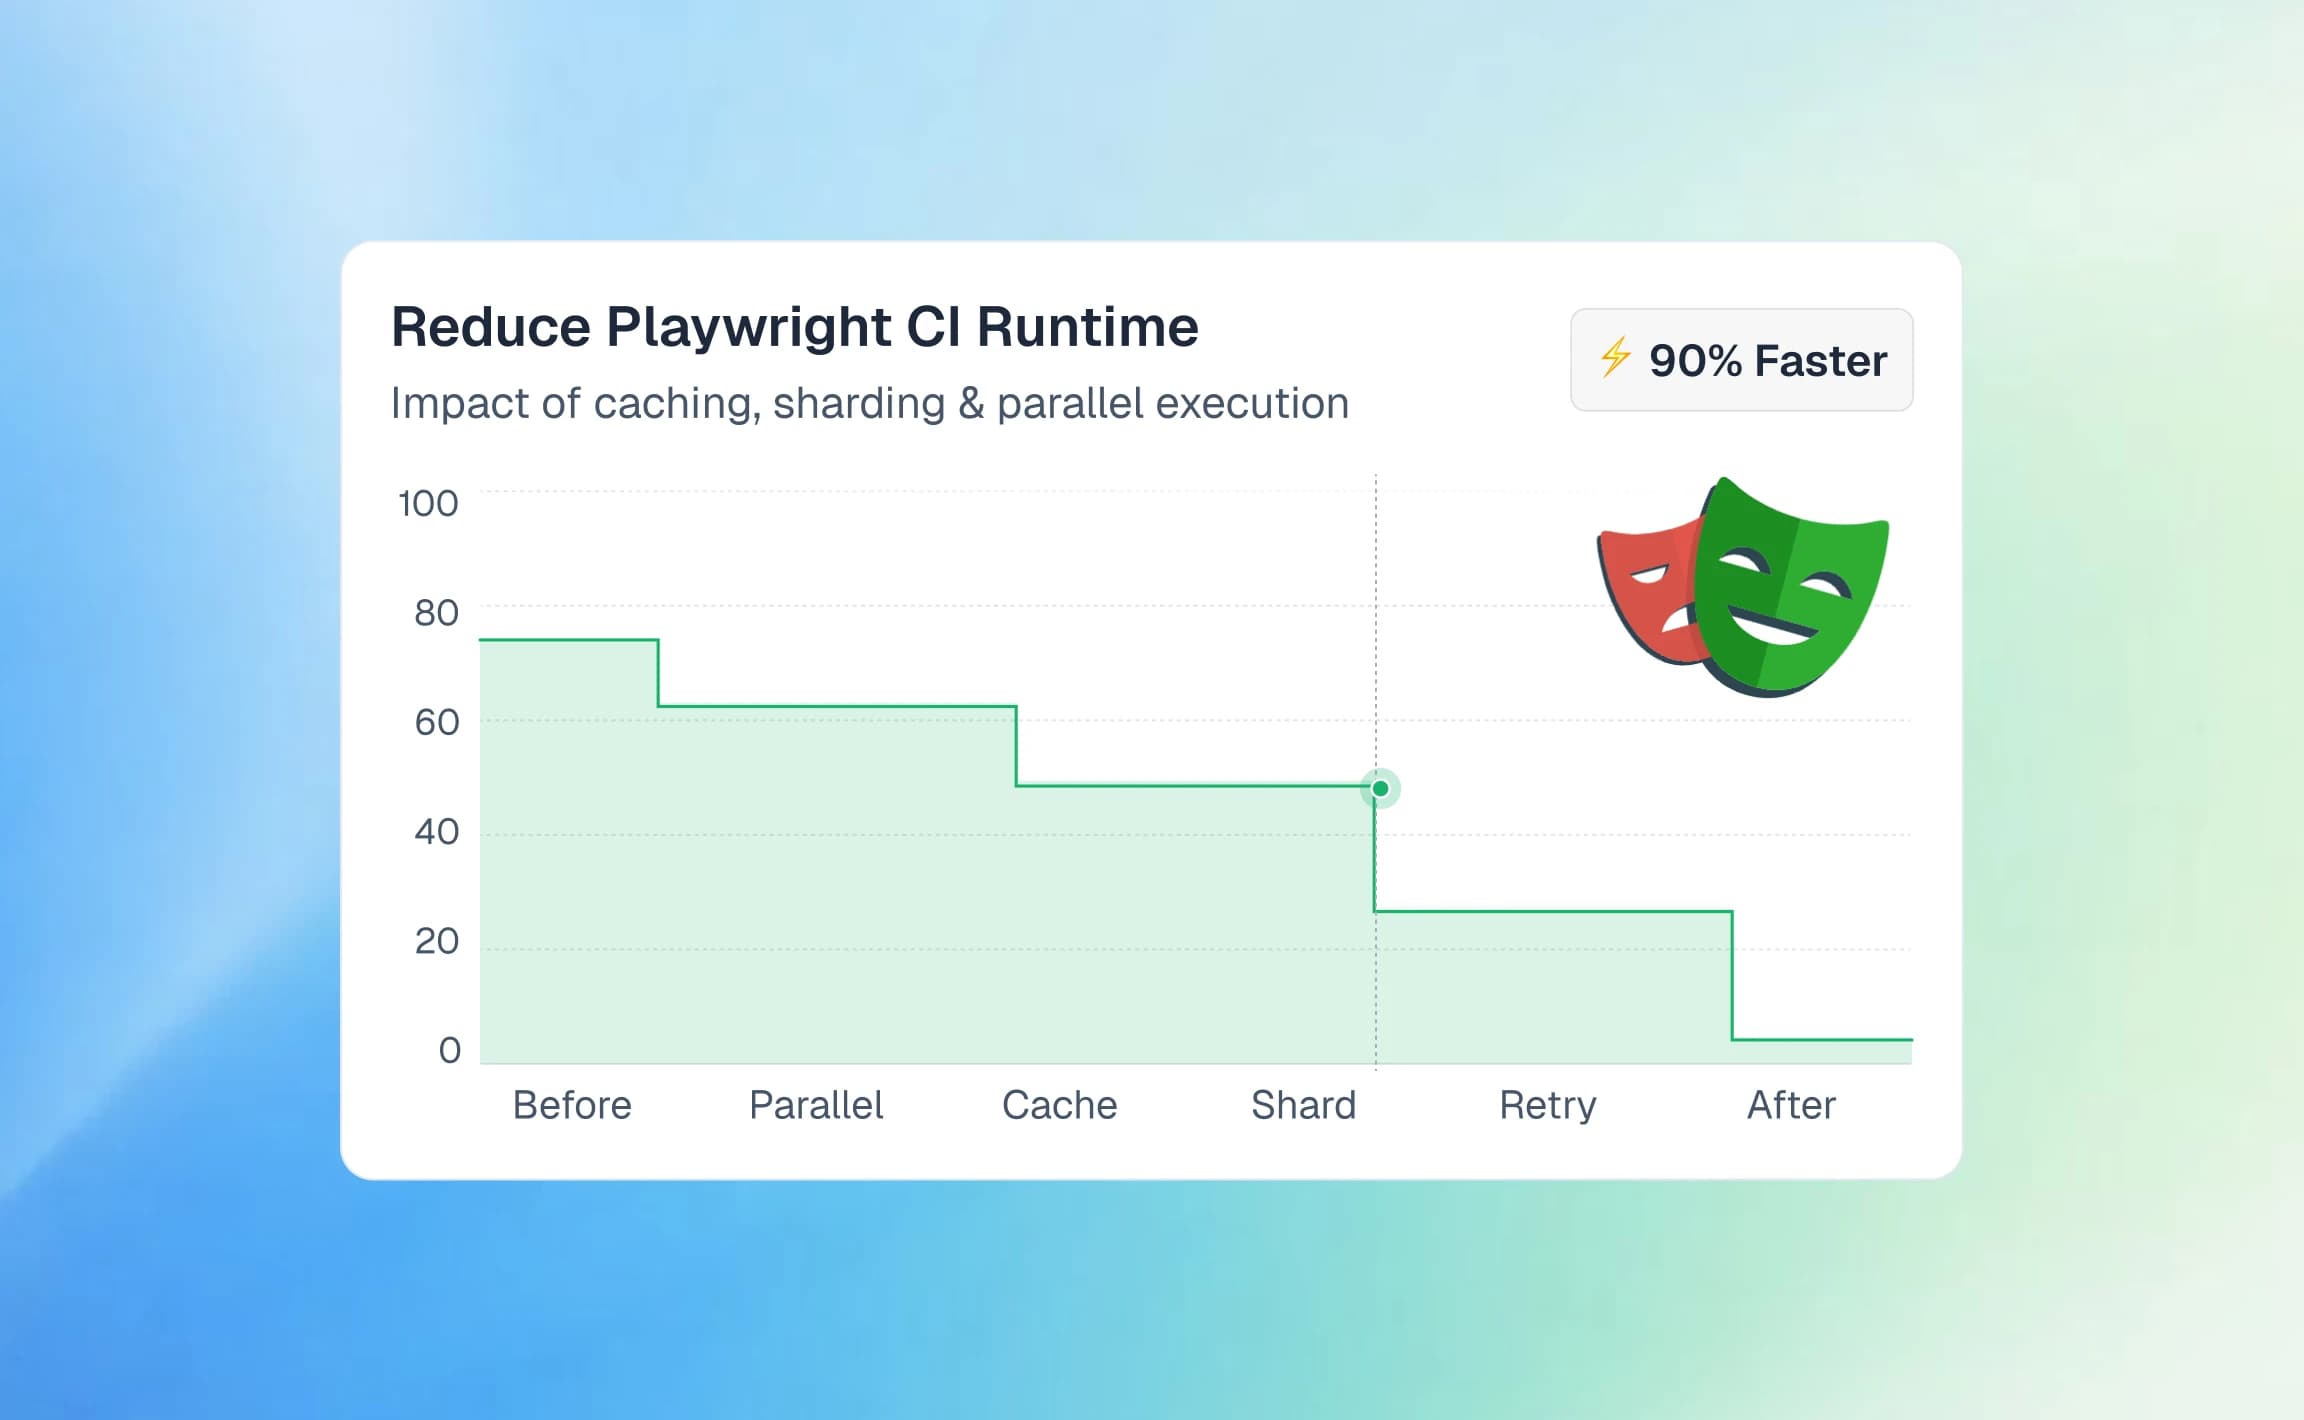
Matrix and Sharding for Parallelism
The most significant speedup comes from maximizing parallelism.
1. Project Matrix: Use a CI matrix to split the test execution across different projects (browsers). Each project runs on its own CI worker, dramatically reducing execution time.strategy:
fail-fast: false
matrix:
# Run three parallel jobs, one for each browser project
project: [ chromium, firefox, webkit ]
steps:
- run: npx playwright test --project=${{ matrix.project }}
2. Test Sharding: For extremely large test suites, Playwright can share tests by file or by index, splitting the test files themselves into smaller chunks for more CI jobs.
# Example sharding command for a massive suite
npx playwright test --shard=1/8 # Runs the first of eight chunks
Caching and artifacts
Smart caching and artifact management reduce CI time and control storage costs.
- Cache Playwright Install: Cache the ~/.cache/ms-playwright folder across jobs. This avoids re-downloading browser dependencies (Chromium, Firefox, WebKit) on every CI run.
- Standardize Artifact Retention: Keep artifact retention reasonable (e.g., 14 days) to control storage costs. The GitHub Actions snippet above sets retention-days: 14 for the HTML and trace bundles.
- Sane Artifact Size: Always configure the framework to record video only on failure and trace on first retry (trace: 'on-first-retry'). This keeps artifact uploads fast and small.
Timeouts and retries policy
A strong timeout policy will always prevent CI pipelines from stalling.
- Strict Timeouts: Use a global test timeout (e.g., 30_000 ms) and a separate, shorter assertion timeout (e.g., 5_000 ms) for web-first assertions. Tune these based on your application's slowest interactions.
- Retries = 1 in CI: This is the best practice. It catches a transient flake but ensures that persistent failures are reported immediately. If a test is so flaky that 1 retry is not enough, it is a bad test and needs to be quarantined or deflaked.
Branch/PR context (for intelligence layers)
To enable PR-aware dashboards (like the TestDino Pull Requests view), runs must be correctly tagged with context.
- Tag Runs: Ensure your CI process tags all runs with the branch name, commit SHA, PR number, and the logical environment.
- Branch Mapping: Use a configuration feature (like TestDino’s Branch Mapping) to roll up short-lived feature branches (e.g., feature/123-login-fix) into a logical environment (e.g., Development or Staging). This ensures your stability trends (Pass Rate Trends) are accurate.
Operational KPIs: What to Track Each Sprint
Raw pass/fail counts are not enough. High performing QA teams always keep a track of metrics that measure the health of the process, not just the code.
Monitoring all the tests, and analysis of individual test cases, and tracking test failure rates providing deeper insights into QA process health and help improve the overall quality of product.
| KPI | Why It Matters | How to Fix It if High | Where TestDino Helps |
|---|---|---|---|
| Time-to-fix (TTF) | Measures triage and fix efficiency. Long TTF means slow feedback. | Improve debugging with traces; use AI Insights to classify failures faster. | AI Insights provides a clear next step; integrations prefill tickets. |
| New Failure Rate | The percentage of failures that have never failed before. Indicates a true regression. | Focus review effort on these tests first. Tighten code review quality gates. | AI Insights automatically flags a failure as New or Persistent. |
| Flake Share | Portion of total failures that pass on retry. Destroys developer trust. | Quarantine, rewrite, or use Page Object Model best practices for locators. | Analytics tracks flakiness and AI Insights tags tests as Unstable. |
| Avg Run Duration | The time a developer waits for feedback. Directly impacts velocity. | Optimize slow tests with test.slow(), use sharding, and cap workers. | Analytics tracks the slowest 10 tests and test run durations. |
| Branch Health | Pass rate per branch/environment. Confidence before merge. | Use Branch Mapping to ensure feature branches map correctly to environments. | Dashboard and analytics provide pass rate trends by environment. |
Visual and accessibility testing with Playwright
Modern web quality assurance ensures that the UI is both responsive across several devices and also are accessible to all the users.
Tools like Playwright Inspector and Visual Studio Code (VSC) can be used to write, debug, and analyze the test code, which makes it easier to perform visual and accessibility tests.
Playwright makes it easier to integrate both visual testing and accessibility audits directly into your CI/CD pipeline.
Screenshot comparison without false positives
Playwright visual testing compares a screenshot of a UI region against a baseline image. The key is to manage false positives that block releases unnecessarily.
- Mask Dynamic Regions: Use the mask option to exclude elements that change on every run (timestamps, advertisements, unique user IDs).
// Example: Masking a dynamic timestamp in a widget
test('dashboard widgets look correct', async ({ page }) => {
  await page.goto('/dashboard');
  const widgetContainer = page.locator('#widgets');
  const dynamicTimestamp = page.locator('#last-updated');
  await expect(widgetContainer).toHaveScreenshot('dashboard-widgets.png', {
    threshold: 0.2, // Allow a small pixel difference percentage
    mask: [dynamicTimestamp], // Ignore the timestamp element during comparison
  });
});
- Set Tolerances: Use the threshold option to allow a small percentage of pixel difference. Start low, then increase slightly as your understanding of font rendering differences and environment variations grows.
Integrating axe-core for accessibility audits
Ensuring accessibility (a11y) is required for compliance (WCAG). Playwright integrates simply with the gold-standard axe-core library.
The @axe-core/playwright package lets you run automated WCAG checks right in your tests.
import { test, expect } from '@playwright/test';
import AxeBuilder from '@axe-core/playwright';
test('login page should have no critical a11y violations', async ({ page }) => {
  await page.goto('/login');
  const results = await new AxeBuilder({ page })
    // Scope the check to WCAG 2 A and AA rules
    .withTags(['wcag2a', 'wcag2aa'])
    .analyze();
  // Assert that no critical accessibility violations exist
  expect(results.violations).toEqual([]);
});
Quality Gates That Do Not Block Releases Incorrectly
Visual and accessibility checks can initially be noisy. It is vital to use test intelligence to ensure only genuine, persistent regressions block a merge.
- Start Permissive: Treat initial a11y violations as high-priority signals, not immediate blockers. Fix the highest-impact issues first.
- Use Failure Classification: If a visual test fails once but passes on a retry, it is likely an Unstable Test caused by an animation or a race condition, not a visual regression. TestDino’s AI Insights classifies this failure as Unstable, distinguishing it from an Actual Bug (a persistent failure). This allows teams to adjust thresholds and masking rules based on data-driven decisions that balance quality with velocity.
Mastering Playwright debugging and the Trace Viewer
When a headless CI run fails, the trace viewer is the complete forensic report.
You can explore execution logs and leverage Playwright test automation features to efficiently debug complex test scenarios, using tools like the Playwright inspector and trace viewer to investigate detailed execution data.
Enable tracing just-in-time:
The trace is the single most valuable piece of evidence.
- Enable Tracing Just-in-Time: Set the trace level in your config to avoid creating massive artifacts for successful runs.
- use: { trace: 'on-first-retry' }
- Download and Open: Download the trace.zip file from the CI artifacts.
- npx playwright show-trace path/to/trace.zip
Playwright Debug Tips That Save Hours
- Use the Inspector: Run your tests in debug mode (PWDEBUG=1) to pause, step through code, inspect element states, and try locators live in the browser.
- Custom Attachments: Use testInfo.attach() to capture custom logs, network payloads, or even HARs on-demand within a test.
- Avoid sleeps: Prefer web-first assertions (await expect(locator).toBeVisible()) over arbitrary page.waitForTimeout(500).
- Polling for Server State: Use expect.poll() to await server-side changes that surface in the UI, such as a status change from Pending to Complete.
// Wait up to 10 seconds for the backend status to change
await expect.poll(async () => {
  return await page.locator('#order-status').textContent();
}, {
  // Poll every 100ms
  intervals: [100],
  // Timeout after 10 seconds
  timeout: 10000,
}).toBe('Complete');
Decision tree: bug, flake, or visual drift?
The triage decision determines who owns the fix and how fast the PR unblocks.
| Failure Pattern | Likely Cause | Fix Action | TestDino Classification |
|---|---|---|---|
| Consistent Failure (local and CI) | Actual Bug (Product defect) | Fix application code or data. | Actual Bug |
| Passes on Retry (fails first run) | Unstable (Flaky test or environment race) | Revisit waits, use role-based locators, isolate test data. | Unstable Test |
| Only small pixel delta | Visual Drift (Rendering or animation change) | Update baseline image or mask dynamic regions. | UI Change (If selector/DOM) or Visual Delta flag |
| Setup/Env failure | Miscellaneous (CI or Environment issue) | Check CI config, firewall, or external services. | Miscellaneous |
TestDino automates this classification using AI Insights and links the result to the Test Runs evidence panel, letting you export a prefilled Jira/Linear issue from the evidence view with links to the run, commit, and CI job.
Accessibility (a11y) as a First-Class Signal
Playwright’s accessibility test’s and integrates well with the axe-core for automated WCAG checks:
import { test, expect } from '@playwright/test';
import AxeBuilder from '@axe-core/playwright';
test('login page should have no critical a11y violations', async ({ page }) => {
  await page.goto('/login');
  const results = await new AxeBuilder({ page })
    .withTags(['wcag2a', 'wcag2aa'])
    .analyze();
  expect(results.violations).toEqual([]);
});
- Run a11y checks in CI with tags for scoping (e.g., wcag2aa).
- Treat initial violations as signals; fix high-impact issues first.
- Track trends (new vs resolved violations) per release.
Quality gates without blocking releases wrongly: start permissive, then tighten. Pair a11y and visual checks with failure classification so only genuine regression risk blocks a merge.
Migrating Selenium to Playwright
A Selenium to Playwright migration is a project to increase the test suite’s stability and speed. Playwright creates browser contexts for test isolation and automatically generates default folder structures and configuration files during setup, streamlining the migration process. A phased approach reduces risk and accelerates value.
When you are planning on your migration strategy, always start with creating a basic test or your first playwright test case to validate that your Playwright setup is working as they are intended to be expected.
This initial playwright test case of yours should include a simple test script that will navigate to a webpage and verify its content, ensuring that the environment is correctly configured before migrating into more complex scenarios.
For running tests in parallel, Playwright allows you to automate and execute multiple playwright test cases quickly, enabling cloud-based infrastructure for more scalable and reliable test execution.
When handling authentication, you can minimize repetitive log in operations by reusing authentication states across tests, which help you to maintain test isolation while speeding up your playwright test cases.
Phased Migration Strategy: Reducing Risk
Avoid the costly "big-bang" cutover. A phased approach keeps the CI pipeline functional and the team productive.
- New Tests in Playwright: All new features and tests must be written only in Playwright. This maintains momentum and starts building the new suite.
- Migrate High-Flake, High-Value Tests: Focus on the tests that cause the most pain. Migrating the flakiest Selenium tests to Playwright's auto-waiting stability provides an immediate, measurable ROI.
- Run in Parallel During Transition: Keep both the legacy Selenium suite and the new Playwright suite running in CI. Use the JUnit reporter for both to unify reporting during this phase. This preserves coverage and provides confidence in the Playwright suite's results.
- Retire Legacy Paths Feature-by-Feature: As the Playwright coverage for a specific feature reaches 100%, delete the corresponding Selenium tests. This avoids a risky, large cutover.
Command mapping and code transformation
The change is not just in syntax; it is a shift in mindset from using the explicit waits to trust the framework's auto-waiting.
| Action | Selenium (concept) | Playwright (TypeScript) | Key Difference |
|---|---|---|---|
| Find element | findElement(By.id(...)) | page.getByTestId('...') or page.locator('#...') | Focus on role-based locators and better resilience. |
| Click | element.click() | locator.click() (auto-waits) | Auto-waits for element visibility, enablement, and stability before clicking. |
| Type | element.sendKeys('text') | locator.fill('text') | Also auto-waits; fill clears and types, avoiding old state. |
| Wait | Explicit waits or ExpectedConditions | Mostly implicit; use web-first assertions | Removes boilerplate and timing-related flakiness. |
| Network mocking | Third-party libs | page.route(), HAR replay | Native, powerful, and faster control over network requests. |
Unifying Reporting During Migration
During migration, wire both suites to a single source of truth. Send Playwright JSON/JUnit and Selenium JUnit to TestDino to get unified dashboards, PR summaries, and AI-based failure categorization across both frameworks.
This unified view gives managers confidence that coverage is maintained and that the new suite is measurably more stable.
Advanced CI/CD Integration and Pipeline Gating
Integrating Playwright deeply into the CI/CD pipeline requires more than just running npx playwright test.
It involves setting up quality gates, managing secrets, and handling link relationships.
Secrets Management and Build Hygiene
Playwright tests often interact with staging environments that require credentials.
- Scrub Secrets: Never let secrets appear in logs, screenshots, or HTML reports. Mask environment variables in CI logs.
- Store storageState Securely: If you persist an authenticated session to a file (e.g., auth.json), ensure this file is only accessible by the CI runner and is never checked into source control or uploaded as a non-essential artifact.
- Key Rotation: Treat your CI credentials and API keys with the same hygiene as production. TestDino’s Project Settings provides a way to Generate Key with a defined Expiration (days), ensuring keys are rotated and managed actively.
Quality Gating with JUnit XML
The standard JUnit XML reporter is the pipeline's language.
- Gating: Set up your CI server so the build fails if any tests fail in the JUnit report.
- Soft Gating: Customize your pipeline so that a pull request can still be merged if the only test failures are marked as "known flaky" or if there are no new test failures introduced. This prevents old, known issues from blocking a new, correct PR.
The TestDino Pull Requests view shows PRs that are Ready to ship (passed checks) and those with Active blockers, providing an immediate visual gate for reviewers.
Conclusion
Playwright testing changes your CI workflow from slow, reactive debugging to fast, evidence-led triage. First-class reporters, Playwright debug traces, native network mocking, and robust Playwright framework patterns reduce flakiness and speed up feedback dramatically.
A small investment in Playwright visual testing and Playwright accessibility testing closes the loop on quality without blocking releases unnecessarily.
To scale quality, you must move beyond single-run reports. Track operational KPIs: time-to-fix, new failure rate, flake share, and average run duration.
Use a test intelligence layer like TestDino when you need cross-run history, PR context, and stable classification of “bug vs. unstable” to keep the pipeline moving with high confidence.
Start with the CI setup, build stable fixtures, and trust the trace. The investment in Playwright's modern architecture will lead to more stable test suites and a faster time-to-merge for your engineering team.
Action: Integrate the Playwright JUnit reporter with an analytics platform to immediately track your team's New Failure Rate and Flake Share.
FAQs
Add multiple reporters in playwright.config.ts. A common CI combo is list (console), junit (pipeline), html (deep triage), and json (custom analytics).
Set use: { trace: 'on-first-retry' } and download trace.zip from CI artifacts. Open with npx playwright show-trace or through the HTML report.
Prefer role-based locators, use fixtures for isolation, cap retries to detect instability rather than hide it, and enable traces on retry only.
Start with component-level snapshots and small thresholds; mask dynamic regions. For a11y, use @axe-core/playwright with WCAG tags and treat violations as signals until patterns stabilize.
Phase migration (new tests first, then high-flake), run suites in parallel during transition, unify reporting via JUnit, and retire legacy coverage feature-by-feature.

Pratik Patel
Co-founder