Playwright debug guide: Trace viewer, smart waits and stable selectors
Master Playwright debugging using interactive local tools with powerful analysis. Learn how to use the Trace Viewer to uncover failures faster and turn flaky runs into predictable, fixable outcomes.
Playwright tests often fail in CI with little context, leaving QA and devs guessing.
Without a clear Playwright debug process, teams waste time chasing flaky tests instead of finding the root cause.
The simplest way to fix faster is to start with the Trace Viewer.
Check each step, screenshot, and DOM state, then decide if the issue is a selector, timeout, or network glitch.
Trace it to the change that triggered it and the issue becomes clear.
These Playwright debug tactics make troubleshooting predictable and give you real insight instead of trial and error.
How do I use playwright trace viewer to fix failures faster?
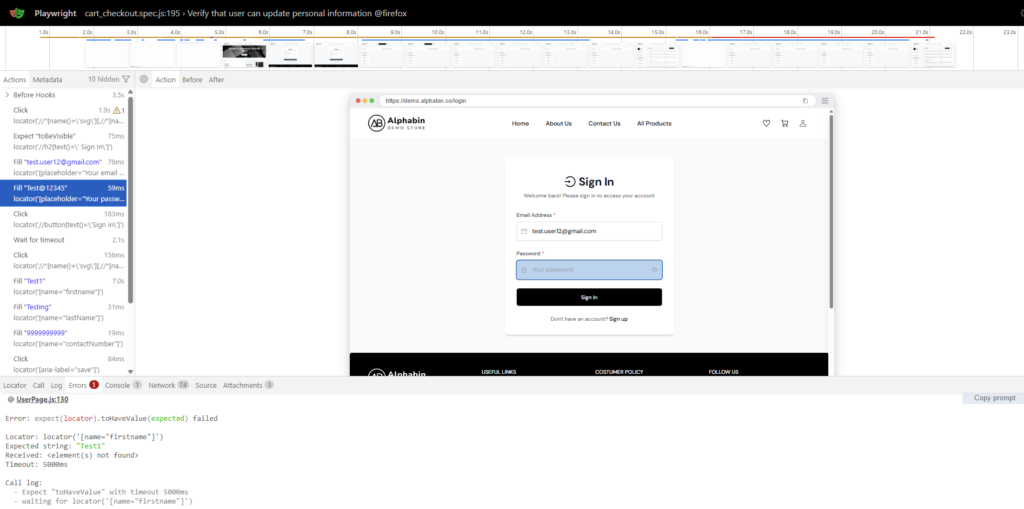
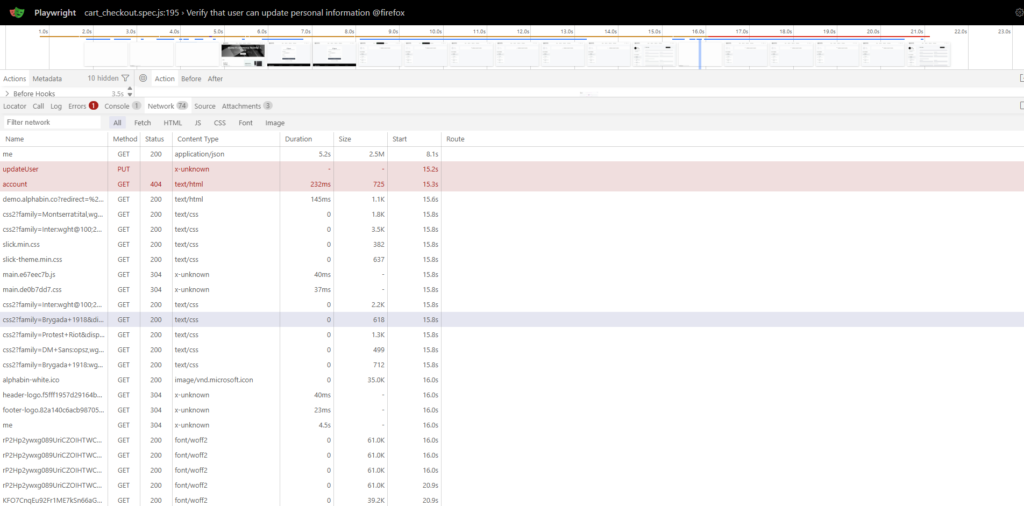
The Playwright Trace Viewer is the single most powerful tool for Root Cause Analysis (RCA) of end-to-end test failures. It captures everything that happened during the test run in a single trace.zip file.
This includes detailed action logs, screenshots, the full network waterfall, and browser console output for every step.
To fix failures fast, you must know how to quickly read the four core panels:
- Timeline and Actions: Step-by-step view of what happened. Find the last clean action before the failure. Click it to jump straight to that moment.
- Before/After Snapshots: Check the DOM right before and after the action. It shows if the element existed, was visible, or shifted. Helps confirm selector vs real bug.
- Console and Network: See errors and failed calls that test code cannot show. A 4xx/5xx or console crash often explains the UI failure.
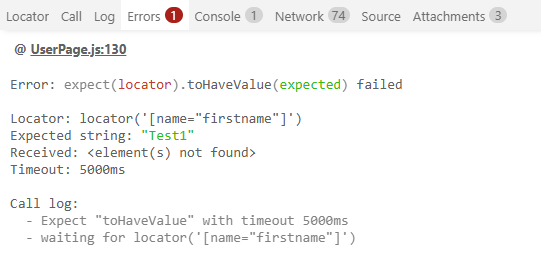
- Error Tab: Shows the exact line that failed and why. Tells you if the element was hidden, detached, or not ready for interaction.
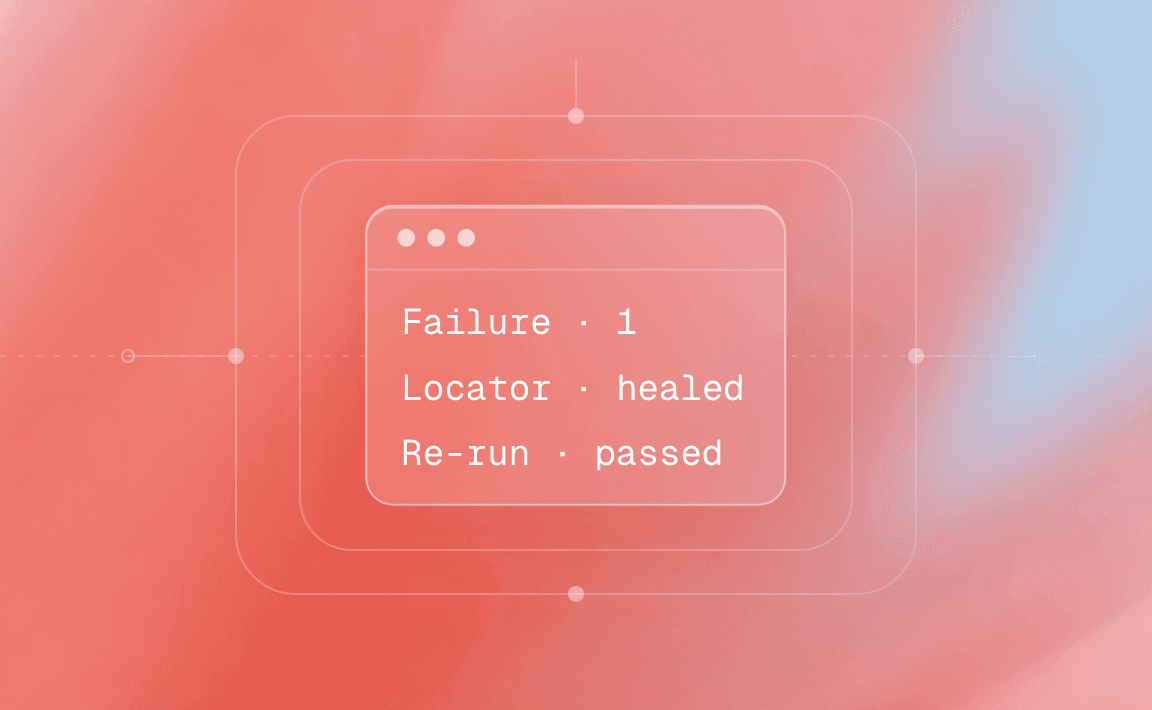
After inspecting a failure trace, do not stop there. The next step is to run the fix and confirm it works.
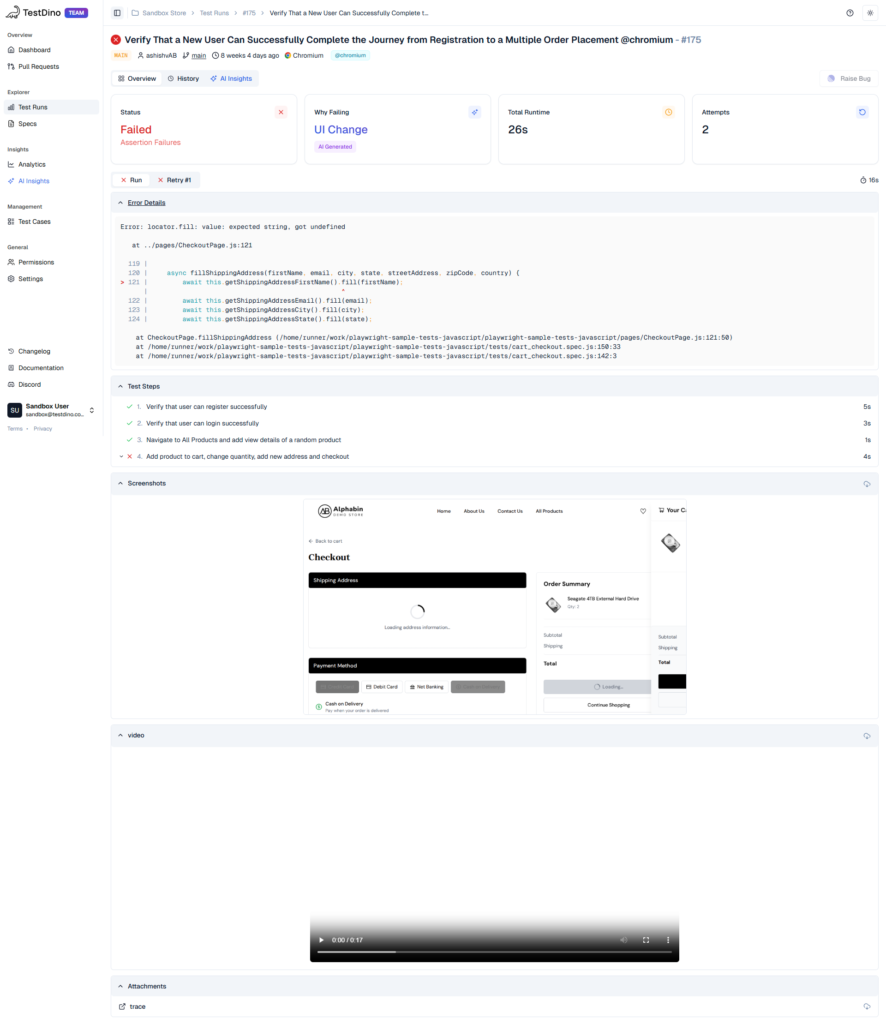
After running a fix locally or on a branch, jump to TestDino Test Case details to view attempts side-by-side.
This confirms the new test attempt passes and that the previous failure pattern is gone.
Set trace policy for CI without slowing builds
Traces are critical for debugging in Continuous Integration (CI), but storing them for every successful run wastes storage and slows uploads. Adopt a smart trace policy to only capture artifacts when they are needed most.
The best policy is often on-first-retry or retain-on-failure.
| Trace Option | Best Use Case | Signal Quality | Storage Cost |
|---|---|---|---|
| off | Local-only, simple checks, non-flaky suites. | Low (No trace artifact) | None |
| on | Deep debugging of rare, hard-to-repro bugs. | High (All data) | Very High (All runs) |
| on-all-retries | Capture traces for all retry attempts in flaky tests. | High (All retry attempts) | Medium–High (All retries only) |
| on-first-retry | Standard CI flakiness detection and triage. | Medium (Captures the first fail attempt) | Low (Only flaky/failed tests) |
| retain-on-failure | Capture full context for known intermittent failures. | High (Keeps last attempt trace) | Low (Only failed tests) |
| retry-with-trace | Automatically retry failed tests with tracing enabled to gather context. | High (Captures retry trace data) | Medium (Only retried failed tests) |
// playwright.config.ts
import { defineConfig } from '@playwright/test';
export default defineConfig({
  reporter: 'list',
  use: {
    trace: 'on-first-retry',       // capture rich trace only on first retry
    video: 'retain-on-failure',    // keep video when a test fails
    screenshot: 'only-on-failure', // save screenshot only on failure
  },
});
CI Artifacts and Triage: Once the trace is generated in CI, the build job must upload the trace.zip file as an artifact.
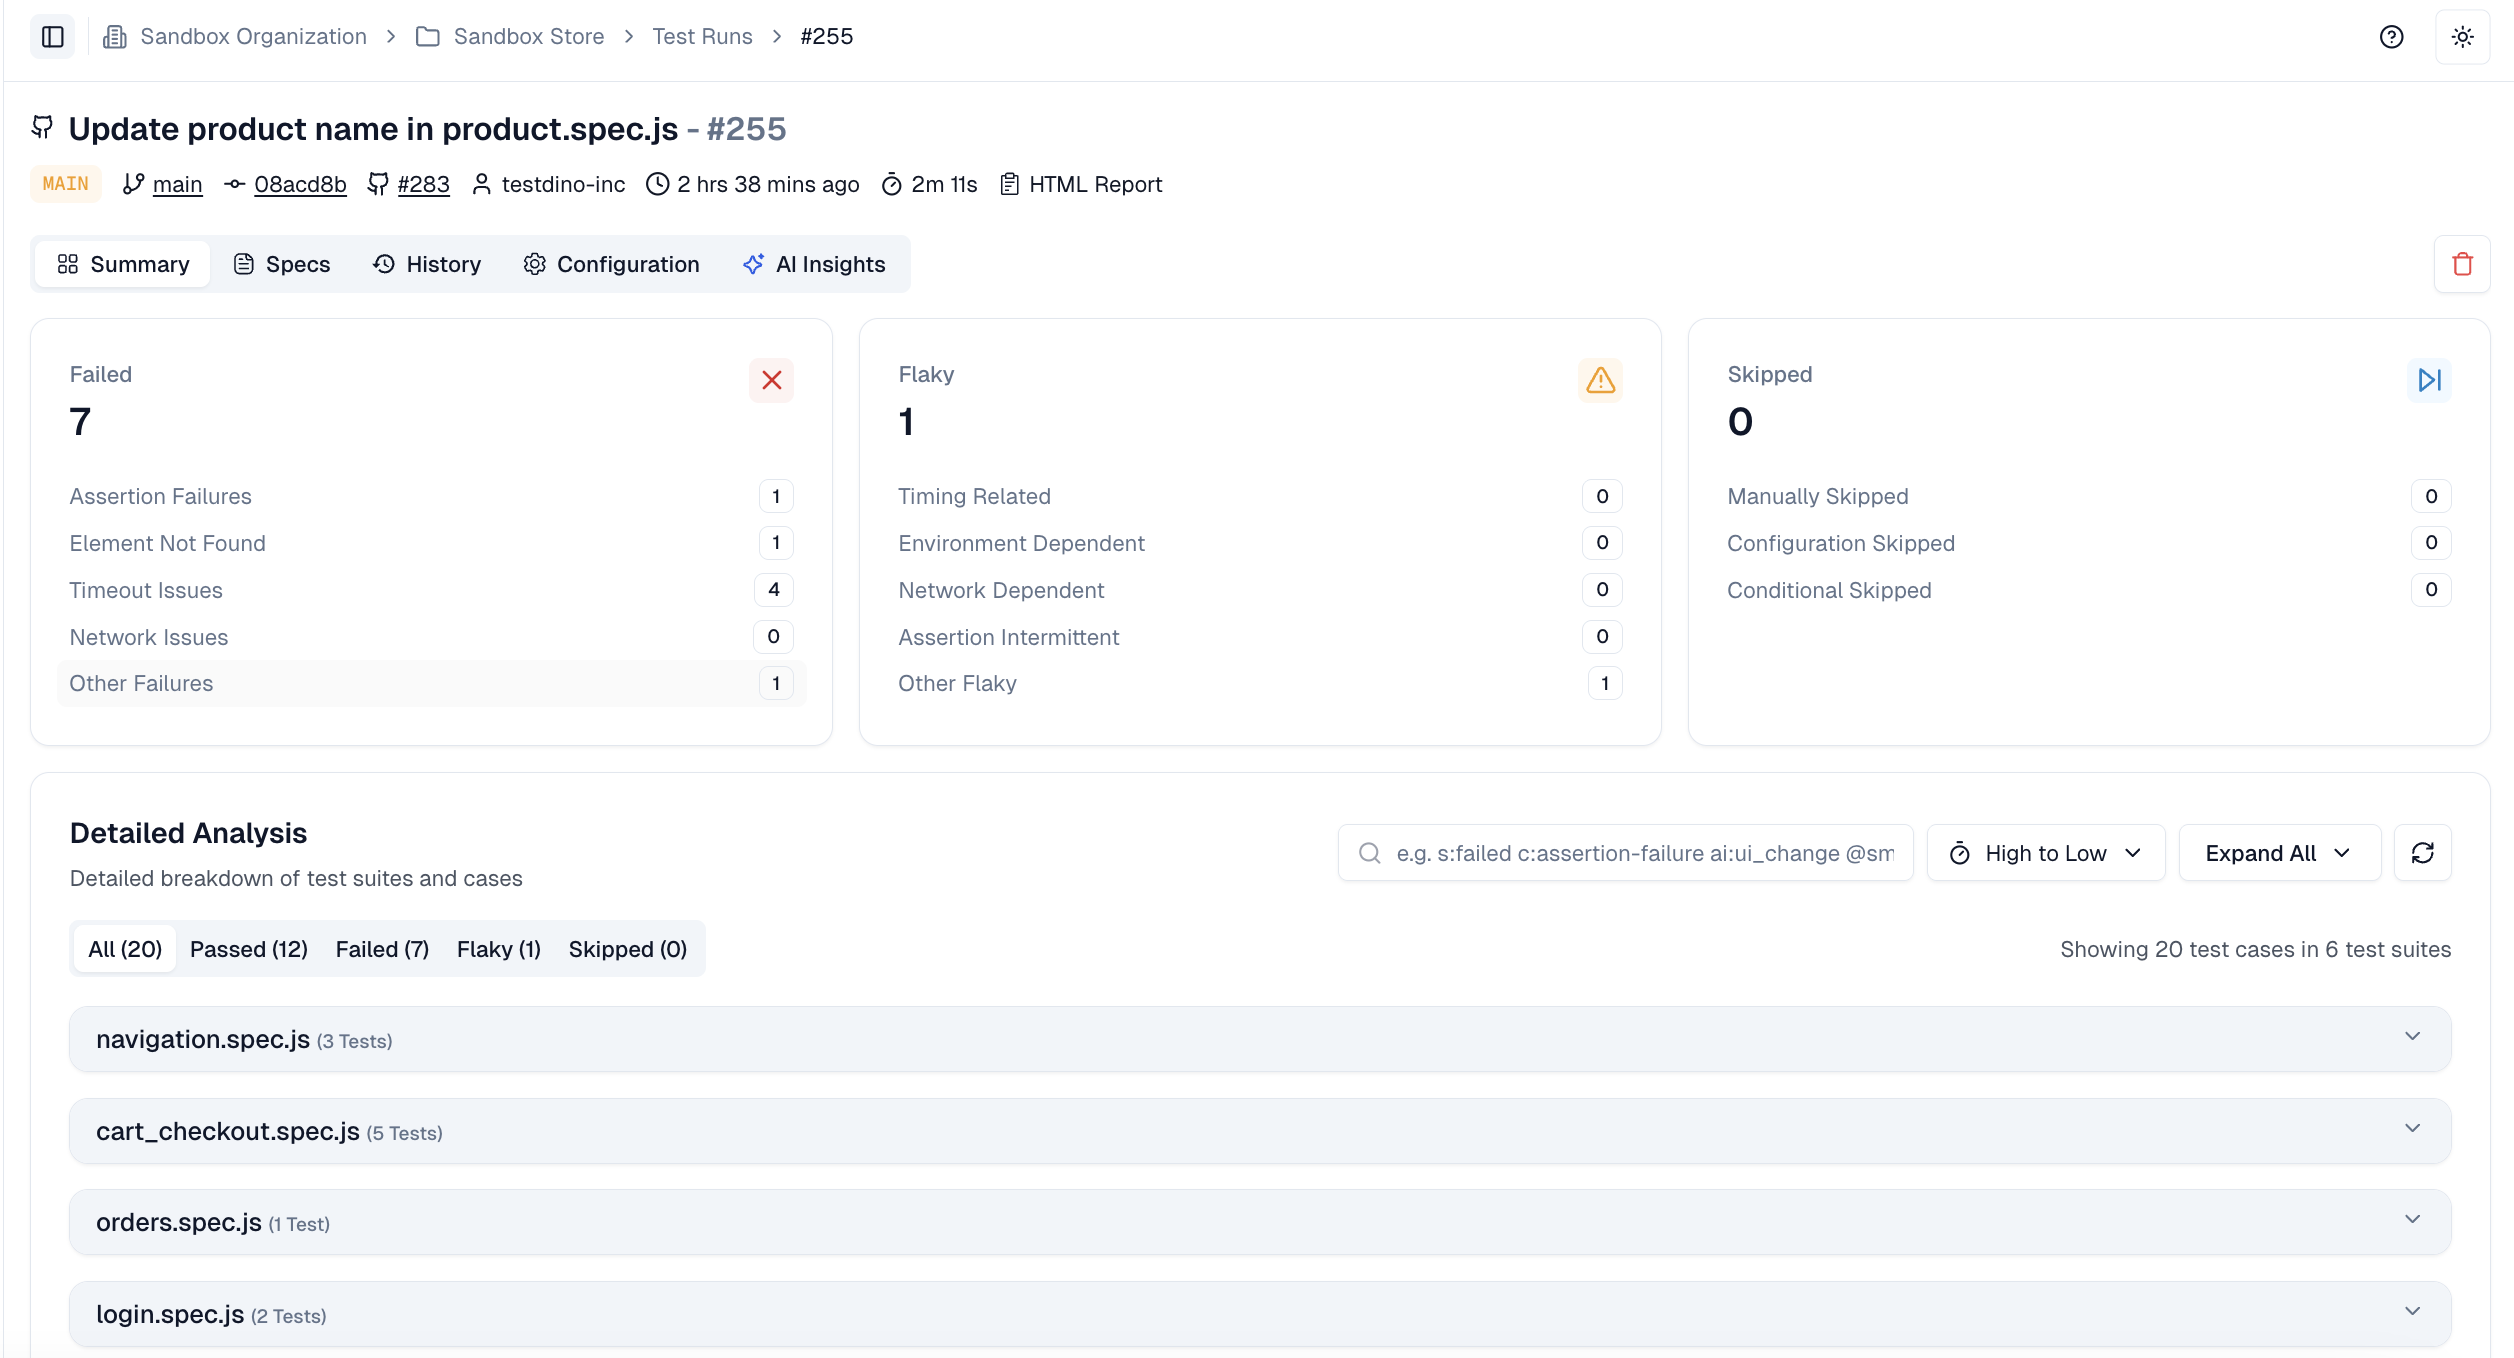
Teams should then use TestDino Summary to aggregate all run data, including links to the trace files, which are grouped by failure pattern for faster triage. This shifts the focus from hunting files to analyzing grouped failure trends.
What quick checks cut most debug time in Playwright?
Most end-to-end test failures in Playwright fall into a few predictable categories. Running a fast debug checklist can resolve over 60% of failures without needing a full code deep-dive.
Here are the top 5 quick checks to perform when a test fails:
1. Network Status Anomalies
Open the Network tab in the trace viewer or browser DevTools. Look for failed HTTP responses (especially 4xx and 5xx status codes). A backend error often prevents critical UI elements from loading a common hidden cause of downstream failures.
2. Console Errors
Check the Console tab for uncaught JavaScript exceptions or critical app errors. A front-end crash often prevents Playwright from interacting with the page reliably.
3. Strict Mode Violations
Review the Actionability Log. If Playwright reports the element is not visible, detached, or obscured, that means it failed its built-in strict checks. This usually indicates the selector needs adjustment or that a wait/scroll is missing before the action.
4. Detailed Actionability Failures
Beyond the error message, inspect the logs for why an action like click() or fill() failed:
-
Element not visible
-
Not attached to DOM
-
Has zero size
-
Not receiving pointer events
This pinpoints exactly what condition was missing.
5. Suspiciously Long Timeline Steps
In the Actions timeline, the longest bar often signals a problem. It may indicate an implicit wait that timed out, caused by a slow page load, broken service, or flaky async behavior.
The Power of Auto-Wait
Playwright's auto-wait is a major reason tests are stable, but also a frequent source of timeouts. Before any action, Playwright waits for all of these conditions
-
Element is attached to the DOM
-
Element is visible
-
Element is stable (not animating)
-
Element is enabled
-
Element can receive events
If any condition is never met, the test eventually times out. Use the trace viewer to see which condition failed.
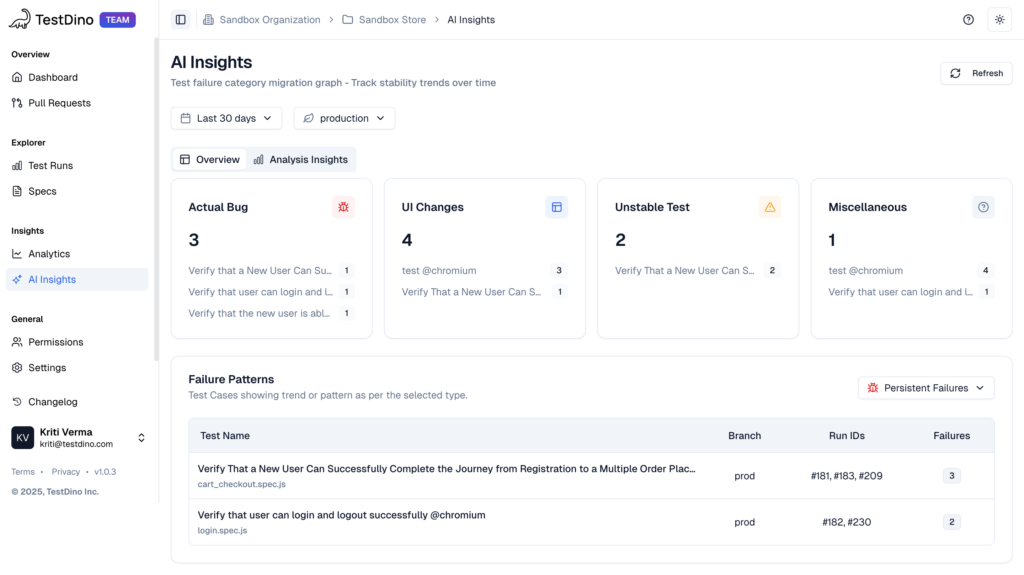
Accelerate Triage with AI Insights
Manual checks are powerful, but you can speed up analysis using tools like TestDino AI Insights, which automatically label failures by cause
| Label | Meaning | Action |
|---|---|---|
| Actual Bug | Consistent failure → Product defect | Fix the app |
| 🔄 UI Change | DOM or selector change | Update the locator |
| Unstable Test | Flaky test or timing issue | Stabilize or quarantine the test |
This accelerates the decision to fix, update a selector, or stabilize the test, cutting time spent deciding what to do next.
3. UI Mode, Inspector, and PWDEBUG, when to use which
Playwright offers multiple local playwright debug modes. Choosing the right one saves time when reproducing and fixing the issue on your local machine.
| Mode | Best For | Context | Artifacts |
|---|---|---|---|
| UI Mode | Interactive debugging, fixing selectors | Full-featured, visual runner (--ui) | No (local only) |
| --debug | Pausing at failure to inspect DOM/selectors | Manual step-through via Playwright Inspector | No (interactive) |
| PWDEBUG=1 | Lightweight terminal-based debugging | Headed browser + terminal console access | No (console only) |
| page.pause() | Precise, manual breakpoints in test code | Pauses at a specific line, opens DevTools | No (manual) |
UI Mode (npx playwright test --ui)
Best for: Selector repair, test flow analysis, test editing
Key features
-
Time travel: Step through each action
-
Locator picker: Generate robust locators (getByRole, data-testid)
-
Inline editing: Update test code and re-run without restarting the browser
Recommended for test authoring, locator tuning, and flaky test investigation
Inspector and PWDEBUG for Local Repro
The Playwright Inspector opens automatically when you run a test with the --debug flag or use page.pause(). The Inspector is a separate tool from the main browser window.
🐛Inspector (--debug)
Best for: Pausing the test to inspect DOM state or a failing action
npx playwright test tests/my-test.spec.ts --debug-
Automatically opens the Playwright Inspector UI
-
Lets you step over, inspect, or resume the test manually
🎯page.pause()
Best for: Debugging complex flows at a specific test step
test('my test', async ({ page }) => {
  await page.goto('/login');
  await page.pause(); // Pauses here
  await page.fill('#username', 'user');
});
Opens DevTools, lets you inspect, interact, and resume test from that point
Use PWDEBUG=1 when you want lightweight debugging directly in the terminal, giving you access to the $0 element in the DevTools console and helpers like playwright.$.
⚡ PWDEBUG=1
Best for: Quick, minimal debugging directly in the terminal
PWDEBUG=1 npx playwright test tests/login.spec.ts --headedGives access to Playwright helper functions like:
-
$0 – current selected DOM element
-
playwright.$('selector') – query elements in console
-
Lightweight alternative to full Inspector
After successfully reproducing and fixing a bug locally, ensure you re-run the updated test on a dedicated branch and push the artifacts to the run, so they appear in your TestDino Summary and Test Case evidence.
4. Rerun failed tests and confirm the fix
The "Trace-to-Fix" loop is not complete until you confirm the fix works and prevents recurrence. This requires a systematic approach to reruns and comparing attempts.
The Confirm-the-Fix Loop
| Step | Action | Purpose |
|---|---|---|
| 1. Fail | A test fails in CI | Entry point to RCA |
| 2. Trace | Open the trace from CI artifacts | Identify root cause using Trace Viewer |
| 3. Fix | Apply the fix (selector, wait, product bug, etc.) | Resolve the root issue |
| 4. Rerun Failed | Run only the failed test locally or in a branch: npx playwright test --last-failed | Validate in isolation |
| 5. Confirm | Review the result and signal of the rerun | Decide if fix is complete or more work is needed |
Confirmation Criteria
A passing test is not always a stable test. Pay attention to how the test passed
Pass on First Attempt
- The test passed without retries.
- Signal: Fix is stable.
- ✅ Safe to merge the code.
Pass Only on Retry
- The test failed initially but passed on a retry.
- Signal: The test is still flaky — the retry masked the issue.
- ❌ Do not merge yet.
Run:
npx playwright test --repeat-each=10This exposes intermittent failures and helps identify timing or async bugs.
Fix the root cause or quarantine the test if it's unstable.
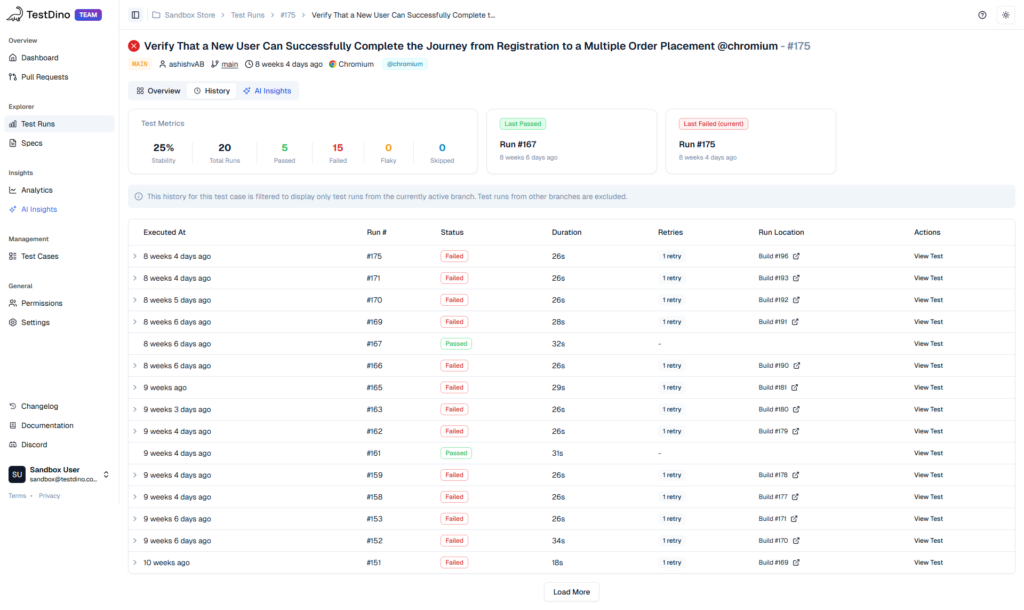
Side-by-Side Attempt Comparison
To confirm a fix or diagnose flakiness, you need to see the differences between a failed attempt and a successful one.
In TestDino Test Run, the Attempts panels show a side-by-side view of error details, steps, screenshots, and console output for every attempt of a flaky test.
This view lets you quickly compare the failing attempt (with its trace) against the successful one to validate that your fix changed the UI state or selector behavior as expected. This history preview helps detect new failures versus recurring issues.
5. Prevent repeat issues: selectors, waits, and network mocks
Stable Playwright tests are not just about fixing failures they're about preventing them. The fastest way to reduce MTTR (Mean Time to Resolution) is by avoiding test flakiness before it starts.
Focus on three pillars: resilient selectors, smart waiting, and mocked network dependencies.
Use Resilient Locators
Avoid brittle selectors like deeply nested CSS paths
// ❌ Brittle: breaks on minor layout changes
page.locator('body > div:nth-child(5) > button:nth-child(1)');
Instead, use semantic and stable locators
| Strategy | Example | When to Use |
|---|---|---|
| Role-based | page.getByRole('button', { name: 'Sign in' }) | Preferred: Uses ARIA roles |
| Test ID | page.getByTestId('login-button') | When roles or labels aren't ideal |
| Text/Label | page.getByLabel('Email') | For form fields and inputs |
Use data-testid attributes to decouple your tests from presentation logic without depending on fragile DOM paths.
Embrace Web-First Assertions
Avoid arbitrary waits like
// ❌ Flaky and slows down test execution
await page.waitForTimeout(3000);
Instead, let Playwright's Web-First Assertions handle timing automatically
// ✅ Stable and efficient
await expect(page.getByRole('heading', { name: 'Dashboard' })).toBeVisible();
These assertions auto-wait for
-
Visibility
-
Enablement
-
DOM attachment
-
Stability (no animation)
This ensures your test doesn't proceed until the element is truly ready for interaction reducing both flakiness and test time.
Mock the Network Layer
To prevent tests from breaking due to slow or unavailable backend APIs, mock or route API responses using page.route(). This stabilizes the test and focuses it on the front-end logic.
// Mock a successful login API response
await page.route('**/api/v1/auth', async route => {
  await route.fulfill({
    status: 200,
    contentType: 'application/json',
    body: JSON.stringify({ token: 'mock-token' }),
  });
});
This:
-
Prevents test failures due to backend outages or slow responses
-
Speeds up test execution
-
Focuses the test on UI behavior, not external systems
Use mocks wherever backend behavior is predictable and not under test.
This isolates the UI test from environment or API latency issues, reducing a common source of instability. Use TestDino Analytics to identify failure clusters and test duration spikes that point to external dependencies over time.
6. CI playbook: artifacts, PR comments, and remote traces
Debugging at scale requires treating the CI pipeline as the primary source of evidence. The key is to map the raw trace.zip file back to the code change that triggered the failure.
Key Goals:
-
Capture rich artifacts (traces, reports)
-
Link them directly to pull requests
-
Make them accessible without friction
Step 1: Upload Key Artifacts
Ensure your CI job uploads the Playwright test artifacts so they are preserved and accessible from PRs.
Artifacts to include:
-
playwright-report/
-
test-results/
-
Any trace.zip files from failed tests
GitHub Actions Snippet
- name: Upload Playwright Artifacts
  uses: actions/upload-artifact@v4
  with:
    name: playwright-artifacts-${{ github.sha }}
    path: |
      playwright-report
This preserves the trace and report files as downloadable artifacts for any commit or PR.
Step 2: Post PR Comments with Results
Automatically comment on the PR with:
-
Pass/fail status
-
Number of flaky tests
-
Direct link to the TestDino summary or CI test dashboard
-
Link to trace artifacts or report viewer (hosted or downloadable)
This ensures that:
-
Developers don't need to dig through CI logs
-
Reviewers see immediate test impact
-
Failures are visible before merg
Step 3: Make Traces Remotely Viewable
Instead of forcing engineers to download trace.zip files and open them manually, make them remotely accessible:
-
Host them on secure, temporary storage (e.g. AWS S3, GitHub Pages, GCS)
-
Link directly to playwright-report/index.html if it can be viewed online
-
Use tools like TestDino to automatically make trace navigation easier
TestDino: Smarter Test View for PRs
The TestDino PR View automatically maps every test run back to the corresponding Pull Request.
Instead of manually parsing CI logs, the PR View shows the latest test run status (Passed, Failed, Flaky) for each PR.
Developers and reviewers can use the PR View to get a deep link to the TestDino Summary for that specific commit and run.
This bypasses the need to search CI artifacts, providing failure grouping and history instantly.
Conclusion
Mastering Playwright debug isn't just saving trace files. It's using a simple Trace-to-Fix flow that connects CI failures to clean, reliable fixes.
With smart trace settings, solid locators, and web-first checks, you cut flakiness before it slows the team.
TestDino adds clarity by grouping failures, showing retries side by side, and tracking MTTR so you fix faster.
It turns raw Playwright traces into insights you can act on, instead of hunting through logs.
Put both together and you get a solid loop. CI runs produce rich traces, you analyze them visually, confirm fixes, and keep the suite stable with real data instead of guesswork.
FAQs

Pratik Patel
Co-founder