Flaky Test Benchmark Report 2026: Rates, Root Causes, and Cost Implications
Flaky tests are increasing across the industry. This report compiles benchmark data, causes, costs, and detection strategies for modern CI pipelines.


Flaky tests are getting worse, not better. That's the short version.
The Bitrise Mobile Insights 2025 report analyzed over 10 million builds across 3.5 years and found that the proportion of teams experiencing test flakiness grew from 10% in 2022 to 26% in 2025. During the same period, pipeline complexity increased by 23%.
This report compiles benchmark data from Google, Microsoft, Atlassian, Bitrise, and peer-reviewed academic research into a single source. If you need numbers to justify fixing flaky tests, budget for a flaky test detection tool, or benchmark your team's flakiness rate against the industry, the data is here.
For context on how flaky tests fit into broader test analytics and test failure analysis workflows, we've linked relevant guides throughout.
Flakiness rates are rising, not falling
You'd expect that better frameworks, smarter CI tools, and AI-powered testing would reduce flakiness. The data says otherwise.
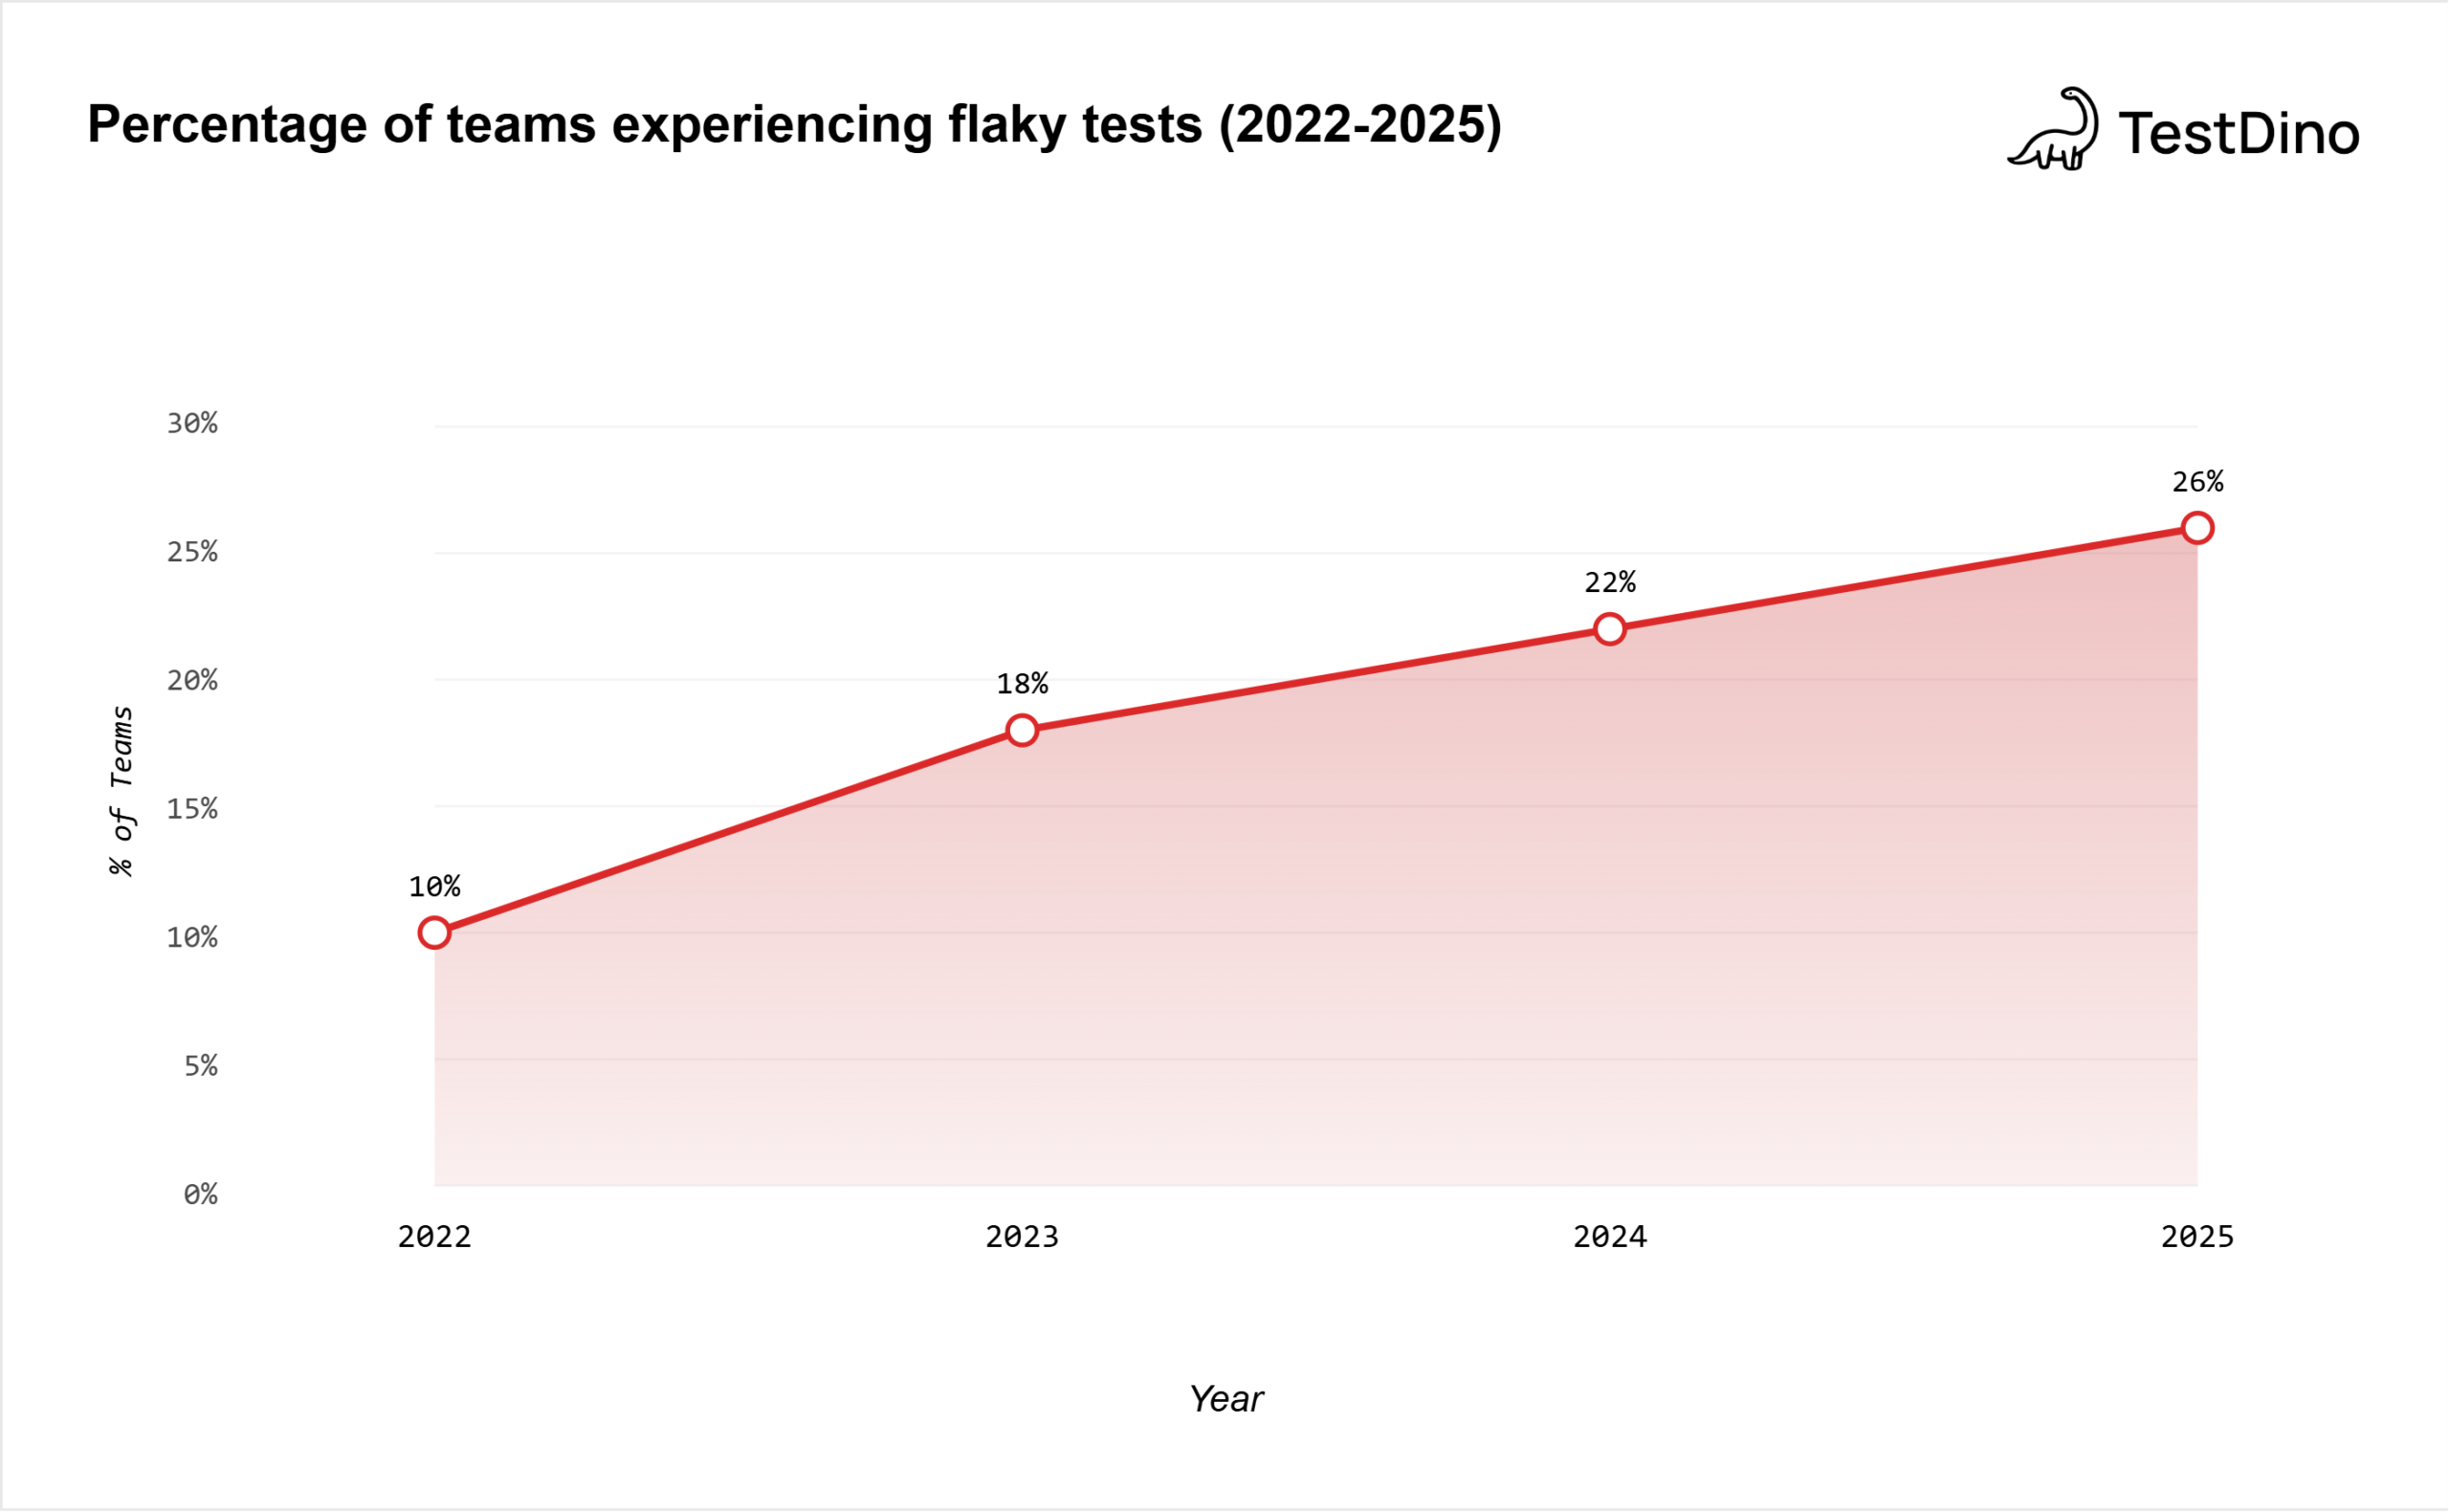
Source: Bitrise Mobile Insights 2025, based on 10M+ builds across 3.5 years (Jan 2022 - Jun 2025)
The Bitrise report tracked this across 10 million+ builds:
| Year | % of teams experiencing flakiness | Pipeline complexity (relative) |
|---|---|---|
| 2022 | 10% | Baseline |
| 2025 | 26% | +23% |
That's a 160% increase in the proportion of teams dealing with flaky tests. In three years.
Why is it getting worse?
-
Test suites are growing. Teams run more unit, integration, and E2E tests earlier in the pipeline. More tests mean more surface area for flakiness.
-
Pipelines are more complex. The 23% increase in workflow complexity means more steps, more environments, and more opportunities for non-deterministic behavior.
-
Parallelism introduces new failure modes. Running tests across multiple containers or shards introduces timing and state-sharing issues that don't occur in sequential runs.
-
Third-party dependencies multiply. Every API call, cloud service, or external database your tests touch is another source of instability.
Important Note: Flakiness increasing doesn't mean teams are writing worse tests. It means the testing problem space is growing faster than current tools and practices can keep up.
Benchmark flaky test rates by company
What does flakiness look like at companies that actually measure it? Here's what the published data shows:
| Company | Flakiness metric | Value | Source |
|---|---|---|---|
| % of flaky tests | 16% | Google Testing Blog, 2016 | |
| % of all test executions that are flaky | 1.5% | Google Testing Blog, 2016 | |
| % of pass-to-fail transitions caused by flakes | 84% | Google Testing Blog, 2016 | |
| Atlassian | % of Jira Backend repo failures from flakes | 15% | Atlassian Engineering, 2025 |
| Atlassian | % of Jira Frontend master build failures from flakes | 21% | Atlassian Engineering, 2025 |
| Microsoft | % of test failures that are flaky | 13% | Microsoft Research |
| GitHub | % of commits with a flaky-caused red build | 9% | GitHub, 2020 |
| Large orgs (survey) | % with >5% non-deterministic results | 24% | LambdaTest Survey, 2026 |
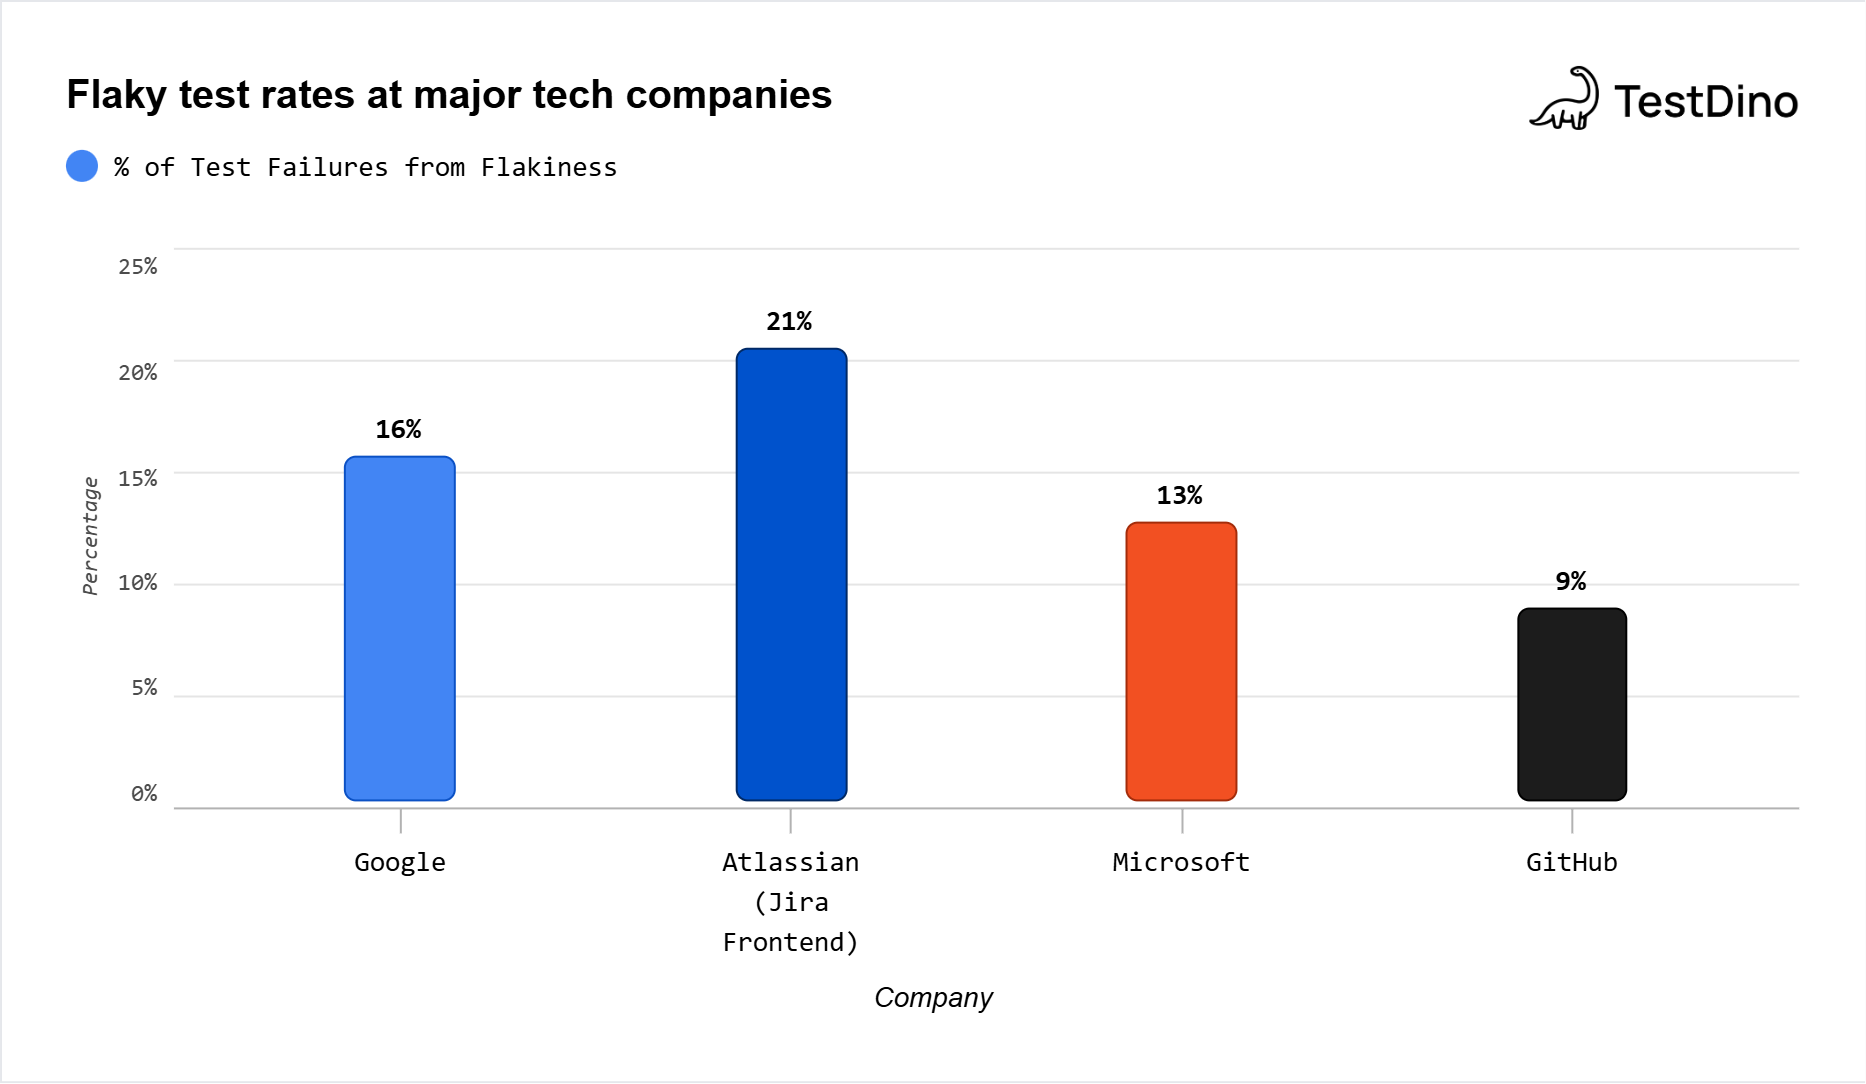
Flaky test rates at major tech companies. Metric used = % of tests/failures that are flaky.
A few things jump out from this.
First, Google's 1.5% per-execution rate sounds low. But across millions of daily test runs, it affects 16% of their total test inventory. That's roughly 1 in 7 tests showing flaky behavior at some point.
Second, the 84% figure is the stat that should alarm every QA team. It means the vast majority of "failures" your CI flags are not actual regressions. They're false alarms that waste debugging time.
Third, even GitHub, which runs relatively mature infrastructure, had 1 in 11 commits produce a flaky-caused red build back in 2020. That rate has likely increased given the Bitrise trend data.

Tip: If you don't measure your flaky test rate, you can't improve it. Start by tracking the number of tests that produce inconsistent results over a 30-day window. Divide that by your total test count. That's your baseline flaky rate. Compare it against the benchmarks above.
TestDino automatically tracks flaky test patterns across Playwright test suites, flagging tests that produce inconsistent results and classifying failure types so teams can triage without manual log inspection. See how it works.
Root cause breakdown: where flakiness comes from
Knowing your flaky rate is step one. Knowing why tests are flaky is step two.
The most comprehensive root cause analysis comes from Luo et al.'s study (FSE 2014), which analyzed 201 commits that fixed flaky tests across Apache projects. A 2023 multivocal review on ScienceDirect covering 651 articles confirmed that these categories remain the primary taxonomy used in both research and industry.
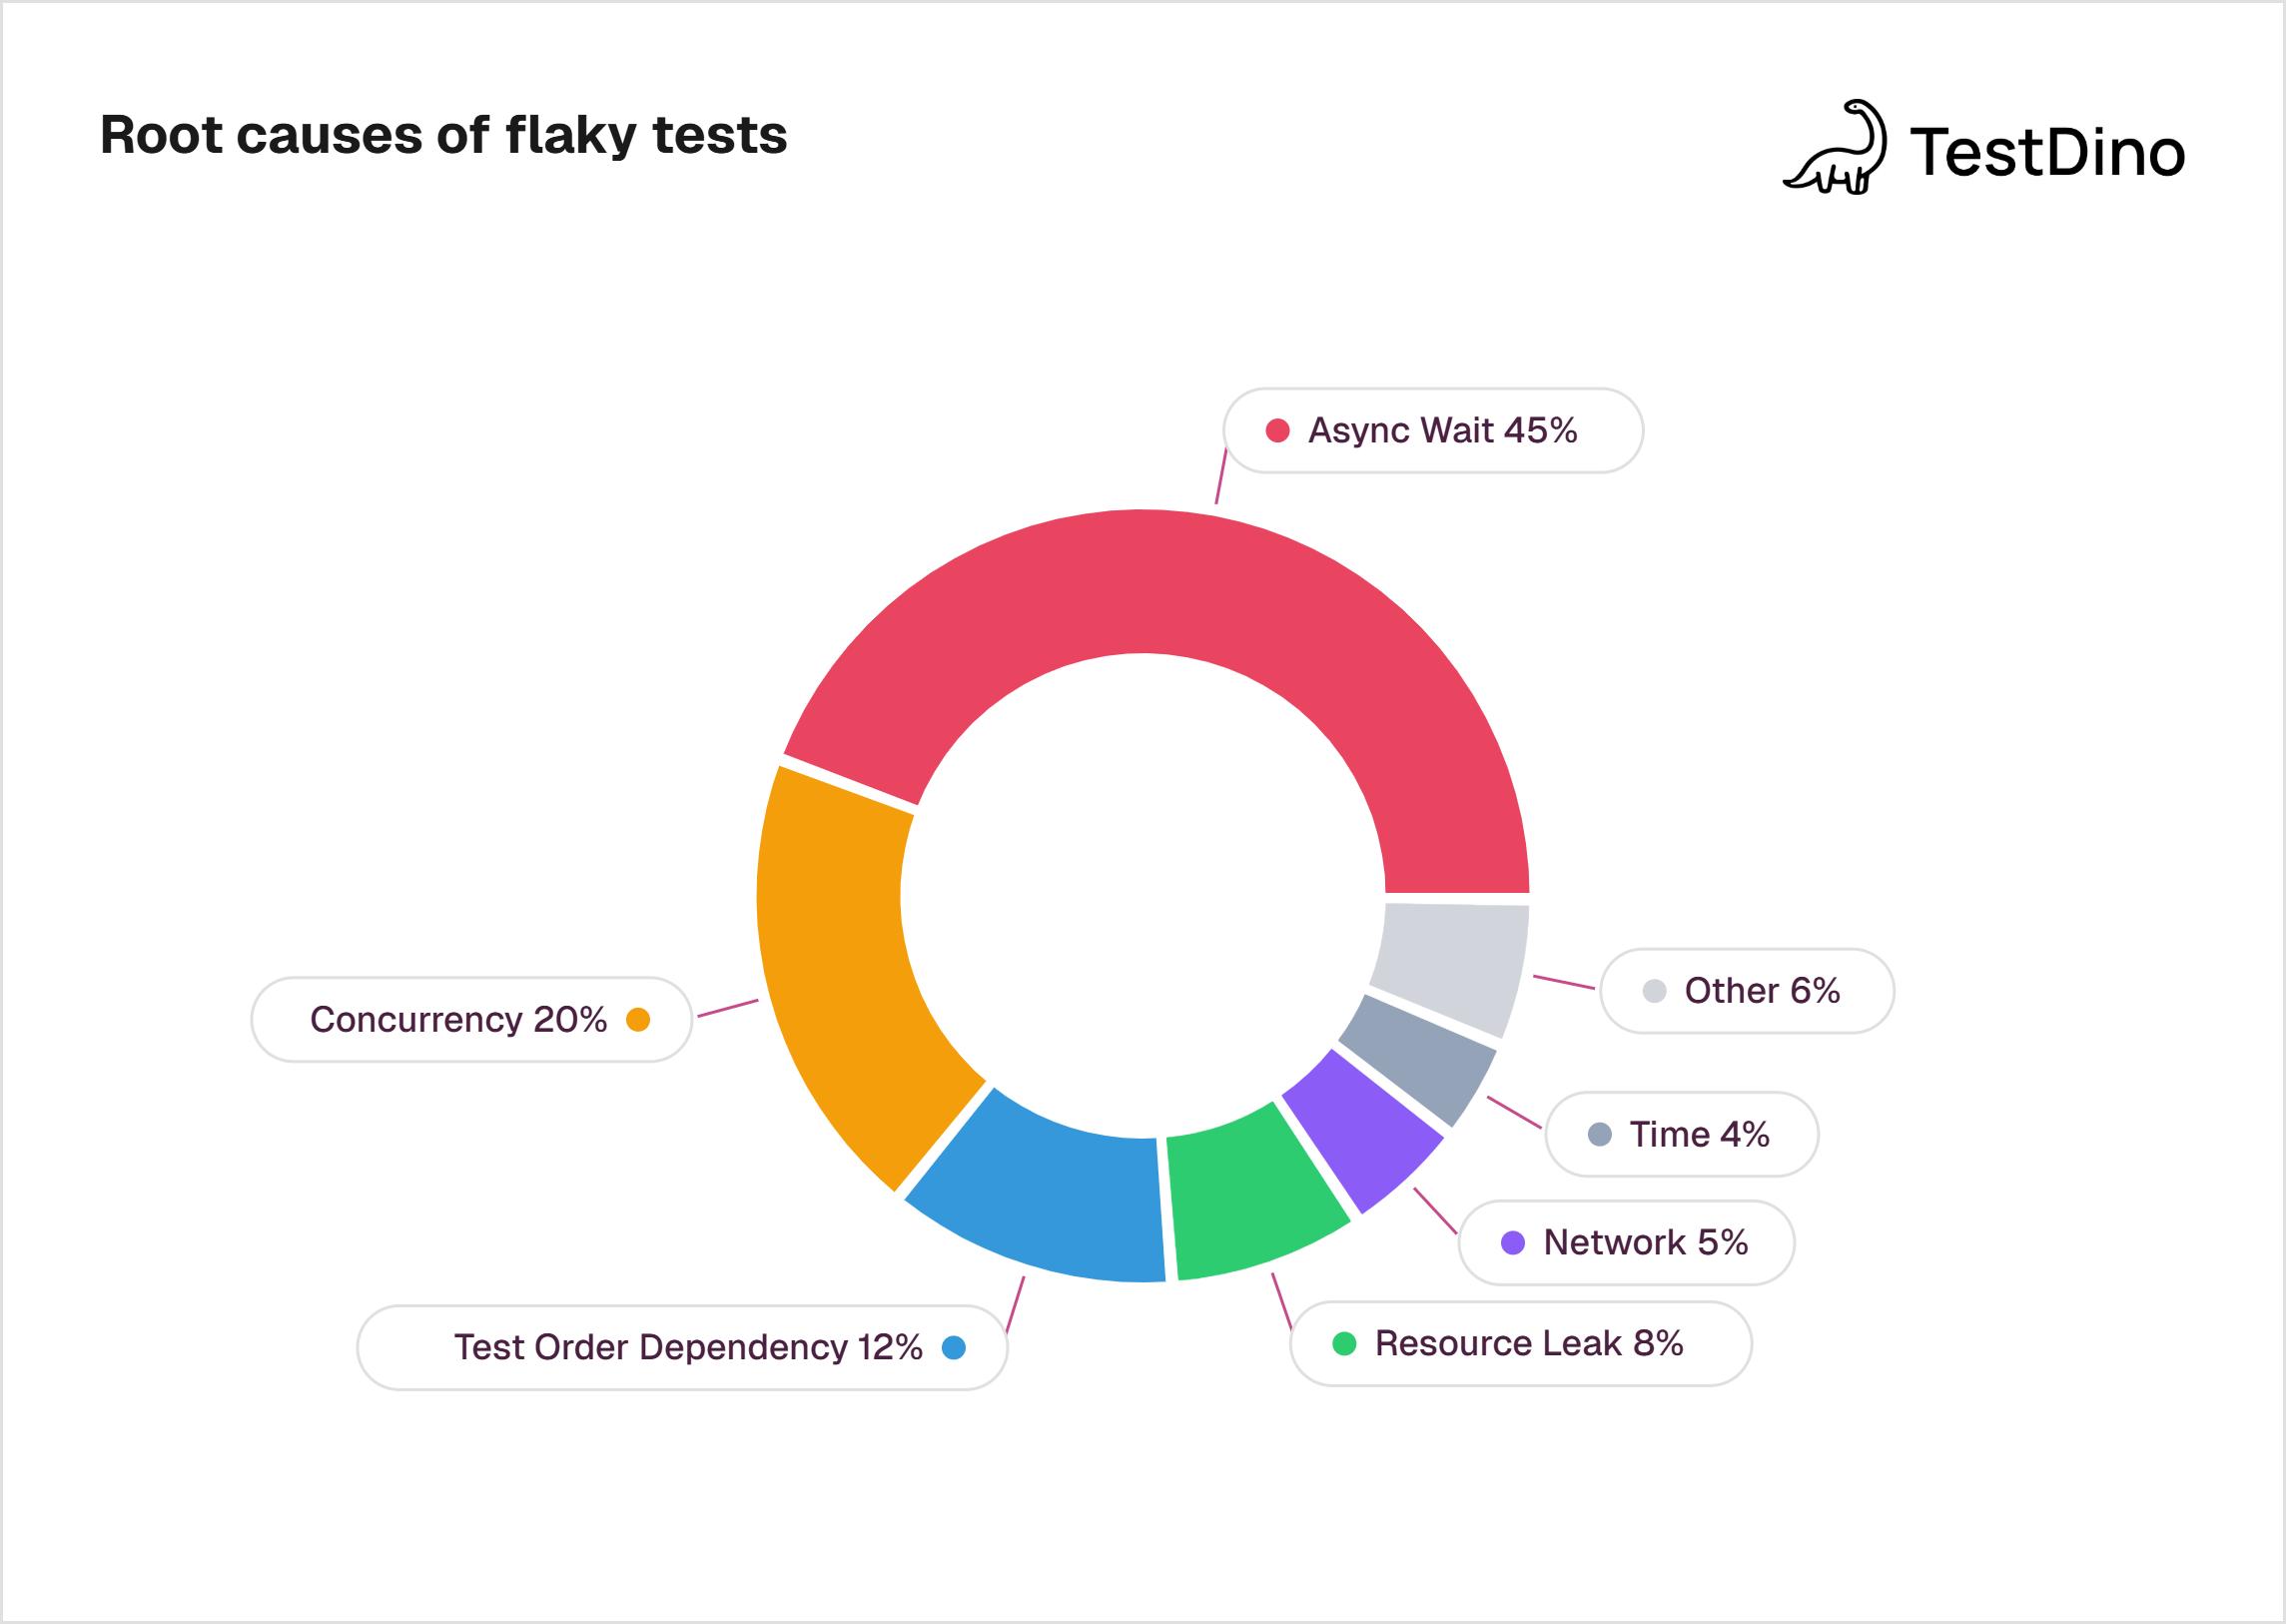
Source: Luo et al., 'An Empirical Analysis of Flaky Tests,' FSE 2014.
| Root cause | % of flaky tests | What it means |
|---|---|---|
| Async wait | 45% | Test doesn't wait long enough for an async operation to finish |
| Concurrency | 20% | Race conditions, data races, or deadlocks between threads |
| Test order dependency | 12% | Test assumes a specific execution order or shared state |
| Resource leak | 8% | Tests don't clean up files, connections, or memory |
| Network | 5% | External API timeouts, DNS failures, or flaky connections |
| Time | 4% | Tests depend on system clock, time zones, or date-specific logic |
| Other (IO, randomness, floating point, unordered collections) | 6% | Less common but still real |
Nearly half of all flakiness comes from a single cause: async wait. Tests that use fixed sleep timers instead of waiting for a specific condition to be true. The fix is usually straightforward (replace sleep(5) with an explicit wait), but teams often don't know which tests are affected until the damage is done.
The concurrency category (20%) is harder to fix. Race conditions between threads, atomicity violations, and deadlocks require deeper code-level investigation.
Important tip for Playwright teams: Playwright's built-in auto-wait mechanism addresses the biggest root cause (async wait) at the framework level. Tests wait for elements to be actionable before interacting with them. This is one reason why teams report 50% fewer flaky tests after migrating to Playwright from Selenium or Cypress.
For a detailed guide on managing Playwright flaky tests in practice, including quarantine strategies and retry configuration, we've covered that separately.
The financial cost of flaky tests
Flaky tests aren't just annoying. They're expensive.
Here's what the numbers look like across published studies:
| Cost metric | Value | Source |
|---|---|---|
| Microsoft's annual cost from flaky tests | $1.14 million/year | BrowserStack / Microsoft Research |
| Google's coding time lost to flaky tests | 2% | Google (StickyMinds analysis) |
| Cost per 50-dev team at 2% productivity loss | $120,000/year | StickyMinds calculation (avg $120K salary) |
| Atlassian developer hours wasted on flaky tests | 150,000+ hours/year | Atlassian Engineering, 2025 |
| % of QA time spent on flaky tests (enterprise) | 8% | LambdaTest Survey, 2026 |
| Flaky test detection AI market size (2024) | $512 million | Reproto, 2025 |
Let's do some quick math for a typical mid-size engineering team.
Say you have 50 developers, each earning $120,000/year on average. Google's data show that 2% of coding time is spent on flaky test investigation. That's $120,000 in lost productivity per year for your team. For enterprise teams, the LambdaTest survey puts the figure closer to 8% of QA time, which scales up quickly.
And that's just the direct cost. The hidden costs include:
-
Delayed releases from blocked pipelines
-
Context switching when developers stop feature work to investigate false failures
-
Trust erosion where teams start ignoring real failures because "it's probably just that flaky test"
-
CI computes waste from unnecessary reruns
Note: Microsoft reduced their overall flakiness by 18% in six months after implementing a company-wide "fix or remove within two weeks" policy for flaky tests. That initiative saved an estimated 2.5% increase in developer productivity (StickyMinds).
Pipeline impact: from one flaky test to a broken build
Here's where the math gets uncomfortable.
A single test with an individual flakiness rate of 0.01% to 0.03% sounds negligible.
But David Gomes documented what this looks like in practice: his team's pipeline runs 4,000+ tests per build. At a flaky rate of 0.01-0.03% per test, 30% to 60% of their complete pipelines fail.
The cascade works like this:
| Individual test flaky rate | Tests per pipeline | Probability of at least one flaky failure |
|---|---|---|
| 0.01% | 100 | ~1% |
| 0.01% | 1,000 | ~10% |
| 0.01% | 4,000 | ~33% |
| 0.03% | 4,000 | ~70% |
One test needs to fail for the whole pipeline to go red. When you're running thousands of tests, even a tiny per-test flaky rate compounds into frequent pipeline failures.
The GitHub data confirms this at industry scale: 1 in 11 commits (9%) had at least one red build caused by a flaky test in 2020.
This has real consequences for CI/CD workflow:
-
Developers rerun pipelines instead of investigating. That wastes compute and delays merges.
-
Build queues back up. Every rerun pushes other PRs further down the queue.
-
Release confidence drops. When red builds are routine, teams stop trusting the CI signal entirely.
For teams running Playwright in CI, the CI/CD integration guide covers how to configure retry strategies and sharding to reduce pipeline failure rates without masking real bugs.
How teams detect flaky tests
A developer survey (Eck et al., 2019) found that 58% of developers deal with flaky tests at least monthly. Of those, 79% rate it a moderate or serious problem. Yet many teams still lack systematic detection.
Here are the main approaches, ranked by sophistication:
| Detection method | How it works | Effectiveness |
|---|---|---|
| Manual observation | Developer notices a test that "sometimes fails" | Low. Relies on memory. Misses infrequent flakes. |
| Automatic reruns | CI reruns failed tests 1-3 times. If it passes on retry, it's flagged as flaky. | Medium. Catches active flakes. Misses dormant ones. |
| Historical analysis | Track pass/fail patterns over 100+ runs. Tests with mixed results get a flakiness score. | High. Statistically sound. Needs data infrastructure. |
| AI-powered classification | ML models analyze test code and execution logs to predict flakiness. | Emerging. FlakyGuard (ASE 2025) repairs 47.6% of reproducible flaky tests. |
| Platform-level detection | Dedicated tools like Atlassian's Flakinator ingest test results at scale and auto-detect inconsistencies. | High. Atlassian reports 81% detection rate. |
The most important finding from Bitrise: teams using monitoring tools experience 25% fewer flaky reruns. Detection alone reduces waste.
Atlassian's Flakinator processes 350+ million test executions per day across its monorepo. The system uses implicit retries to catch flaky signals, then logs them in a database for future builds. The result: 81% detection rate for certain products and a path from detection to quarantine to resolution.
For Playwright teams, TestDino provides automatic flaky test classification, retry heatmaps, and per-PR failure breakdowns that surface which tests are consistently flaky vs randomly failing. This is the same pattern Atlassian's Flakinator uses, applied specifically to Playwright test suites.

Framework comparison: Flakiness by testing tool
Not all frameworks produce the same flakiness rates. The testing tool you use directly impacts how many flaky tests your team deals with.
Based on TestDino's performance benchmark analysis and industry reports:
| Factor | Playwright | Cypress | Selenium |
|---|---|---|---|
| Built-in auto-wait | Yes (default) | Yes (built-in retries) | No (manual waits required) |
| Reported flakiness after migration | 50% fewer flaky tests (from Selenium) | Improved with retries, but complex async apps still flake | Historically most brittle |
| Parallel execution | 15-30 concurrent via browser contexts | Requires paid Cloud | Requires Grid infrastructure |
| Protocol | CDP + native | In-process (limited to one browser tab) | WebDriver HTTP bridge |
| E2E maintenance effort | 40-50% of testing effort (industry avg) | 40-50% of testing effort | 40-50% of testing effort |
An independent analysis described Selenium as "the historical source of flakiness" due to its protocol overhead, while noting that Playwright "combines the best of both" by offering Cypress speed and Selenium flexibility.
The key difference is architectural. Playwright's auto-wait directly targets the #1 root cause of flakiness (async wait, 45% of all causes). Instead of developers writing explicit waits or sleep timers, Playwright waits until elements are actionable before interacting with them.
This matters for benchmarking. If your team runs Selenium and measures a 5% flaky rate, switching to Playwright could cut that to 2.5% or lower based on reported migration outcomes.
For teams evaluating a move, the Selenium vs Cypress vs Playwright comparison and Cypress to Playwright migration guide cover the decision in detail.
How often do developers deal with flaky tests?
The short answer: constantly.
A developer survey by Eck et al. (2019), replicated and extended by Parry et al. in their ACM Survey of Flaky Tests, found:
| Frequency | % of developers |
|---|---|
| Daily | 15% |
| Weekly | 24% |
| Monthly | 20% |
| A few times a year | 32% |
| Never | 9% |
Only 9% of developers say they never deal with flaky tests. The rest, 91%, face the problem at least once a year.
Of those 91%:
-
56% describe it as a moderate problem
-
23% describe it as a serious problem
The LambdaTest survey of 1,600+ QA professionals adds another angle: 77% of developers say flaky tests are a time-consuming part of their work that pulls them away from feature development.
The most commonly cited consequence? Wasted developer time. Across every survey and study reviewed for this report, time waste ranks as the #1 negative effect of flaky tests, ahead of lost trust, delayed releases, and increased CI costs.
Note: The automotive industry reports even higher flakiness impact than the software industry average, according to the Eck et al. survey. If your team works on embedded systems or connected vehicles, expect higher rates.
What the best teams do differently
The Bitrise data reveals a clear gap between teams that actively manage flakiness and those that don't.
Teams using observability tools saw 25% fewer flaky reruns and maintained higher build success rates. That's not from fixing flaky tests. That's just from being able to see them.
Here's what high-performing teams do:
- Measure first, fix second. Track your flaky test score weekly. Even a basic dashboard showing "these 10 tests failed inconsistently this week" changes behavior. It turns an invisible problem into a visible one.
- Quarantine, don't delete. Move flaky tests to a separate quarantine suite. They still run, but they don't block the main pipeline. Atlassian's Flakinator does this automatically. Define clear criteria for when a quarantined test can return: consecutive passing runs, documented root cause fix, and owner assignment.
- Fix or remove within two weeks. Microsoft's policy: if a flaky test isn't fixed within two weeks, it gets removed. This prevents the backlog from growing indefinitely. The result was an 18% reduction in overall flakiness within six months (StickyMinds).
- Invest in framework-level prevention. Choosing a framework with built-in auto-wait (Playwright) prevents the #1 root cause before it happens. For teams already on Playwright, following the Playwright automation checklist helps catch common anti-patterns early.
- Use AI-assisted repair. FlakyGuard (ASE 2025) demonstrated that AI can repair 47.6% of reproducible flaky tests, with 51.8% of fixes accepted by developers. The approach treats code as a graph structure and uses selective exploration to find relevant context. This is early-stage but promising. The AI-enabled testing market is projected to grow from $1.01 billion in 2025 to $4.64 billion by 2034 with a 18.3% CAGR.
- Connect flaky test data to PR workflows. Developers need to see flaky test data where they already work: in the pull request. TestDino's PR health view shows every test run associated with a PR, including retry patterns and flaky classifications. This reduces blind retriggers and gives reviewers the context to know whether a red build is real or noise.
FAQs
Table of content
Flaky tests killing your velocity?
TestDino auto-detects flakiness, categorizes root causes, tracks patterns over time.
Follow Us