Playwright HTML Reporter: A Complete Guide
Playwright’s HTML Reporter turns raw test results into an interactive, visual dashboard with test status, screenshots, videos, and traces which makes failures easy to debug and share across teams.


As Playwright test suites grow, a green run by itself stops being enough. Teams want to know what actually happened during the run, not just whether it passed. Details like timing, retries, and the order of failures start to matter more than a final status.
Those questions come up fast. Which step took the longest, where retries kicked in, and whether a failure was real or simply fixed on retry. Without clear visibility, teams end up scrolling through logs and making assumptions.
Playwright includes built-in reporters to solve this problem in different ways. Some focus on quick terminal feedback, others on structured output for CI.
The HTML reporter is designed for clarity, giving a visual, step-by-step view of test execution that makes understanding failures much easier.
Built-in Reporters
Playwright includes several built-in reporters, each designed to support a different workflow.
-
List reporter: Prints detailed test results to the terminal as tests run. Shows test names, status, and basic timing. Best suited for local development when readable console output is needed.
-
Dot reporter: Displays a compact dot-based progress view in the terminal, where each dot represents a test result. Useful for large test suites where minimal terminal output is preferred.
-
JSON reporter: Generates structured test results in JSON format, including status, retries, and timing. Commonly used when test data needs to be consumed by scripts, tools, or external systems.
-
JUnit reporter: Produces test results in JUnit XML format, which is widely supported by CI systems and test dashboards. Ideal for CI pipelines that require standardized reporting.
-
HTML reporter: Creates an interactive, browser-based report showing test status, step-by-step execution, timing, retries, screenshots, traces, and errors. Best for debugging, reviewing failures, and sharing results across the team.
Each reporter fits a different need. Some focus on speed and simplicity, others on structured output for automation. The HTML reporter stands out when the goal is to clearly understand how a test ran, which makes it the natural place to start next.
What Is the Playwright HTML Reporter
The Playwright HTML reporter is a built-in reporting option that generates a local, browser-based report after each test run. Its purpose is to present test execution data in a clear and structured format that is easy to review.
The report includes test status, step-by-step execution, timing for each step, retries and attempts, screenshots, traces, and readable error details. All of this information is grouped under the test that produced it, so the full context of a run is preserved.
The report is created automatically by Playwright and can be opened in any browser. Apart from enabling it in the configuration file, no additional setup or code changes are required.
Why Teams Use the HTML Reporter
Terminal output is fast, but it becomes difficult to work with as soon as tests fail or retry. Logs grow large, important details get buried, and understanding the sequence of events is hard, especially in CI environments.
The HTML reporter solves this by presenting test execution as a visual, structured view. Retries remain grouped with their test, step-level failures are easy to spot, and timing information is visible without scanning logs.
Teams commonly rely on the HTML reporter when debugging retry-heavy tests, reviewing CI failures through stored artifacts, or sharing test results with teammates who were not involved in writing the tests.
How the Playwright HTML Reporter Works
During execution, Playwright emits lifecycle events such as test start, step start and end, retry attempts, attachments, and test completion. These events represent the exact flow of the test run.
The HTML reporter listens to these events and records the data directly as tests execute. This ensures the report reflects real execution behavior without post-processing or interpretation.
After the run completes, Playwright generates a report directory containing an index.html file and supporting assets. Opening this file in a browser renders an interactive interface where each test, step, retry, and failure can be inspected in detail.
When to Choose the HTML Reporter
The HTML reporter is the right choice when the goal is to understand test behavior, not just record results.
Use the HTML reporter when:
-
You want to inspect failures visually instead of reading logs
-
You care about step-level timing and execution order
-
You want retry context grouped under the same test
-
You need screenshots and traces tied directly to steps
-
You want a report that can be shared as a single artifact
If the goal is analytics, long-term trends, or external dashboards, JSON or JUnit reporters are a better fit. If the goal is to clearly see what happened during a test run, the HTML reporter is the most effective option.
How to Create a Playwright Reporter
This section walks through the setup in a clear, step-by-step order, from prerequisites to viewing the report.
1. Prerequisites
Before using the HTML reporter, make sure the project is ready to run Playwright tests.
Ensure the following are available:
-
Node.js is installed
-
Playwright is installed in the project
Run these commands to set up Playwright:
npm init -y
npm install -D @playwright/test
npx playwright install
2. Project Structure
A simple project structure is sufficient:
project
├─ tests/
│  └─ navigation.spec.js
└─ playwright.config.js
By default, Playwright looks for test files inside the tests directory. Keeping tests and configuration separate makes the setup easier to maintain.
3. Sample Test for HTML Reporting
To get the most value from the HTML report, tests should be written in a way that clearly shows execution flow. This example focuses on retry behavior so the report can clearly show failed attempts and successful retries.
import { test, expect } from '@playwright/test';
test('navigation fails first, passes on retry', async ({ page }) => {
  const retry = test.info().retry;
  if (retry === 0) {
    // First run → 404 page (DOM exists)
    await page.goto('https://playwright.dev/this-page-does-not-exist', {
      waitUntil: 'load',
    });
    await expect(page.locator('text=Page not found')).toBeVisible();
  } else {
    // Retry → correct page
    await page.goto('https://playwright.dev', {
      waitUntil: 'networkidle',
    });
    await expect(page).toHaveTitle(/Playwright/);
  }
});
This test is written to demonstrate how retries behave in Playwright and how that behavior appears in the HTML report. It uses the retry count to change the test flow between attempts.
On the first attempt, the test navigates to an invalid page and checks for an error state. This forces a failure and represents a realistic case where navigation or routing breaks temporarily.
On the retry, the test navigates to the correct page and passes. In the HTML report, both attempts are shown under the same test, making it easy to see what failed, what retried, and how the test eventually passed.
4. Enabling the HTML Reporter
To enable the Playwright HTML reporter, it must be configured in playwright.config.ts. Below is an example configuration that matches a real-world setup and shows how the HTML reporter is enabled with additional options.
// @ts-check
import { defineConfig, devices } from '@playwright/test';
export default defineConfig({
  testDir: './tests',
  snapshotDir: './__screenshots__',
  fullyParallel: true,
  retries: 1,
  timeout: 60 * 1000,
  reporter: [
    ['html', {
      outputFolder: 'playwright-report',
      open: 'always'
    }],
  ],
  use: {
    headless: true,
    trace: 'on',
    screenshot: 'only-on-failure',
    video: 'retain-on-failure',
  },
  projects: [
    {
      name: 'chromium',
      use: { ...devices['Desktop Chrome'] },
    },
    {
      name: 'firefox',
      use: { ...devices['Desktop Firefox'] },
    },
    {
      name: 'webkit',
      use: { ...devices['Desktop Safari'] },
    },
    {
      name: 'android',
      use: { ...devices['Pixel 5'] },
    },
    {
      name: 'ios',
      use: { ...devices['iPhone 12'] },
    },
  ],
});
This configuration tells Playwright to generate an HTML report after every test run and store it in the playwright-report folder. The report opens automatically once the run completes, so results are available immediately without manual steps.
Retries are enabled, which means failed attempts remain visible in the report, and successful retries are grouped under the same test.
Traces, screenshots, and videos are attached to the exact test attempt that produced them, giving clear evidence for failures.
Running the same tests across multiple browsers and devices results in the report grouping outcomes by project, making it easy to see where issues occur and how consistently tests behave across environments.
Running the Tests
Run the test suite using:
npx playwright test
After execution:
-
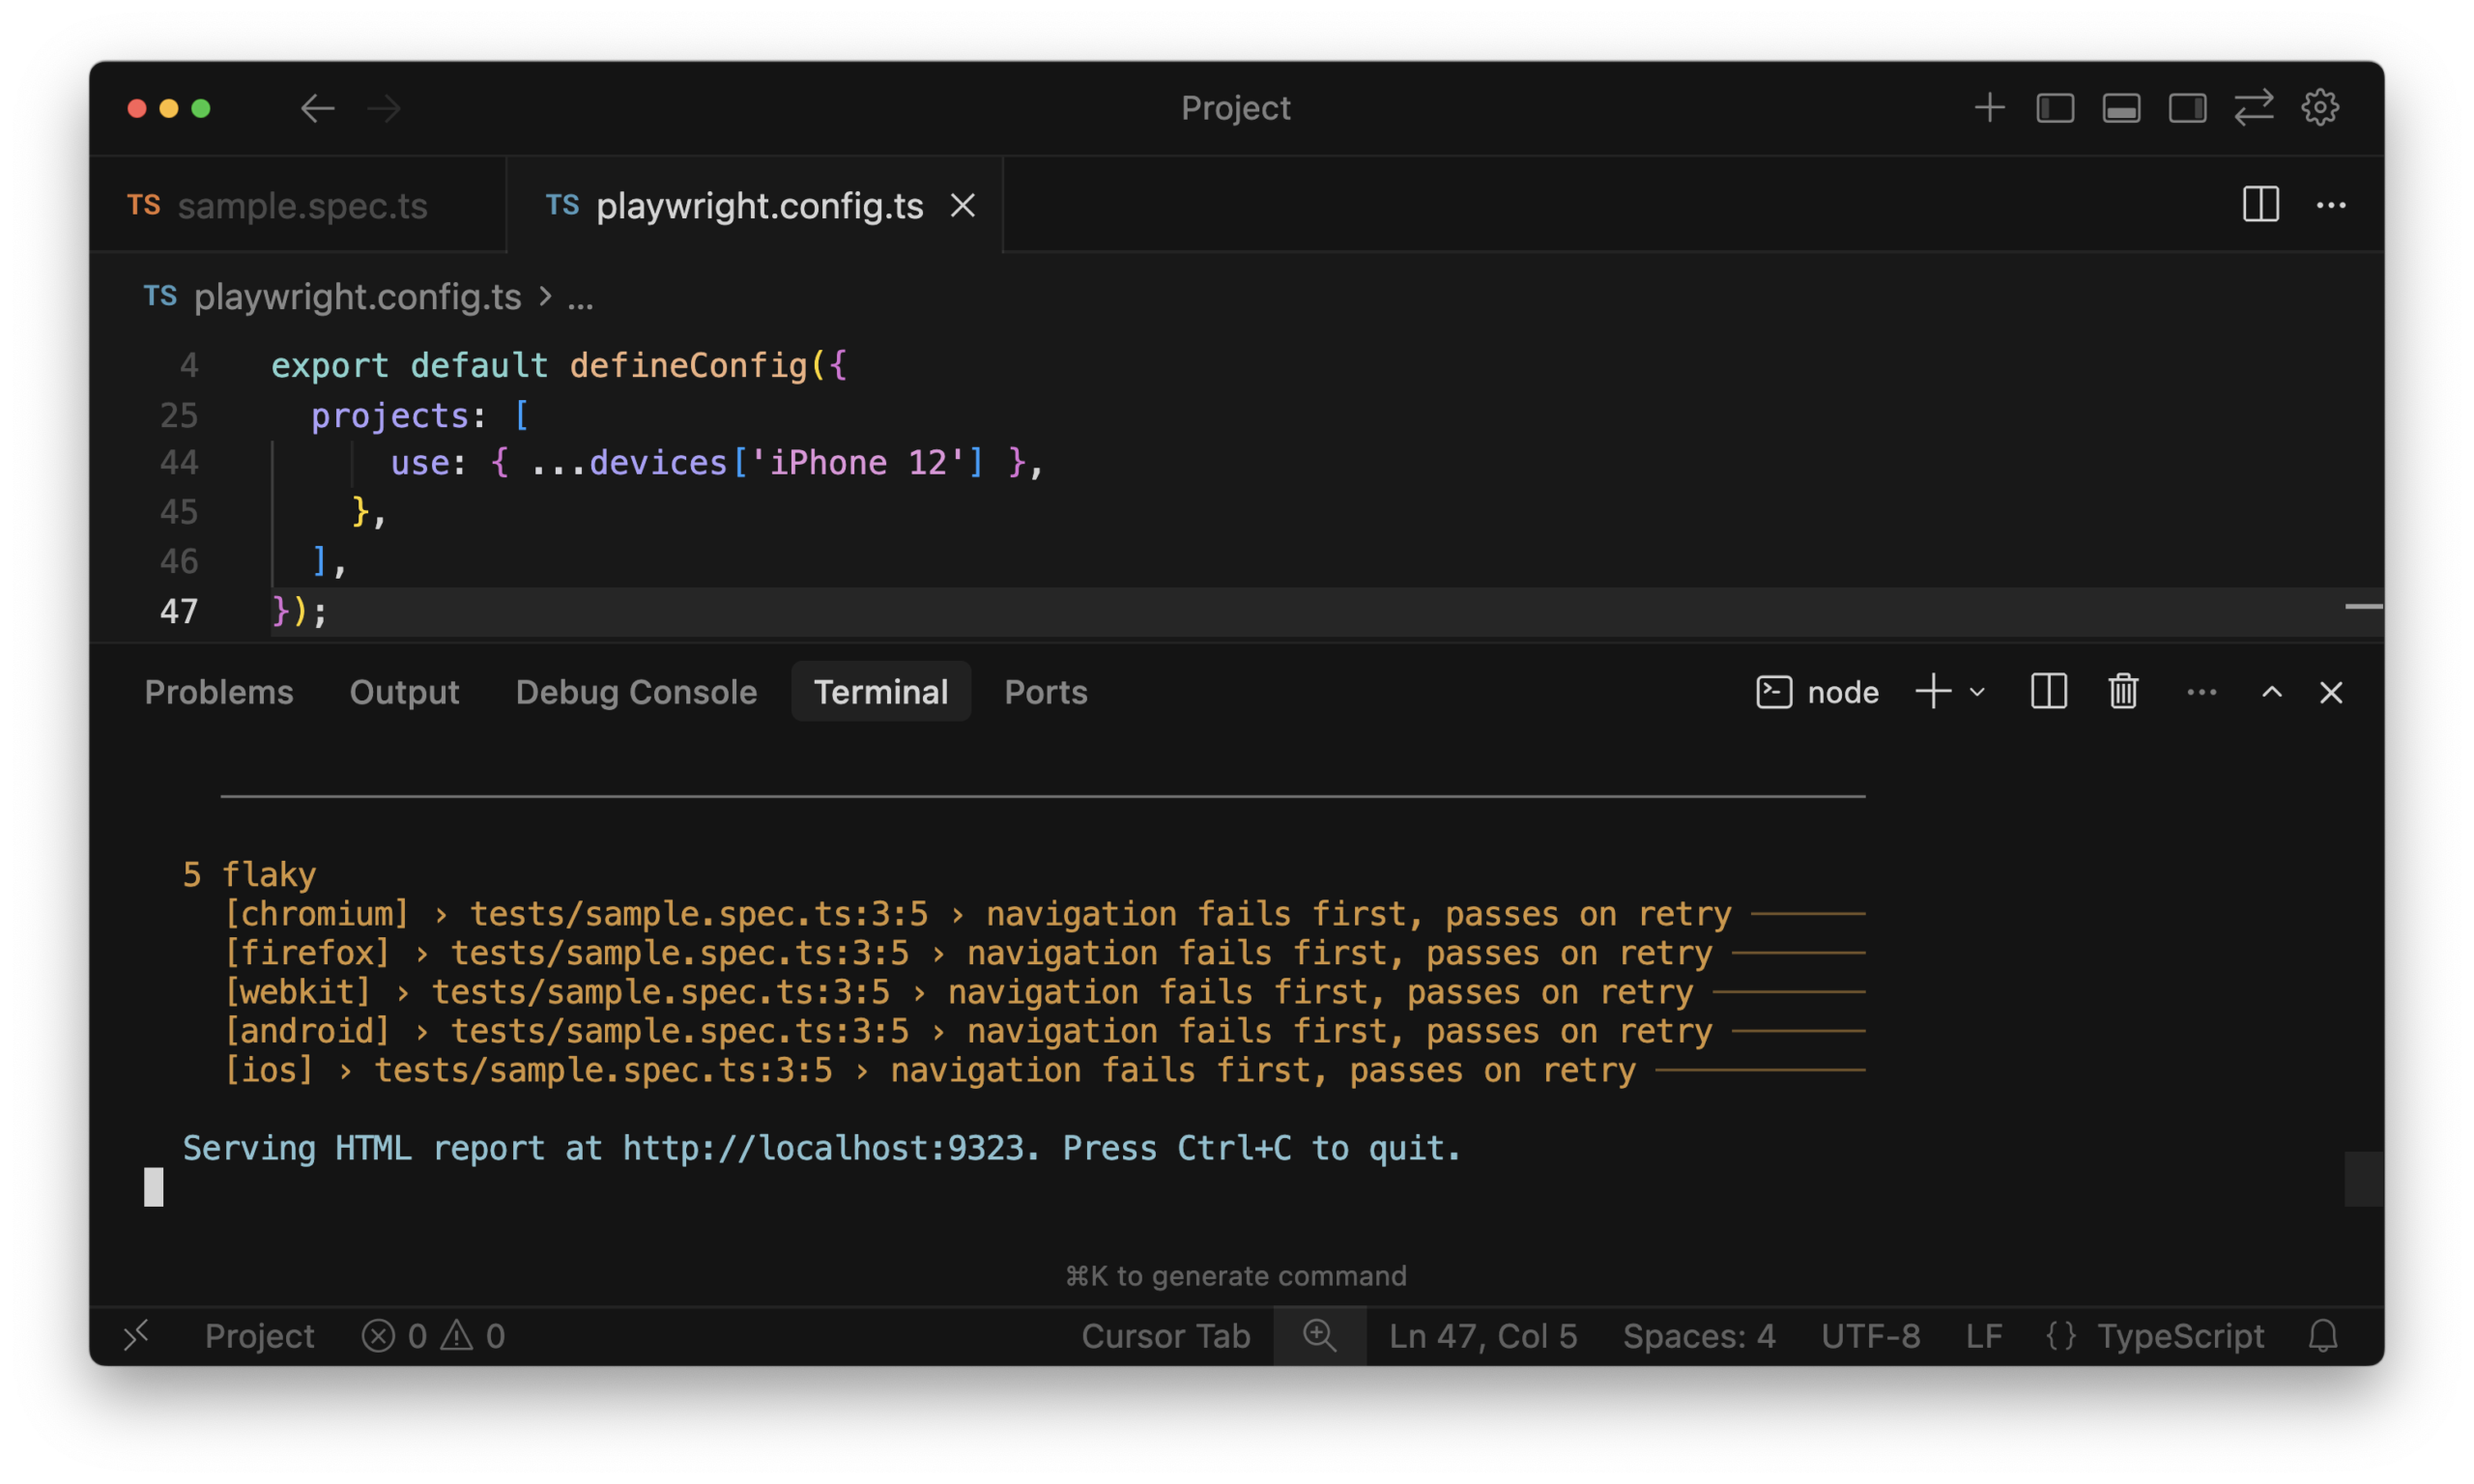
At the end of the run, Playwright prints a short summary to the terminal. The terminal shows test progress, including failures and retries.
-
HTML Report
-
The report is saved in the playwright-report/ directory.
-
You can open the report manually or allow Playwright to open it automatically.
-
At this point, the HTML report is ready for review, showing test status, steps, timing, retries, and related artifacts in one place.
-
Understanding the HTML Report
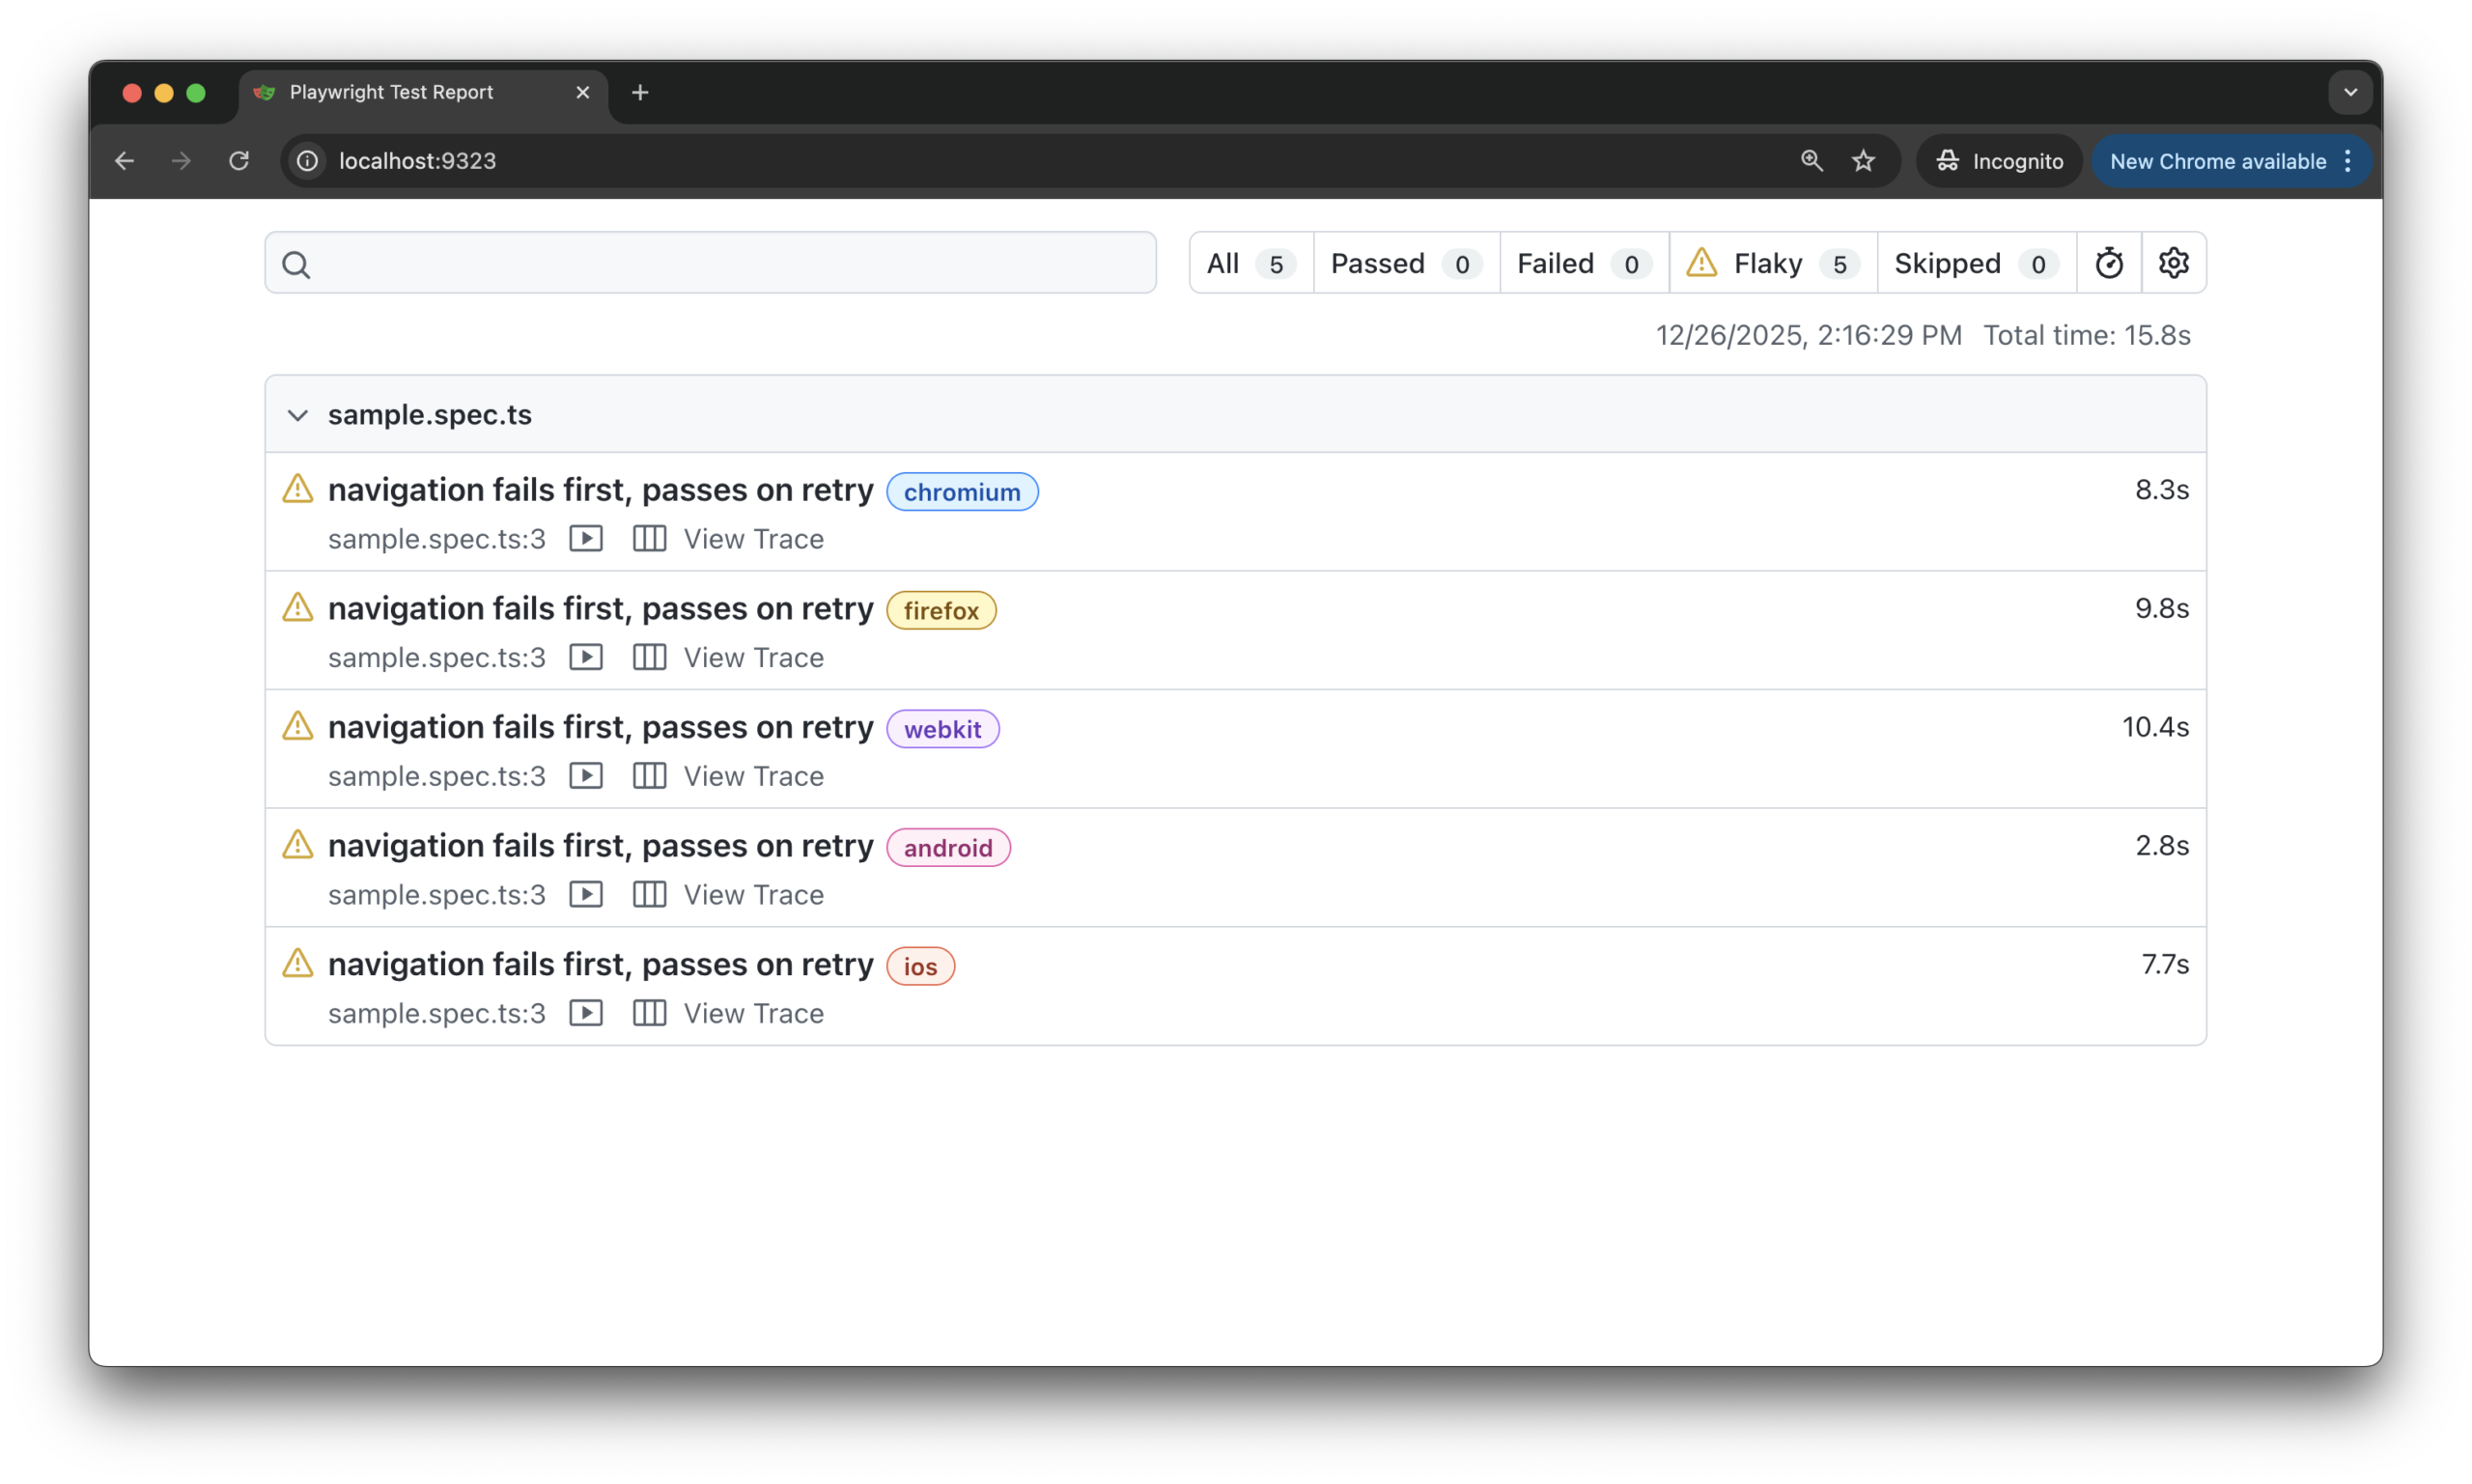
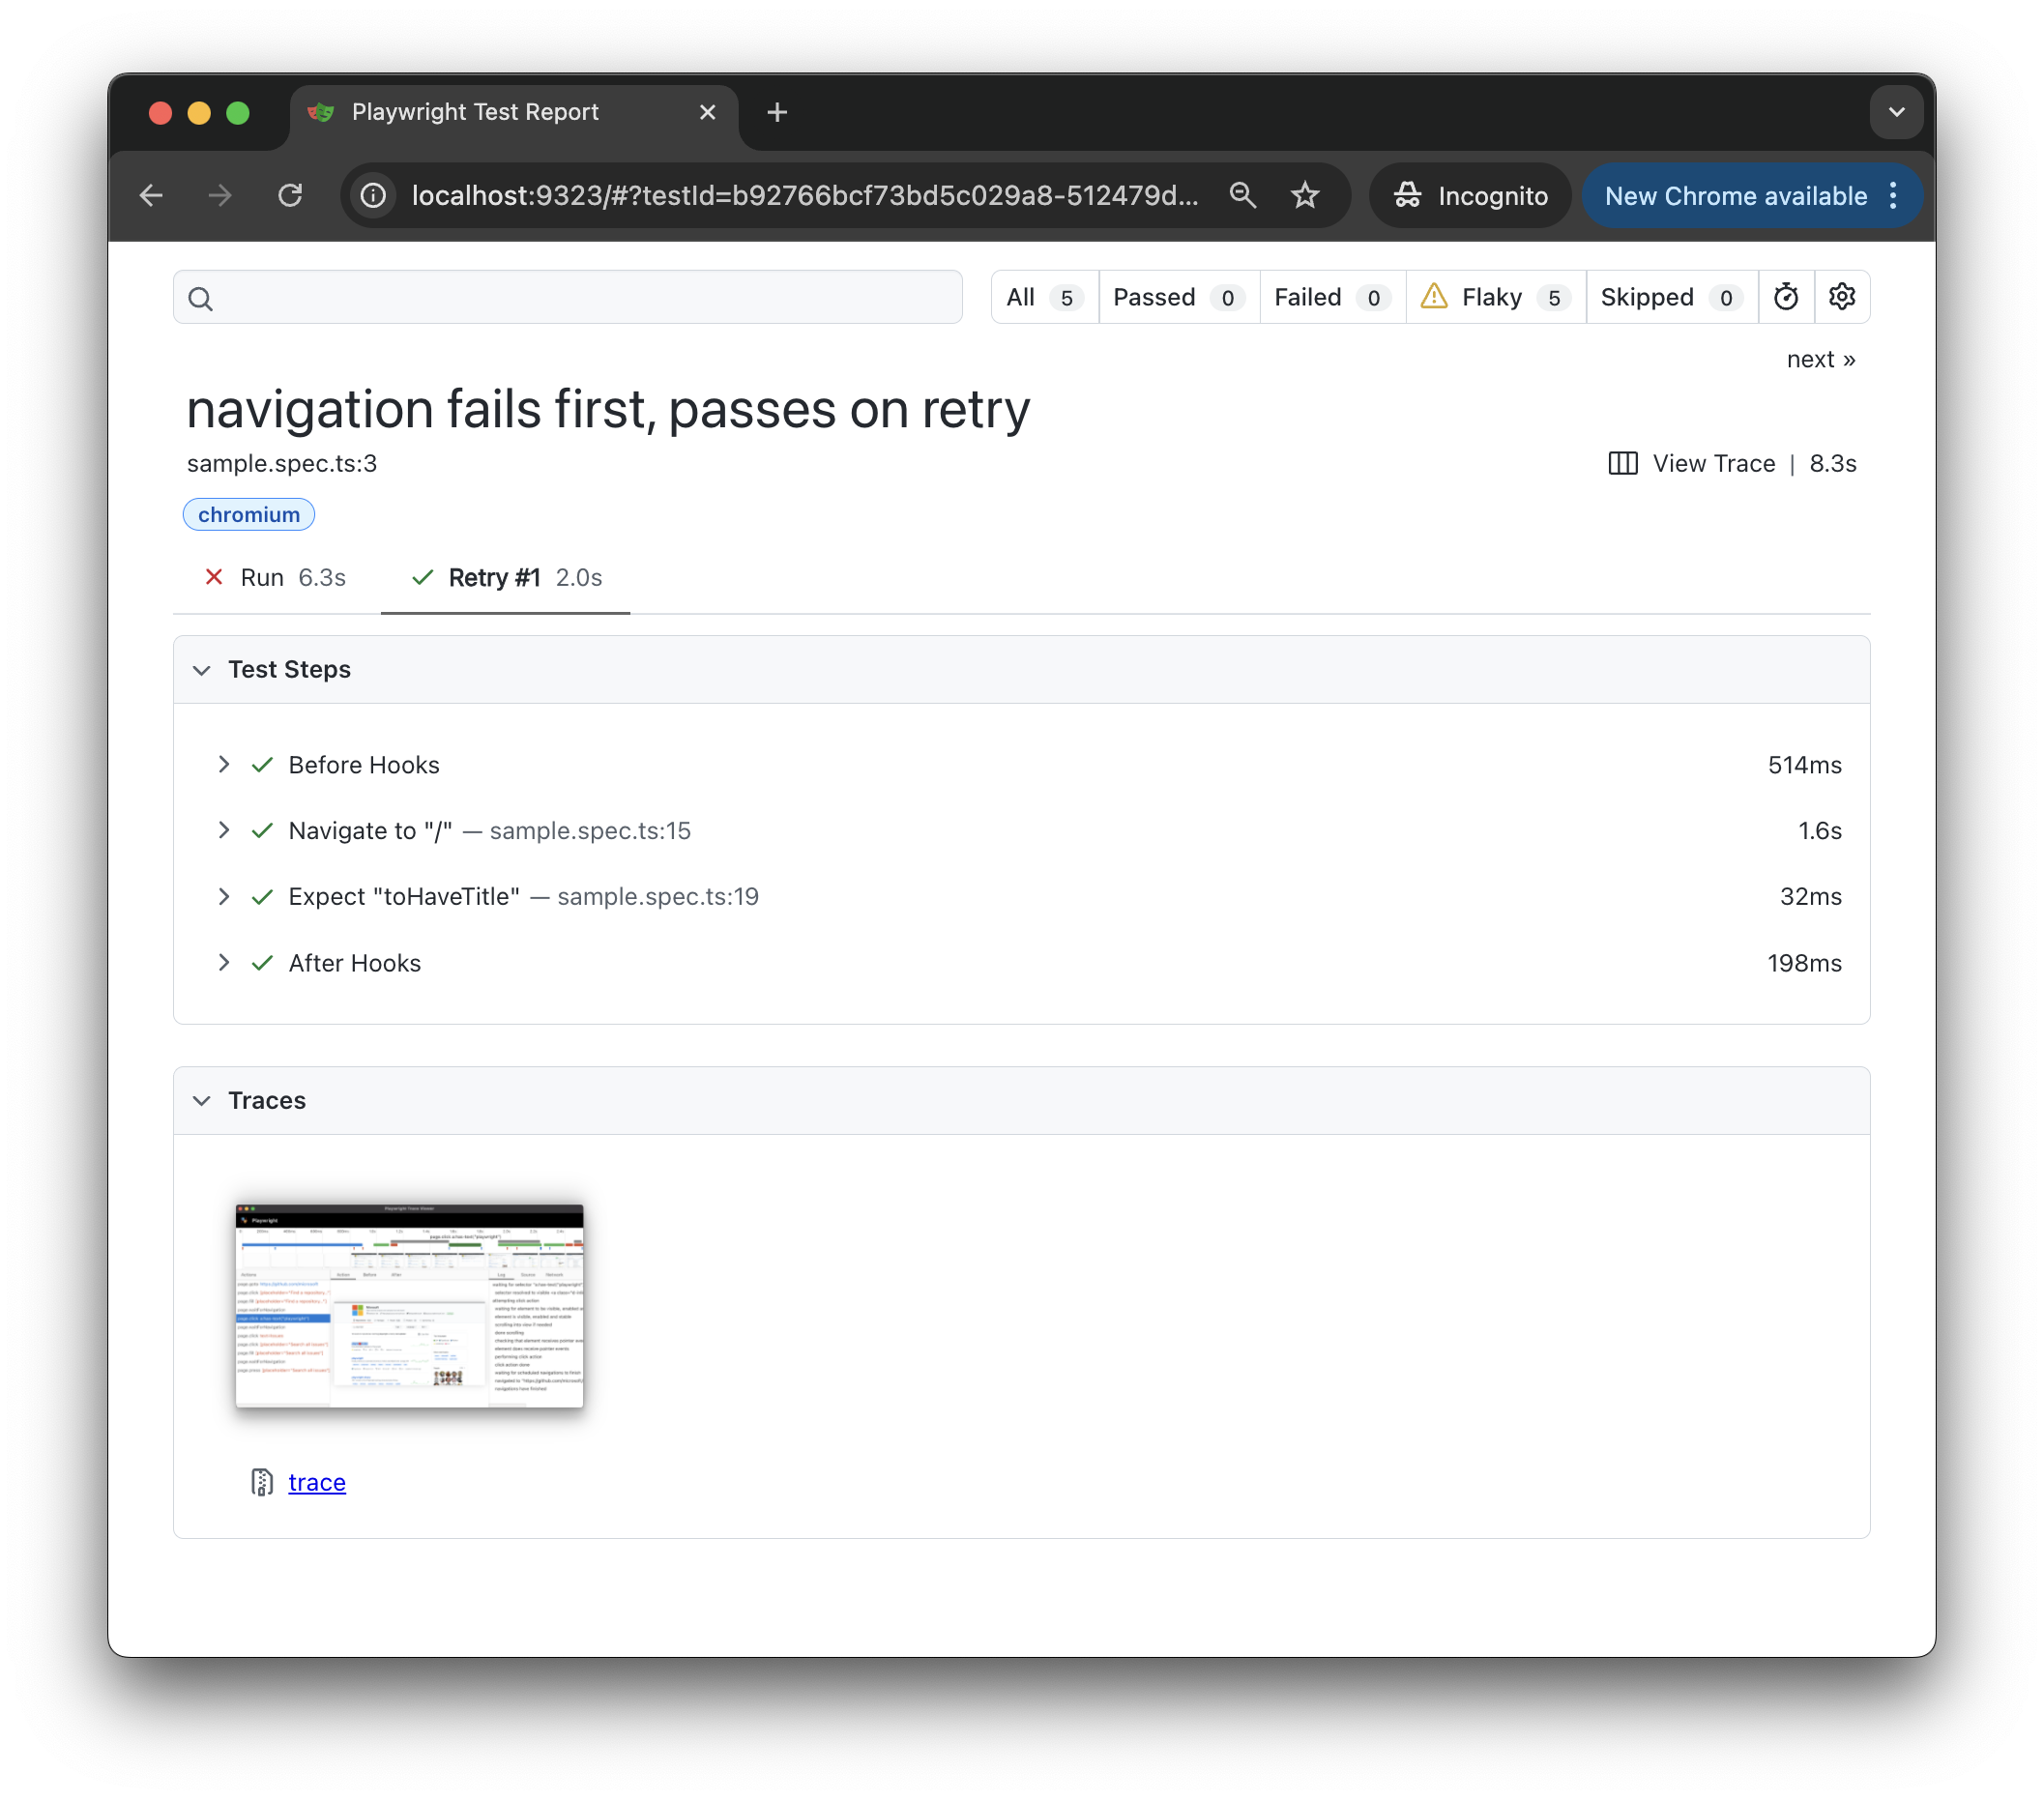
The HTML report is organized into clear, easy-to-scan sections. The left side shows the list of tests from the run, while the right side displays detailed information for the selected test.
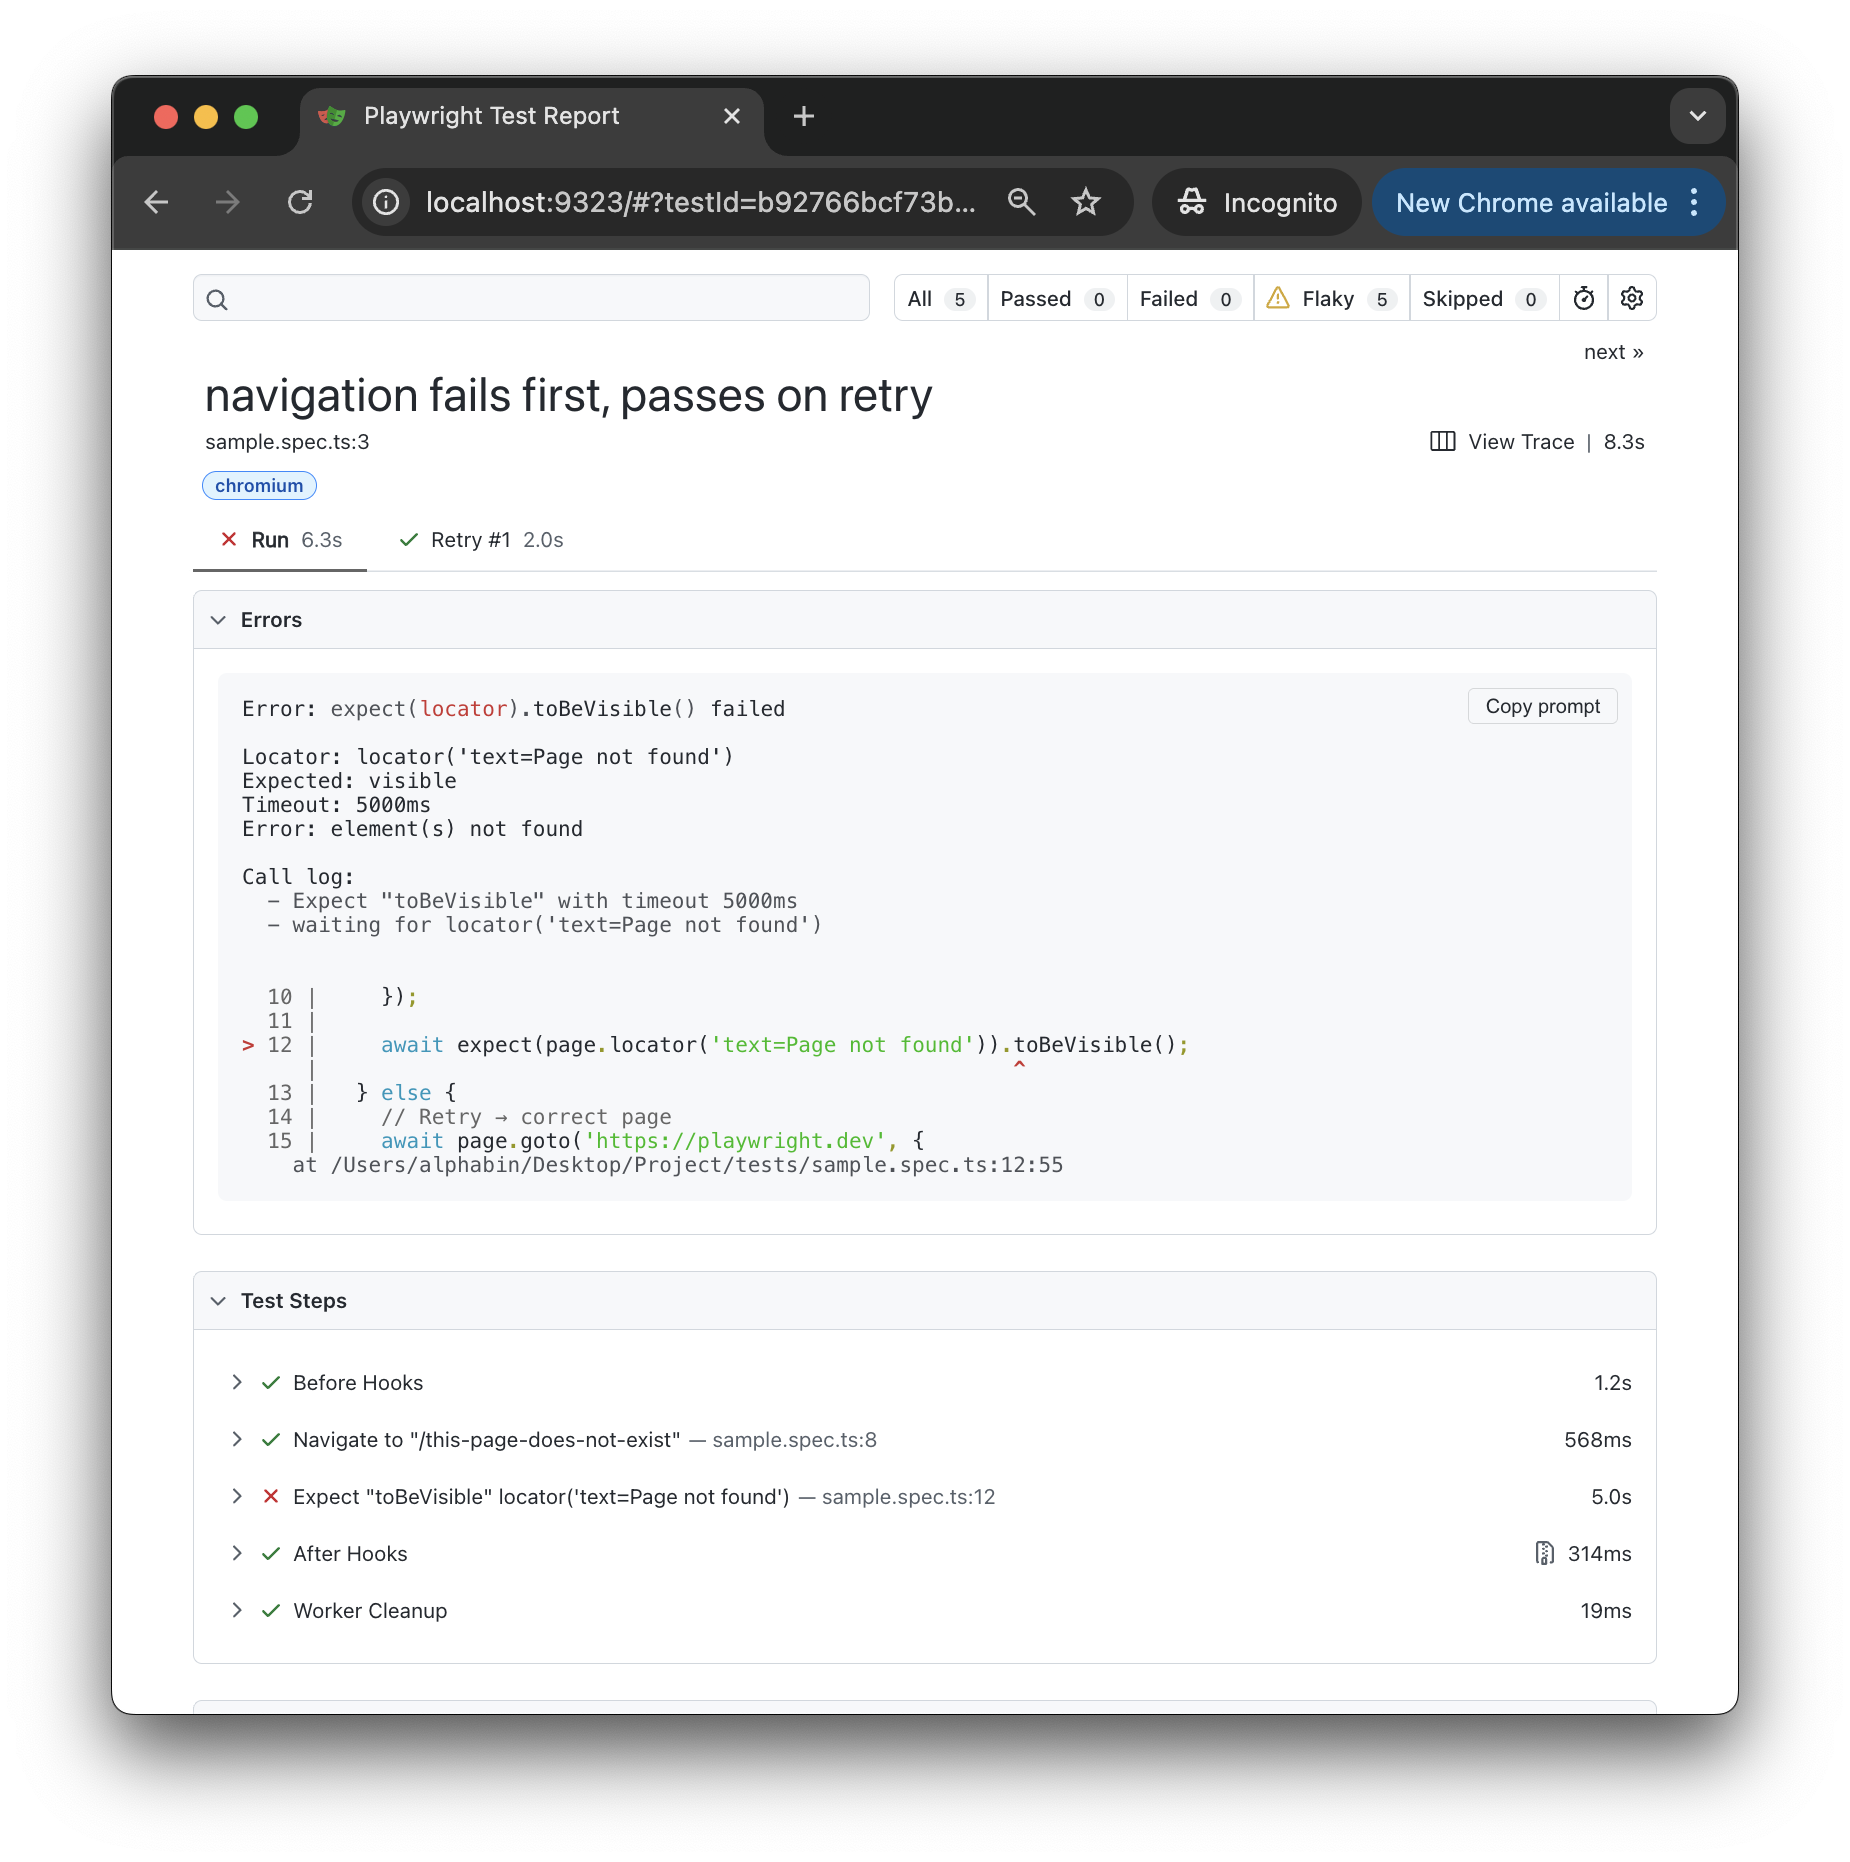
When you expand a test, you can see all related data in one place. This includes each attempt, the steps executed during the test, any attachments such as screenshots or traces, and error details when failures occur.
All elements in the report are interactive. You can click through attempts, expand steps, and open attachments, which makes it easy to follow the execution flow and understand exactly what happened during the test run.
Step Timeline and Timing
For each test attempt, the HTML report shows a clear step timeline. Every step is listed with its name, execution order, and the time taken to complete it.
This makes it easy to see which step was slow, whether delays came from setup or navigation, and where time was actually spent during the test run.
Retries and Test Attempts
When retries are enabled, the HTML report shows each test attempt separately under the same test. Failed attempts remain visible, and the final status is clearly marked.
This makes it easy to see which attempt passed, how many retries occurred, and whether the failure happened before or after navigation.
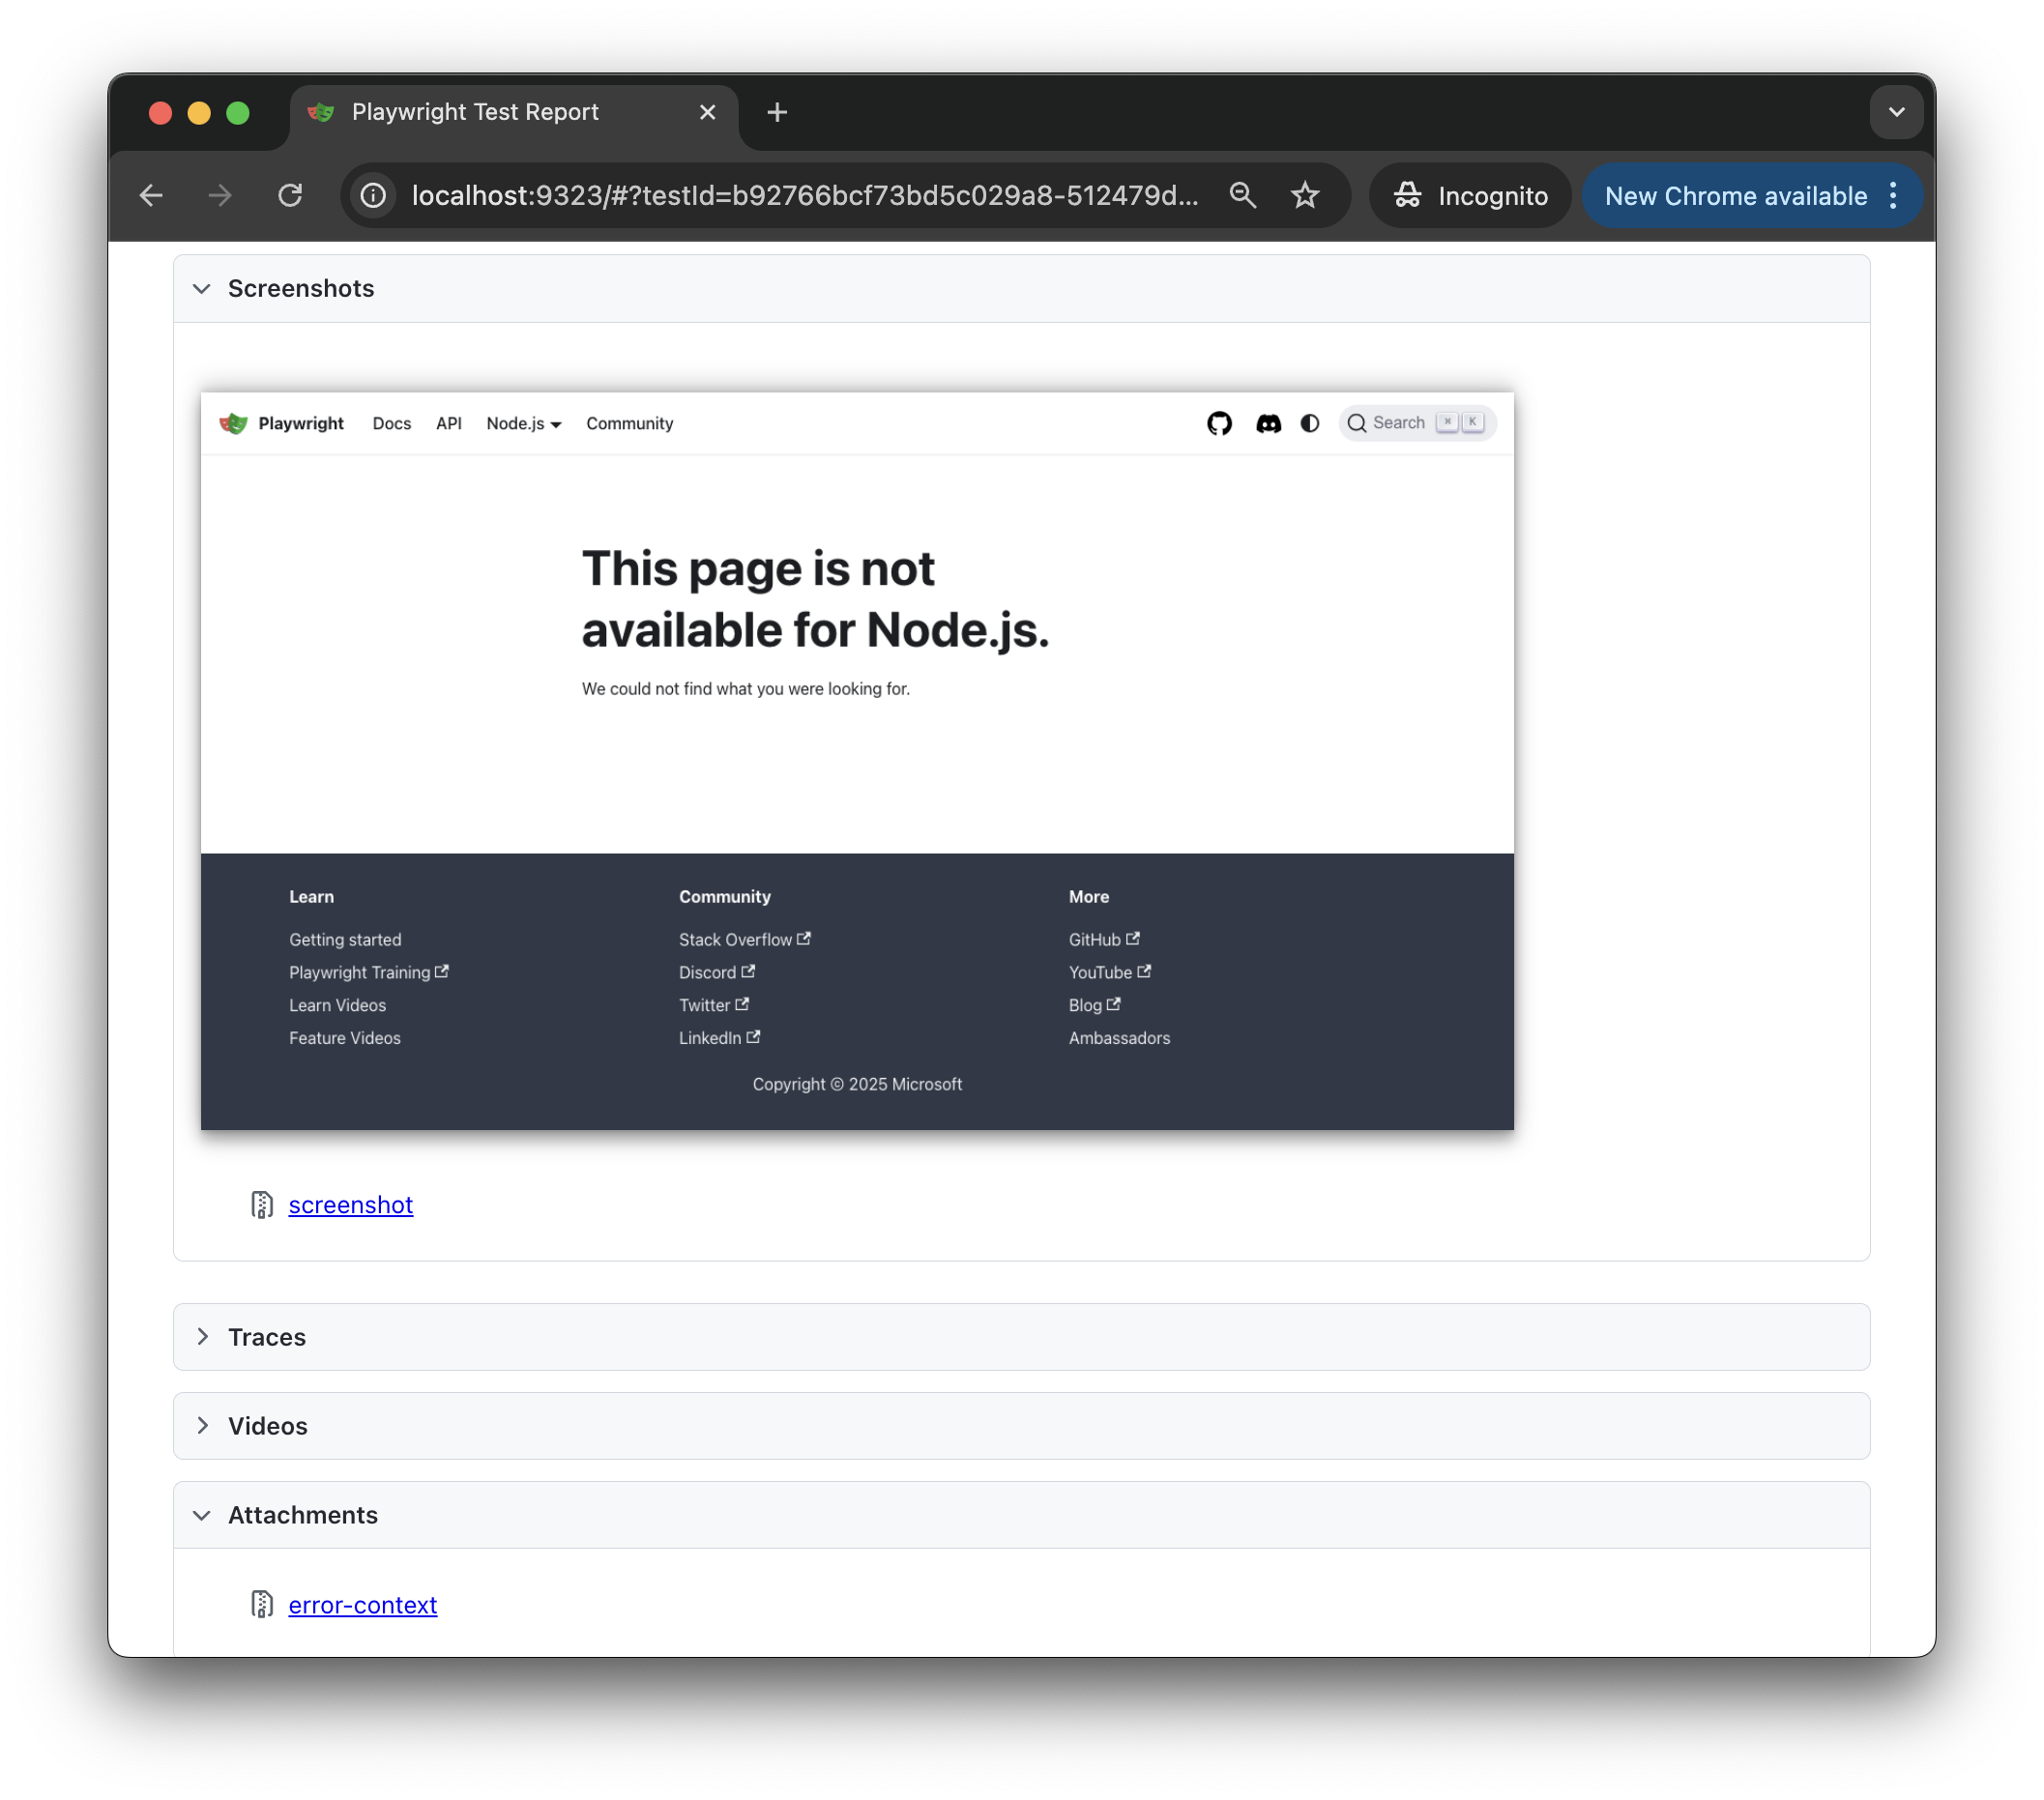
Screenshots, Traces, and Attachments
The HTML report automatically links all artifacts produced during the test run. This includes screenshots captured on failure, traces when tracing is enabled, and any attachments added during execution.
Traces allow you to replay the test visually, step by step, and inspect what happened at each point. This makes debugging faster and is one of the strongest features of the HTML reporter.
Using the HTML Reporter in CI
In CI, the HTML report is generated the same way as it is locally. After the run finishes, the playwright-report folder can be stored as a build artifact.
Once downloaded, the report can be opened locally in a browser. This allows anyone to inspect failures, retries, and artifacts without rerunning the tests.
Common Errors and Fixes
HTML report not generated: Ensure the reporter is set to html in the Playwright configuration.
Steps missing in the report: Only actions wrapped in test.step() appears as steps. Plain actions are not shown as timeline entries.
No screenshots or traces: Screenshots and traces appear only if they are enabled. Check that these options are turned on.
CI logs are hard to read: Terminal logs are limited in CI. Download and open the HTML report artifact instead.
Invalid command used: Always run tests with npx playwright test. Do not run test files directly
Best Practices
-
Use test.step() for all meaningful actions.
-
Keep step names short and easy to understand.
-
Enable traces when debugging unstable or retry-heavy tests.
-
Store HTML reports from CI runs as artifacts.
-
Review step timing before trying to optimize test performance.
Conclusion
The Playwright HTML reporter gives a clear view of how tests actually run. Instead of scanning logs, you can see what ran, in what order, how long each step took, where it failed, and whether retries were involved.
With clear step annotations and consistent usage, the HTML reporter becomes the main tool for debugging and test review. It helps teams trust individual test runs and make faster decisions during development and CI.
For teams that need insight beyond a single run, TestDino builds on Playwright reports by combining HTML and JSON data across runs. It turns raw results into trends, highlights unstable tests using AI, and helps teams understand reliability over time, not just one execution.
FAQs
Table of content
Flaky tests killing your velocity?
TestDino auto-detects flakiness, categorizes root causes, tracks patterns over time.
Follow Us