Playwright reporting runbook for CI: fast triage guide
Accelerate CI feedback with the Playwright reporting runbook. Optimize your pipeline efficiency and keep every build release-ready. Your quick guide to fast triage, clear insights, and rapid test failure resolution.
Nothing is more frustrating than a red CI run with no clear reason. You didn’t change the test, yet you’re stuck in logs and repeatedly downloading Playwright reports, trying to tell if the failure is real or flaky. Teams lose hours each week chasing false positives.
The issue isn’t the tests it’s reporting that lacks clarity. CI requires context, history, and insights across runs and branches, not just a single HTML or downloaded report.TestDino turns raw Playwright runs into actionable insights. Every run becomes a rich record in a single explorer, letting you triage quickly and focus on shipping instead of sifting through noise.
Why Playwright reporting fails in CI
When a test fails, time is your most scarce resource. But instead of solving real issues, teams often waste time on:
- Rerunning tests without understanding why they failed
- Chasing false positives
- Hunting through logs and screenshots manually
The root cause? Poor reporting especially in CI environments.
What the Playwright HTML report misses in CI
Most teams start with the built-in Playwright HTML report. It is handy for local debugging, but it focuses on a single run. It does not give trends across branches, runs, or environments, and it is not built to manage cross-run flakiness or CI-scale analytics.
You also need quick links into your code host and issue tracker. HTML output alone does not post to pull requests (PR commenting) or create tickets with screenshots and logs attached.
The HTML report does not clearly display skipped tests, passed tests, or provide detailed test case information needed for CI analysis.
What You Actually Need for CI at Scale
To truly cut triage time in CI, you need a reporting system that provides:
- A historical view of test results
- Direct links to code changes and PRs
- Flake rate tracking and error trends over time
- One-click access to logs, traces, and screenshots
How to fix Playwright test failures faster
Triage is a process of elimination. Is it a bug? A flaky test? A bad merge?
A real Playwright reporting runbook should help you answer those instantly and that's where TestDino comes in.
It helps you find root cause faster with debug hints, test context, and clear trace viewer links. by giving you the right signals from the start. Let's look at a common scenario.
How do I fix failure faster?
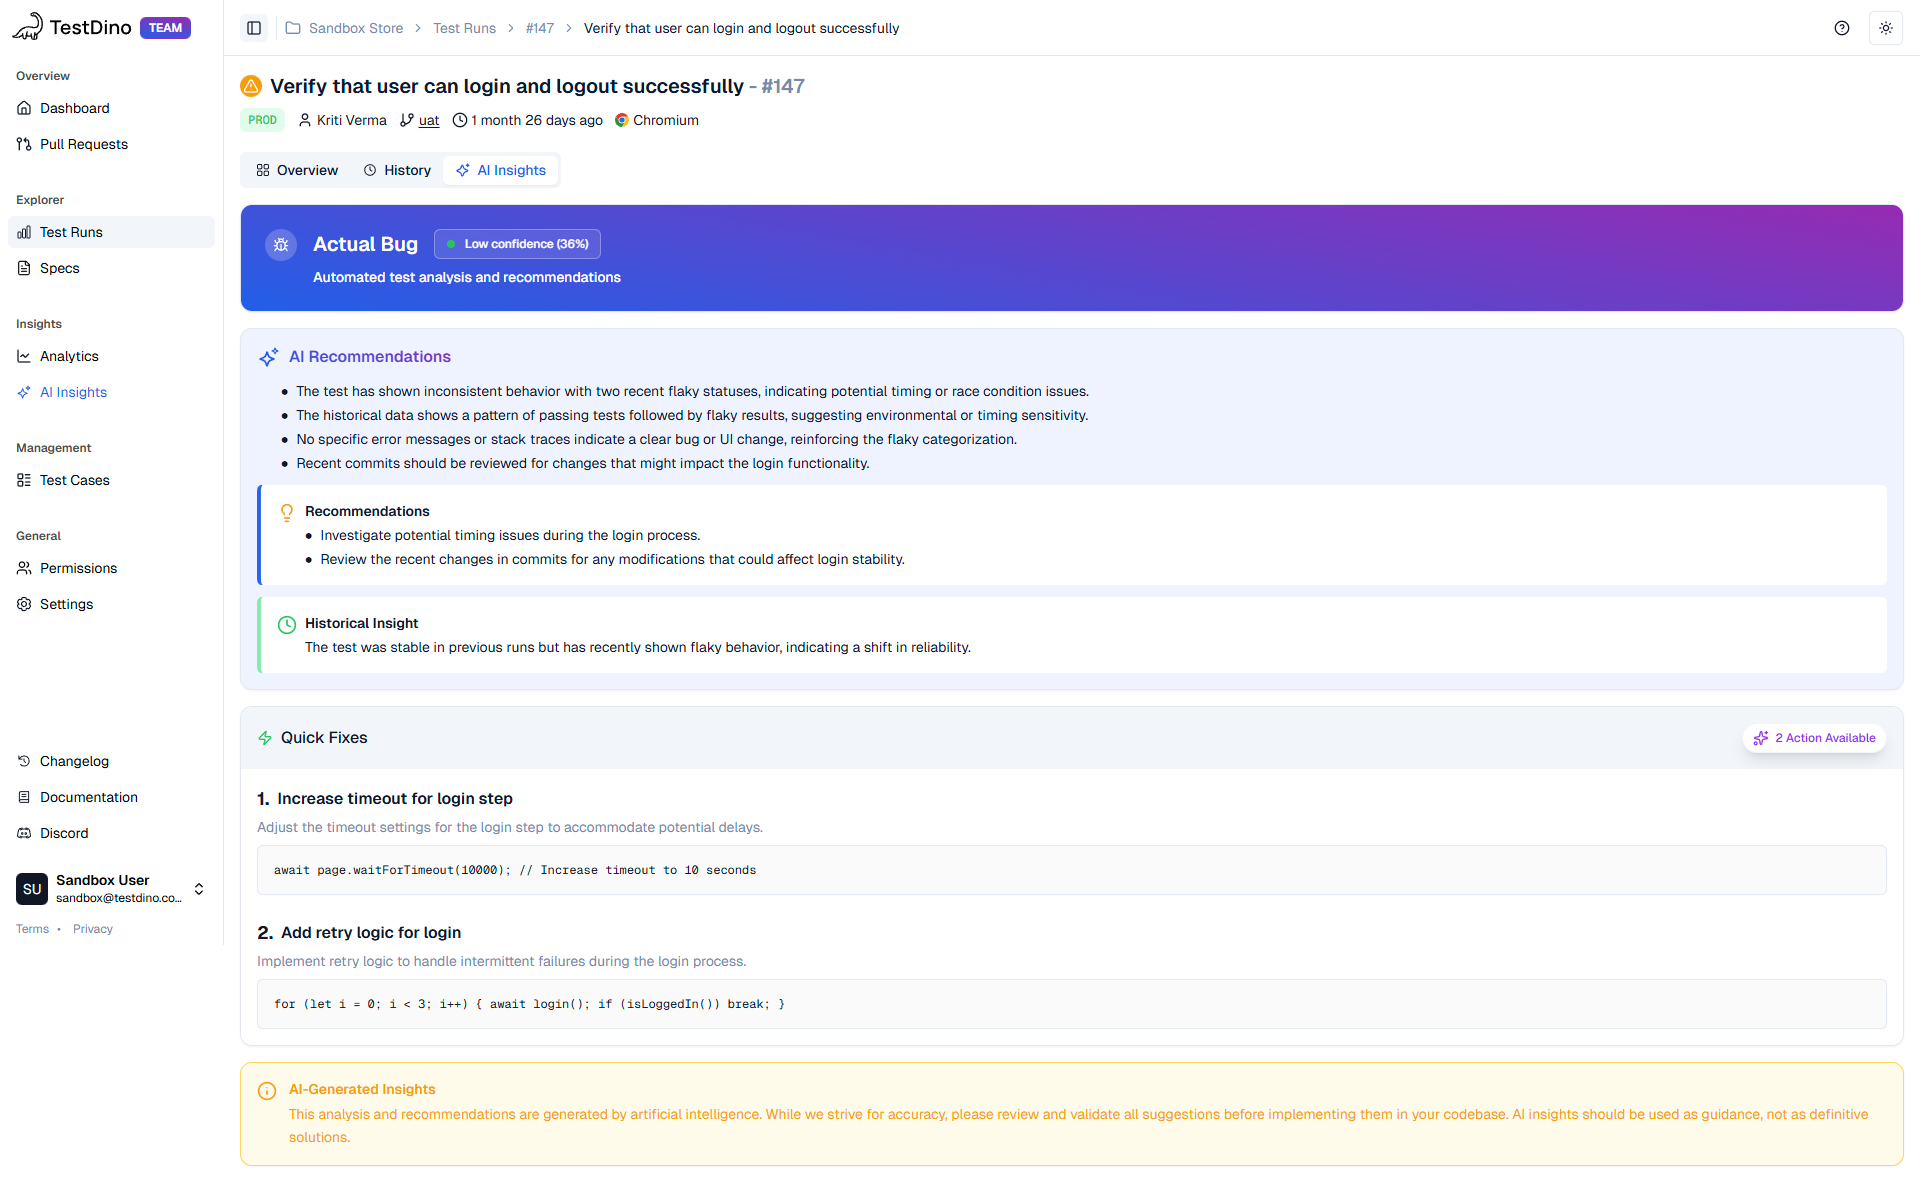
We had a Playwright login test that failed intermittently on CI, showing classic signs of flakiness due to inconsistent timing.
TestDino provided clear AI-powered insights pointing to potential timing and race condition issues in the login step, including timeout error and network error patterns found in traces and emphasizing the need for stability improvements.
For tests that simulates UI like clicking on a button or filling out forms, that have detailed logs and traces is essential for diagnosing issues, as they provide deeper visibility into what is happening during each step of execution.
Test Code
import { test, expect } from '@playwright/test';
test('login shows dashboard', async ({ page }) => {
  await page.goto(process.env.BASE_URL || 'https://app.example.com');
  await page.getByLabel('Email').fill(process.env.USER_EMAIL!);
  await page.getByLabel('Password').fill(process.env.USER_PASS!);
  await page.getByRole('button', { name: 'Sign in' }).click();
  await expect(page.getByRole('heading', { name: 'Dashboard' })).toBeVisible()
});
Issues Identified by TestDino AI
- TestDino's AI flagged that the test was flaky recently after a long period of stability, with a low confidence score and a pattern of unrelated failures.
- The AI recommended:
1) Investigating timing issues in the login setup
2) Increasing timeout issues in the login setup - TestDino also suggested reviewing recent code commits for potential causes and provided actionable "Quick Fixes" like increasing timeouts and adding retry logic directly in the Playwright steps plus step timings in the trace to confirm the bottleneck
Fix
await page.waitForTimeout(10000);  // Increase timeout for login
for (let i = 0; i < 3; i++) { await login();  if (isLoggedIn())  break; }  //added retry logic for login
Building a Proactive Reporting Workflow
This section transitions from debugging a single test to building a robust, repeatable system. It’s about how you try to prevent noise from occurring and focus on real issues.
A well-defined reporting and testing processes are essential for proactive test management, ensuring that issues are identified at an early stage and that test results are actionable.
Setting Up Playwright for Proactive Reporting
Your playwright.config.ts file is key to generating the right evidence for triage.
import { defineConfig, devices } from '@playwright/test';
export default defineConfig({
  testDir: './tests',
  fullyParallel: true,
  forbidOnly: !!process.env.CI,
  retries: process.env.CI ? 2 : 0,
  workers: process.env.CI ? 2 : undefined,
  use: {
    trace: 'retain-on-failure',
    screenshot: 'on',
    video: 'on-first-retry',
    actionTimeout: 5000,
  },
  projects: [
    { name: 'chromium', use: { ...devices['Desktop Chrome'] } },
    { name: 'firefox', use: { ...devices['Desktop Firefox'] } },
    { name: 'webkit', use: { ...devices['Desktop Safari'] } },
  ],
});- retries: process.env.CI ? 2 : 0: This is a critical setting for flake detection. It tells Playwright to retry a failed test up to two times on CI, but not locally. A test that passes on a retry is a flake.
- trace: 'retain-on-failure': This ensures Playwright saves the trace file only when a test fails, saving storage space. The trace is the single most valuable artifact for debugging a failed test.
Automating Triage with CI Integration and Playwright reporting runbook steps
What other reporting tools usually ask you to set up
1) Allure Report
Install Allure, keep Java on the machine, add the Allure reporter, write results to allure-results, then run Allure to build HTML.
Allure reporting and allure reports provide interactive dashboards and visualizations for comprehensive test result analysis and team collaboration.
After running your tests, use the command line to generate allure reports and view the results in your browser.
2) Allure TestOps
Create a project, create an API token, connect the integration in project settings, and run an uploader or agent to push results.
3) Currents
Create org and project to get projectId and recordKey, install @currents/playwright, add currents.config.ts, enable trace/video, then run with npx pwc or add their reporter.
4) BrowserStack Test Reporting & Analytics
Install their SDK or use their quick-start, set credentials, and run Playwright so results stream to their reporting. Often you also set a config file or env vars.
5) Plain Playwright HTML or JUnit only
Add –reporter=html or –reporter=junit and keep artifacts yourself. JUnit reporters are a standard option for structured, XML-based test results, but lack the advanced features and analytics provided by third party reporters.
Good for one run, weak for cross-run trends.
What TestDino needs
Based on your setup screens:
- API key – auto-generated in the project.
- Reporters in Playwright – keep HTML and JSON output in ./playwright-report so there is a report.json. This ensures you have a complete playwright test report and output test results for upload.
- Upload step – run a single CLI after tests:
npx tdpw upload ./playwright-report --token="" --upload-html
upload the report file for further analysis.
Optional – keep artifacts in Actions so anyone can download traces or HTML later.
Why this helps
One upload step, no custom agent. PRs get context including linking Playwright failures to PRs and issues.. History across branches and envs with branch health and error trends over time. AI hints surfacing root cause hints and test insights quickly. Artifacts stay in Actions keeping screenshots and logs and traces for audit. Generated reports and test automation reports provide a comprehensive view for debugging and compliance.
name: e2e
on: [push, pull_request]
jobs:
run:
runs-on: ubuntu-latest
steps:
- uses: actions/checkout@v4
- uses: actions/setup-node@v4
with:
node-version: 20
- run: npm ci
- run: npx playwright install --with-deps
- run: npx playwright test
# Upload to TestDino
- name: Upload TestDino report
run: npx tdpw upload ./playwright-report --token="${{ secrets.TESTDINO_TOKEN }}"
# Keep raw artifacts too
- uses: actions/upload-artifact@v4
with:
name: playwright-artifacts
path: |
playwright-report/**
Optimizes CI minutes by avoiding wasteful reruns.
Heading: Simplify Your Test Result Management
Sub Heading: Centralized JSON and HTML reports. Keep artifacts without CI bloat.
Button: How TestDino Helps
PR-Aware Reporting: Link Playwright Failures to PRs
A modern runbook connects test failures to the code change that caused them. TestDino’s Pull Requests view lists each PR with its latest test run and a compact summary. This brings:
- A check on the PR with pass rate, failed count, and a link to the run
- Branch-specific failure tracking with commit correlation
- One click to open the failing spec with trace, logs, and screenshots
- Optional auto-creation of Jira or Linear tickets with evidence prefilled
Best Reports for Playwright CI: Beyond HTML Output
Playwright has a range of built-in reporters, but at scale, a team needs an analytics dashboard to turn data into signals.
Playwright’s reporters cover html, json, junit, and more, and you can extend them with a custom Reporter API when needed.
Modern Reporting Stack Comparison
| Tool | Best for | Analytics depth | Team roles |
|---|---|---|---|
| Playwright HTML Report | Local debugging, one-off runs | Minimal, single run only | Individual developers |
| TestDino | CI/CD pipelines, full team visibility | High, cross-run trends, AI insights | QA, developers, managers |
| Allure Report | Rich run visualization | Moderate, run-centric | QA, managers |
| Currents.dev | Playwright teams at scale | Cross-run trends, orchestration | QA, managers |
| BrowserStack Reporting | BrowserStack cloud runs | Build insights, trace viewers | QA, managers |
| LambdaTest Analytics | LambdaTest cloud runs | Dashboards, error insights | QA, managers |
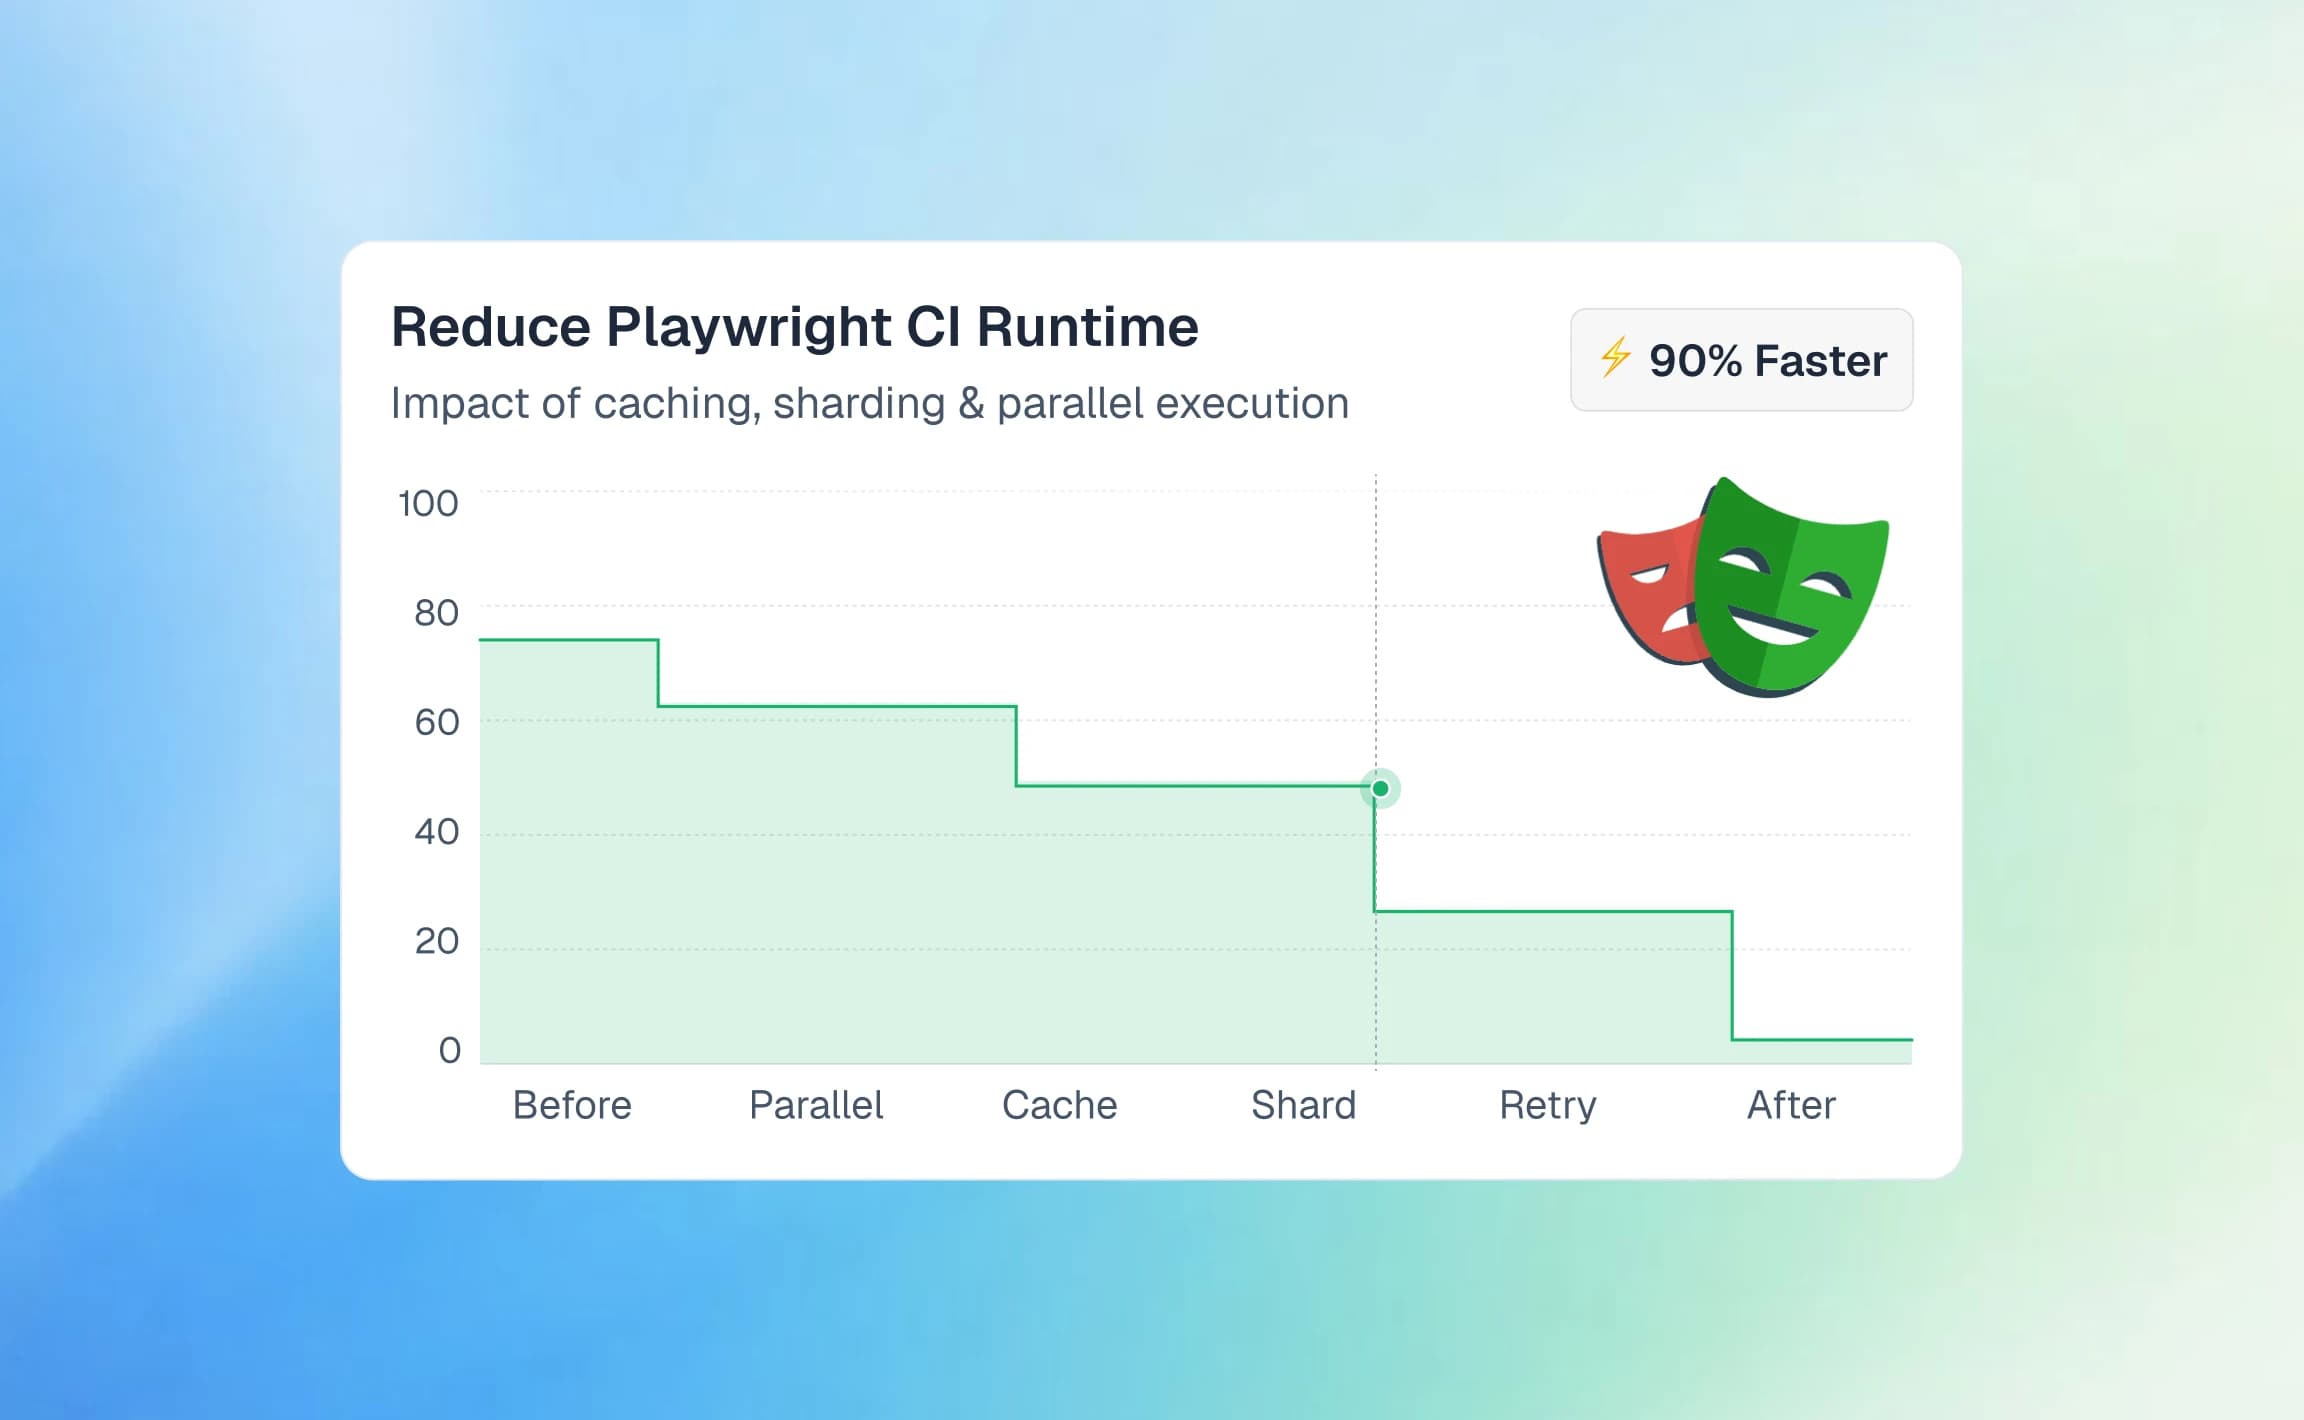
CI Minutes Optimization Strategy
TestDino helps optimize your CI pipelines and CI minutes usage by providing insights into parallel execution and sharding effectiveness.
The platform’s retry analysis helps you find and eliminate wasteful re-runs caused by flaky tests. By providing a clear view of which tests are slow, it helps teams identify and resolve performance bottlenecks guided by retry analysis and run summary data.
Conclusion
Reactive debugging turns into proactive test management when you have the right tools. Playwright reporting at scale requires more than a simple HTML report; it needs context, history, and real failure analysis instead of guesswork.
By setting up Playwright correctly and pairing it with an analytics platform, your test data becomes actionable. Instead of just seeing which tests failed, you understand why they failed and whether they’re worth fixing.
TestDino brings AI insights, deep analytics, and seamless CI integrations to help teams eliminate flakes and focus on real issues. It gives developers, QA, and managers a single source of truth with immediate productivity gains. If you need the best reporting for Playwright CI, start here.
FAQs

Vishwas Tiwari
Software Engineer