Playwright slow tests: tracking trends, timeouts, and stability
Struggling with slow Playwright tests? Learn how to cut test execution time by 60%, speed up CI, and keep your test suite reliable.
Playwright is built to be fast, but as test suites grow, many teams start running into slow tests in Playwright. The problem is usually not the framework, but how tests are structured and executed.
This blog brings together real data, practical code examples, and steps you can apply right away. Most slow suites come down to a small set of issues, and fixes like session reuse and proper parallel execution deliver the biggest gains.
With the right focus, teams can keep E2E runs under 2–3 minutes, track performance with clear metrics, and cut total execution time by 50–70%.
Why Playwright Slow Tests Matter in 2026?
By 2026, slow tests will become a bigger problem if teams ignore them. As UI suites grow, small issues like extra waits or loose selectors start adding up. What seems harmless today slowly drags down productivity and delivery speed.
If teams do nothing, CI pipelines take longer, developers wait longer for feedback, releases slow down, and CI costs rise.
Test maintenance time also increases as suites become harder to manage. Fixing test design, usage, and process early can keep Playwright fast as suites scale.
The data behind this report comes from 7.3 million test executions across 55,800 organizations. Many teams report suites that should finish in under ten minutes, but instead run for twenty to sixty minutes.
This is not a Playwright bug. It is a design, usage, and process problem. Fix the process, and Playwright performance improves quickly.
How big is the problem, in plain numbers
1. Adoption and scale
Playwright adoption jumped sharply between 2024 and 2025. Many teams migrated from Selenium and saw an immediate speed improvement. As test suites grew, small inefficiencies began to multiply, and overall performance declined.
The scale is clear: Playwright adoption grew by 235% from 2024 to 2025, the framework now sees 3.2 million weekly npm downloads, and it is used in 400k+ GitHub repositories.
2. What counts as slow
When tests are tuned, here are reasonable targets:
| Test type | Typical duration (optimized) |
|---|---|
| Unit/component | 0.5–2 s |
| API integration | 2–5 s |
| Single UI interaction | 3–8 s |
| Multi-step E2E | 8–15 s |
| Full user flows | 15–30+ s |
If your multi-step E2E tests are often 30–60 s, you likely have a slow suite.
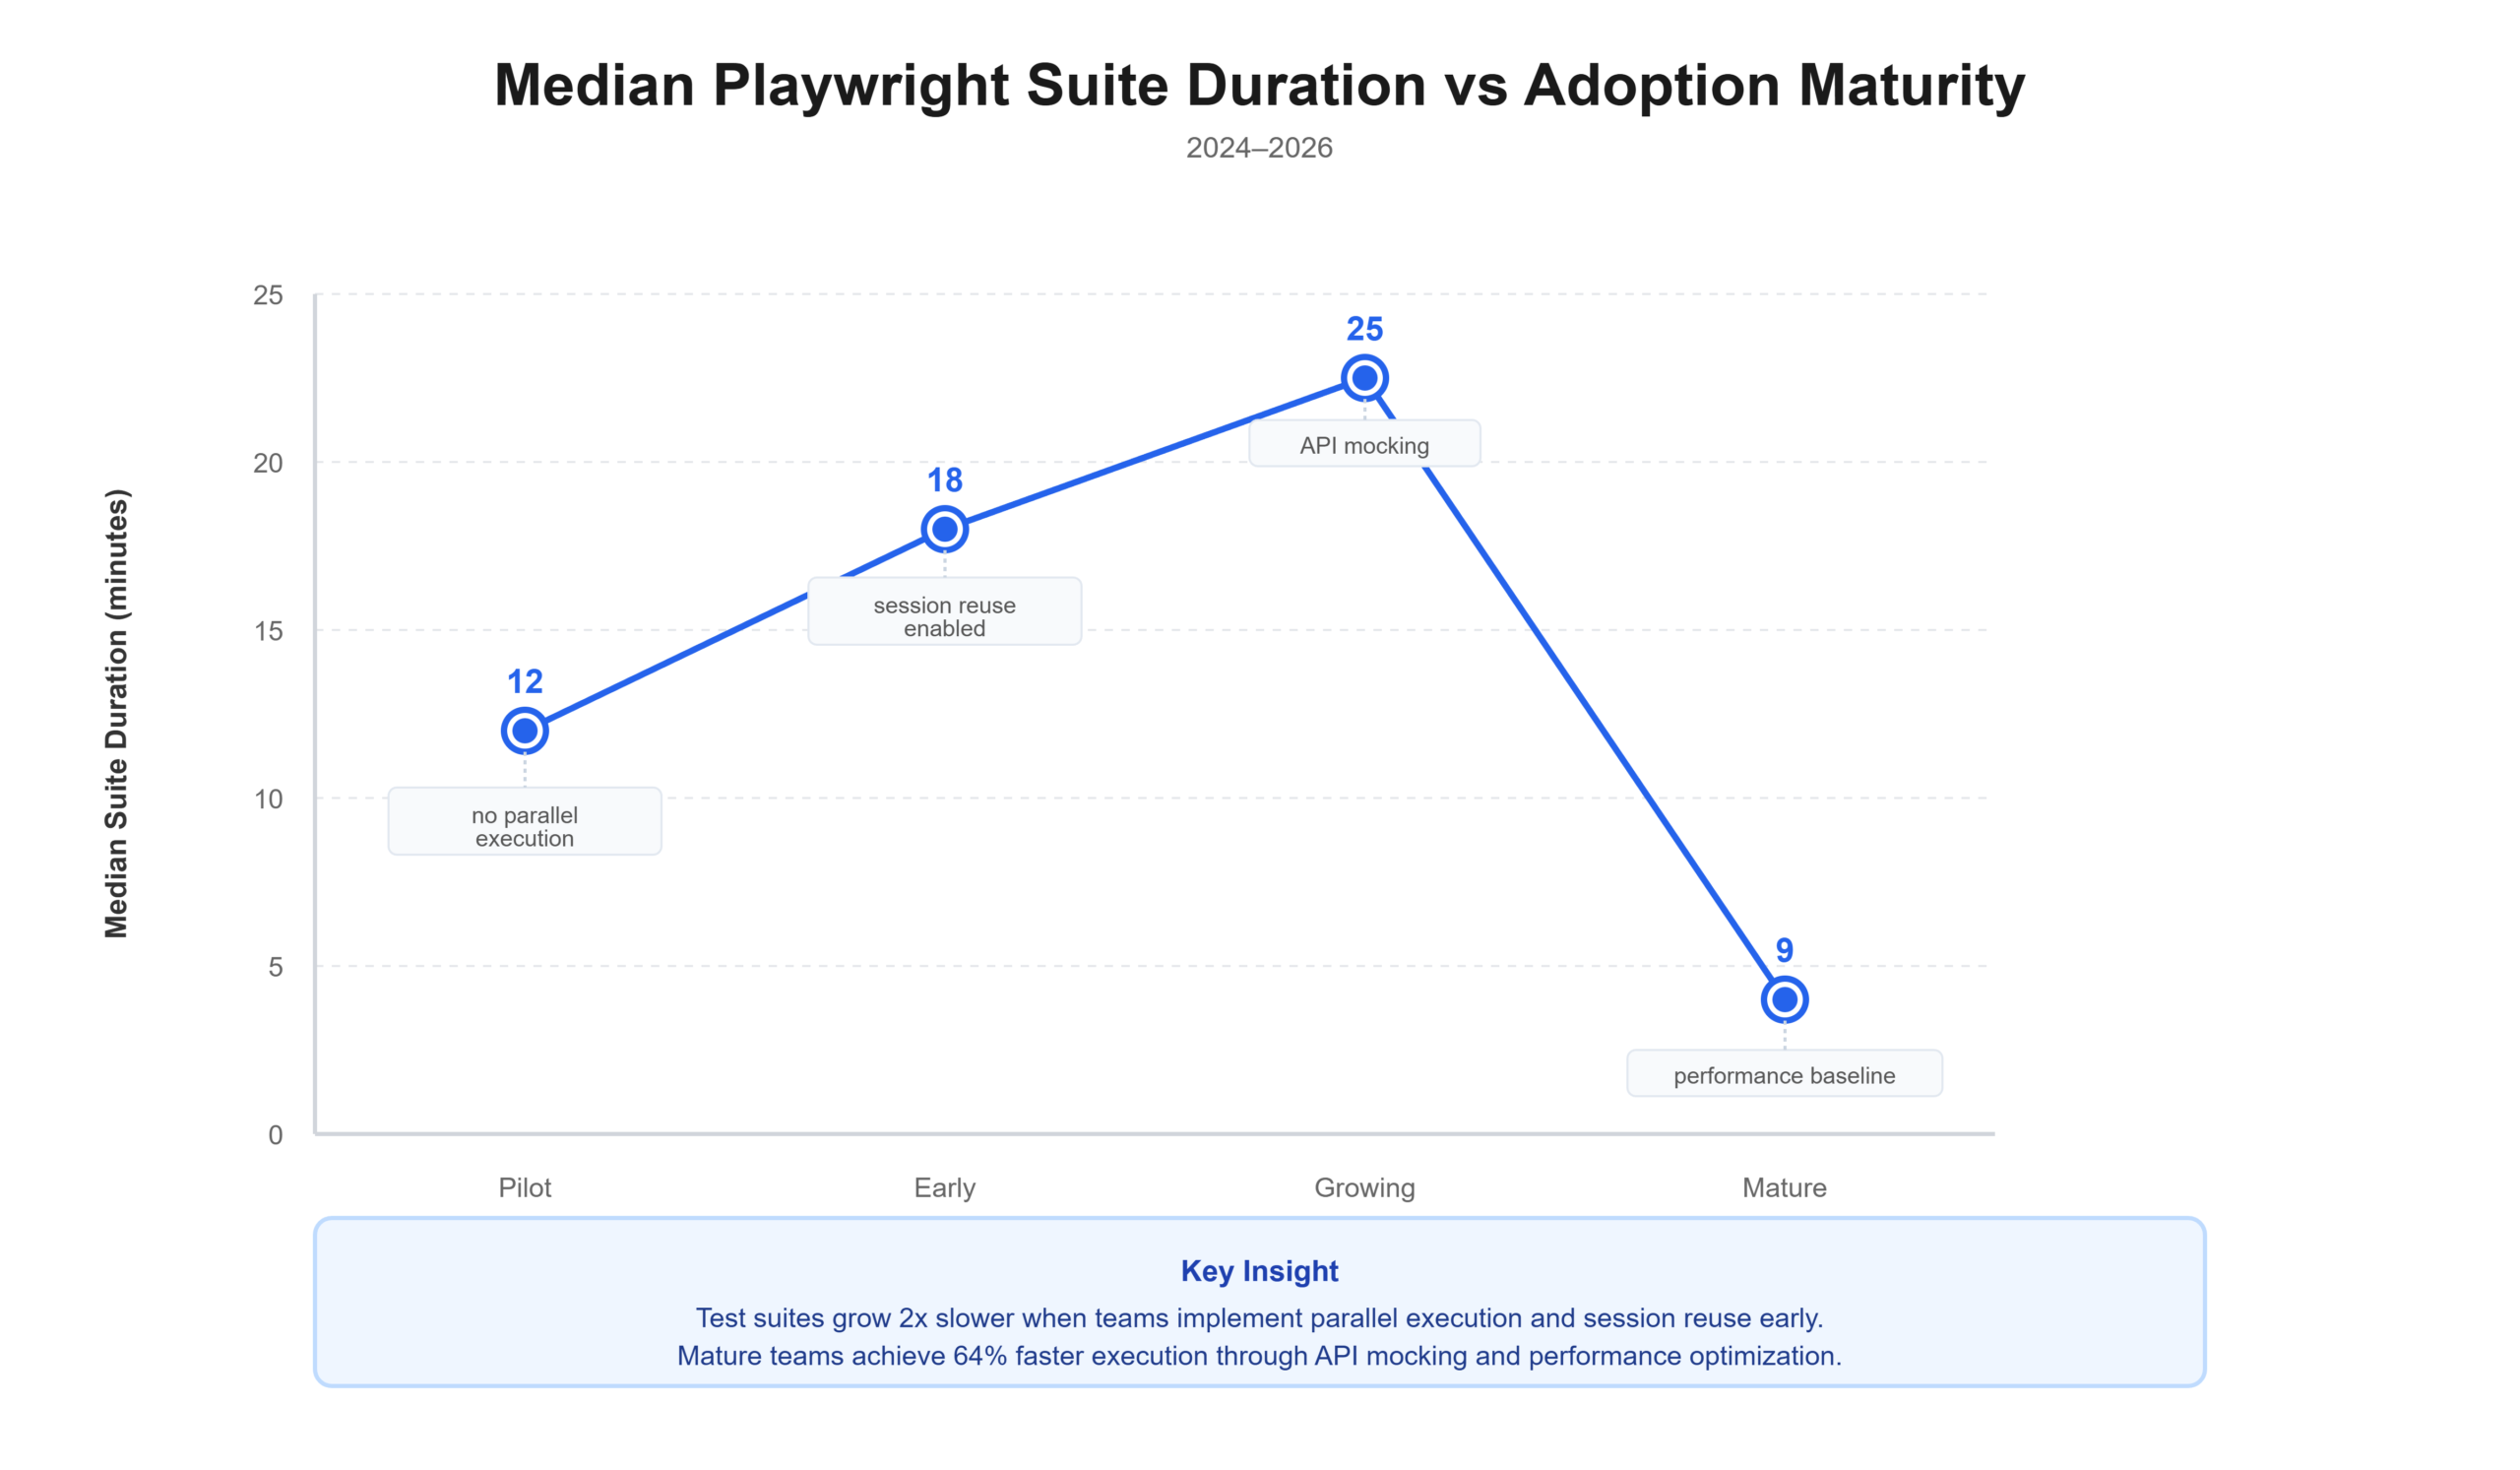
Through these graphics, you can see that:
Pilot shows a median suite duration of 12 minutes, with "no parallel execution."
Early increases to 18 minutes as "session reuse" is enabled.
Growing peaks at 25 minutes with the addition of "API mocking."
Mature drops sharply to 9 minutes due to "performance baseline" and fully optimized testing.
Test Automation Performance Benchmarks
This table gives a quick view of where teams sit. Use it to compare your team.
| Metric | Bottom 25% | Median | Top 25% | Top 10% |
|---|---|---|---|---|
| Test pass rate | 45% | 75% | 85%+ | 92%+ |
| Avg test duration | 4-5 min | 1m 48s | 1 min | <45 s |
| Flaky test rate | 15-20% | 5-10% | 2-5% | <1% |
| Parallel workers | Sequential | 2-3 workers | 4-8 workers | 8-16 |
| Session reuse coverage | None | 40% tests | 70%+ tests | 95%+ |
| CI execution time | 20-30 min | 10-15 min | 5-8 min | 2-4 min |
If you sit at the median or below, the fixes listed here will move you up fast.
Root causes of Playwright slow tests
From the data, six causes appear again and again. They are easy to spot, and fix steps are simple.
1. Inefficient locators and selectors
Problem:
Broad XPath and generic CSS slow DOM lookup.
Fragile selectors cause retries and extra waits.
Examples:
// slow - broad XPath
await page.click('//div[@class="form"]//button[@type="submit"]');

// better - role based
await page.getByRole('button', { name: 'Submit' }).click();

// best - test id
await page.getByTestId('submit-button').click();
Impact:
- Broad XPath: +200–400 ms per lookup.
- Generic CSS: +150–300 ms per lookup.
- Across hundreds of steps, this becomes minutes.
2. Hardcoded waits and timeouts
Problem:
- Teams use waitForTimeout() as a defensive habit.
- That adds fixed delays even when the app is ready.
Bad pattern:
await page.waitForTimeout(3000);
await page.click('#submit');
Better pattern:
await expect(page.locator('#submit')).toBeVisible();
await page.click('#submit');
Impact:
- A single 3s wait where the element is ready in 500 ms wastes 2.5s.
- With dozens of waits, waste adds up to minutes.
- Removing hard waits yields 10–25% time savings commonly.
3. Repeated setup and login
Problem:
- Each test logs in or recreates data.
- Login can be 3–5 s. Multiply that by test count, and cost rises fast.
- Example: 100 tests × 4 s login = 400 s, more than 6 minutes lost.
Fix:
- Use global setup and storageState to reuse sessions.
4. Network dependencies and real API calls
Problem:
- Tests hit real APIs for everything.
- Network latency and unstable endpoints slow tests.
Impact:
- Real API calls add 200–2000 ms per request.
- Network flakiness inflates test duration variance and test flakiness.
Fix:
- Mock non-critical APIs.
- Keep a few end-to-end flows that hit real backends.
5. Sequential execution and poor parallel execution
Problem:
- Many teams run with default workers or sequential runs.
- They fear parallel runs because of flaky tests or shared state.
Example:
- 100 tests × 8 s sequential = 800 s (~13 min).
- Same tests on 4 workers = ~200 s (~3 min).
Fix:
- Set workers to match hardware.
- Use fullyParallel where safe.
- Use per-worker storageState for isolated sessions.
6. Headed mode and heavy page loads
Problem:
- Running headed mode in CI and waiting for networkidle on all navigation adds time.
- Full page loads include images, fonts, and trackers.
Fix:
- Use headless: true in CI.
- Use waitUntil: 'domcontentloaded' when enough.
- Block heavy or non-essential resources during tests that do not require them.
What high-performing teams do differently
High-performing teams treat test performance as a product metric, not a side effect. They put clear processes in place and measure what actually impacts speed and reliability.
In practice, they track test metrics and trends over time, reuse session state instead of repeating setup work, tune parallel execution carefully, and rely on API mocking where it makes sense.
They also run fail-fast pipelines, starting with smoke tests, so problems surface early instead of wasting time on long runs.
Five gaps most teams miss
- Session reuse: missed by 65% of teams. Fix in hours, save 30-50% in suite time.
- Parallel execution tuning: missed by 55%. Fix in hours, save 50-70% with the right workers.
- Flaky test detection: missed by 70%. Fix in 1-2 weeks, drop re-runs 60–80%.
- Performance monitoring and tracing: missed by 75%. Fix in days, make optimization 2-3x faster.
- Fail-fast CI strategy: missed by 60%. Fix in hours, get feedback 65-80% faster.
The real cost of slow suites
Slow suites cost money and time in three main ways.
1. CI and Infrastructure Cost
Example, mid-size team:
- 100 tests, avg test duration 30 s.
- Suite time ~50 min with some parallelization.
- 50 pipeline runs per day = 2,500 min daily.
- At $0.50 per minute = $1,250 daily, ~$450k yearly.
- A 20% speedup can save tens of thousands a year.
2. Developer Productivity Loss
Example:
- 20 developers, 5 commits each, 5 min wait for checks = 500 min lost daily.
- That is 8+ hours of lost focus daily.
- That waste scales with team size and commit frequency.
3. Test maintenance debt
- 40-60% of QA time goes to test maintenance.
- Large suites can have 15-20% obsolete tests.
- Slow and flaky tests make maintenance worse and more frequent.
Test performance guidelines
This section follows your requested direction and gives specific aims and rules.
1. Test performance guidelines
As a rule of thumb, end-to-end tests should finish within 2 to 3 minutes.
Tests that run longer than 4 to 5 minutes tend to become slow, brittle, and harder to debug.
Long-running tests often trigger cascade failures across the suite, wasting CI time. High-performing teams keep E2E tests focused on meaningful scenarios, use balanced assertions, and avoid validating too many flows in a single run.
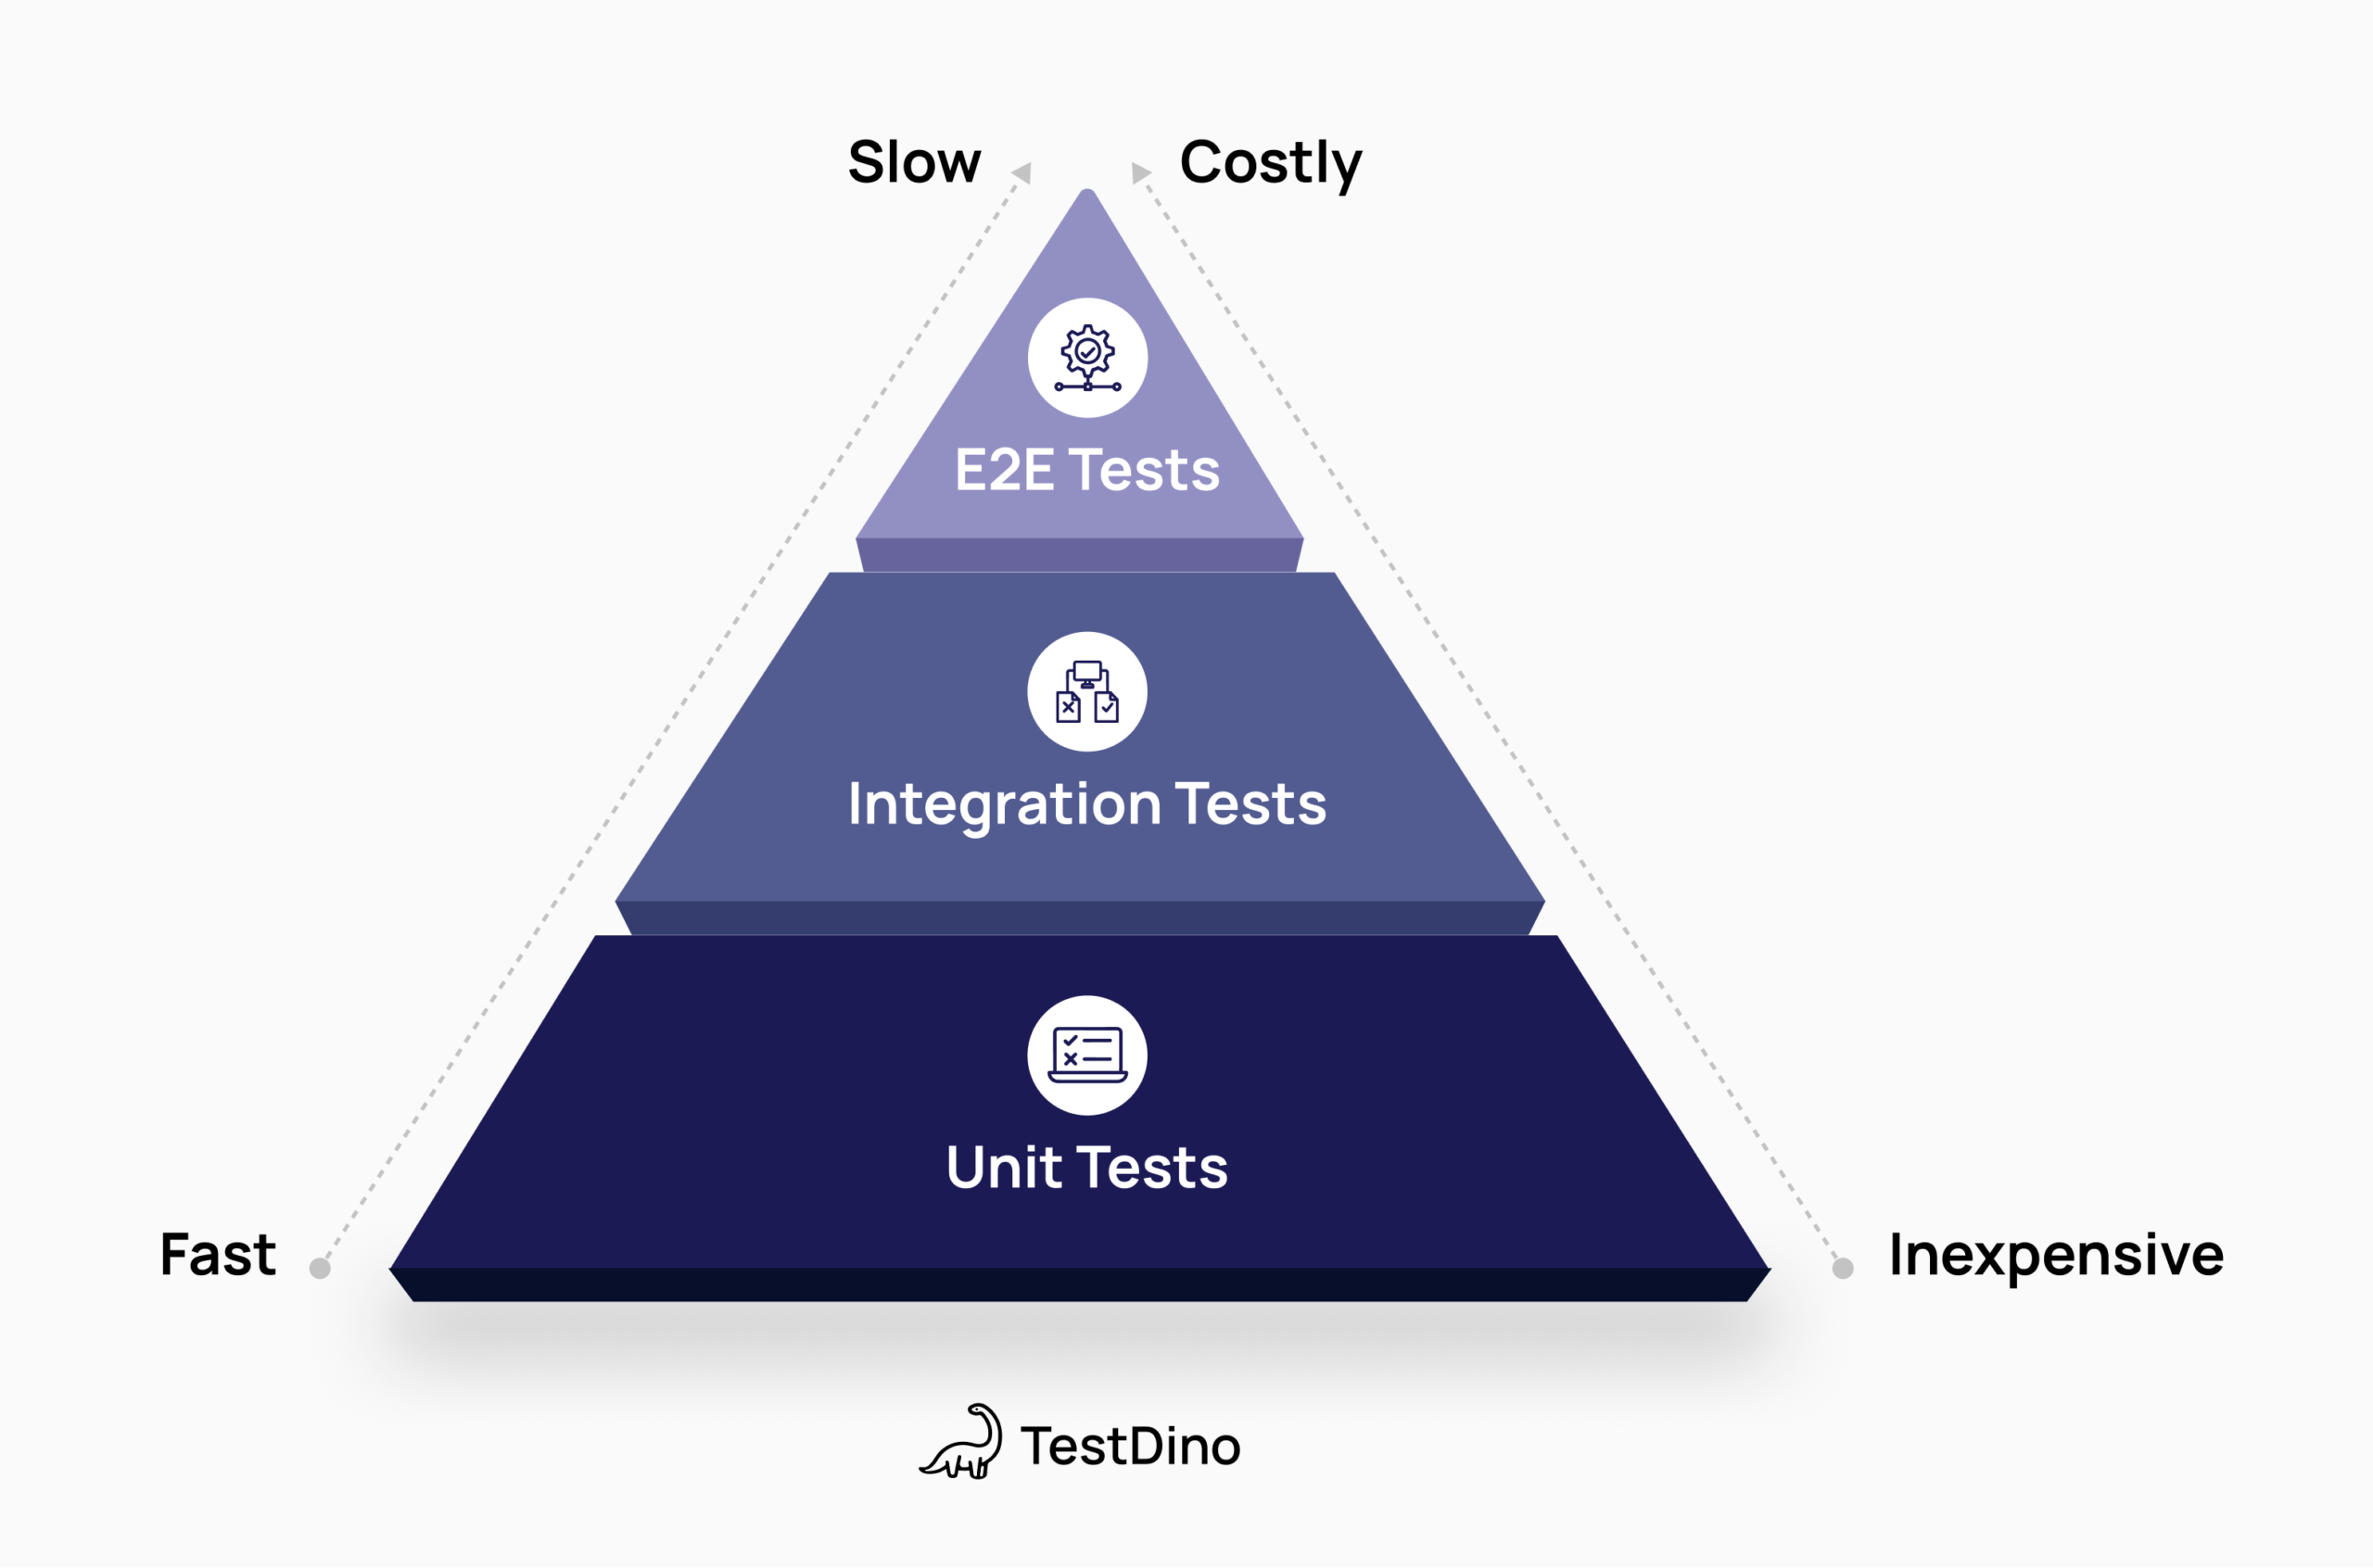
2. Testing pyramid structure
Use three levels for a stable strategy:
| Attribute | Unit Tests | API / Integration | E2E Tests |
|---|---|---|---|
| Focus / Role | Single functions, base of the pyramid | Service interactions, middle layer | Full workflows, top of the pyramid |
| Example Suite | 1,000 tests | 200 tests | 50 tests |
| Avg Duration | 0.2 s | 5 s | 30 s |
| Suite Duration | 20 s (parallel) | 3–4 min (partial parallel) | ~25 min (limited parallel) |
| Run Frequency | Every commit | Every PR / nightly | Nightly / release |
| Daily Runs / Time / Cost | 50 → 17 min → $8.5/day | 20 → ~70 min → $35/day | 10 → 250 min → $125/day |
| Common Failures | Logic-level | Service / DB / config | UI, network, flakiness |
| Cost to Fix | Cheapest | Slower & more expensive | Slowest & most expensive |
3. Cost-benefit analysis
- Fixing a unit test often takes minutes.
- Fixing a UI test can take hours.
- Longer E2E tests touch more components and are more brittle.
- Fewer, focused E2E tests give better ROI than many long E2E tests.
4. Performance monitoring
Performance monitoring is all about keeping an eye on how well a system, application, or process is running. Think of it like continuously checking the pulse of your operations.
It involves tracking key metrics, logs, and KPIs to make sure everything is performing as expected. By monitoring these indicators, you can catch bottlenecks, resource issues, or potential failures before they become bigger problems.
Keeping an eye on trends and unusual patterns helps teams:
- Optimize workflows
- Boost reliability
- Make smarter decisions when it comes to scaling or improving the system
Dashboards and visual tools make it easy to get quick insights and take action when needed.
Two approaches:
- Manual: check test reports and slow lists regularly.
- Automated: Use a tool like TestDino for real-time monitoring, reporting, management, alerts, and optimization insights.
TestDino Features (Actionable):
- QA/Dev dashboard → Compare test performance across runs
- Slow test alerts → Get notified when a test regression occurs, plus AI summaries posted to GitHub issues and Slack channels for instant team triage
- MCP integration → Connect AI tools (Claude, Cursor) for natural language queries on slow/flaky tests and performance trends
- Rerun failed only → Use TestDino last-failed CLI to re-execute only failing tests, cutting suite runtime dramatically
- Optimization suggestions → Identify high-cost tests & refactor opportunities
- CI/CD breakdown → View timing per stage & per test
- Baseline & trends → Track historical performance, not just pass/fail
Benefits, impact in real terms:
When teams identify slow tests early, they often cut total suite time by 10 to 30 percent. Catching regressions sooner saves developer hours and reduces CI pipeline costs.
Continuous performance tracking also makes CI runs more predictable, so teams know what to expect instead of guessing. By prioritizing test optimization, teams focus their effort on the tests that actually block pipeline efficiency.
Recommended usage:
Run TestDino on every CI or CD execution so performance data stays current. Use TestDino MCP in tools like Cursor or Claude Code to inspect failures quickly and stay focused on repeat regressions.
Track slow and long-running tests over time, then set alerts in GitHub or Slack when performance drops or quality gates fail. When debugging, rerun only the failed tests from the previous run to confirm fixes without wasting time.
Get a tool that gives a performance baseline and trends, not only pass/fail.
Practical optimization framework, step by step
The most effective way to speed up Playwright is to work in layers.
Start with quick wins that give immediate results, then move to medium-term improvements, and finally address long-term structural changes. This approach keeps progress steady without disrupting active development.
1. Quick wins you can apply this month
If your Playwright suite feels slow, you do not need a big rewrite to see results. A few focused changes usually deliver the fastest gains.
Start by removing hard waits. Replace waitForTimeout with expect and Playwright's built-in waiting, so tests move as soon as the UI is ready. Add session reuse using global setup and storageState to avoid logging in on every test. Make sure CI runs in headless mode, and enable basic parallel workers that match your available CPU cores. Finally, clean up selectors by replacing broad XPath queries with getByRole or data-testid.
Example for session reuse with global setup:
import { chromium, FullConfig } from '@playwright/test';
async function globalSetup(config: FullConfig) {
  const browser = await chromium.launch();
  const context = await browser.newContext();
  const page = await context.newPage();
  await page.goto('https://app.com/login');
  await page.fill('input[name="email"]', process.env.USER_EMAIL!);
  await page.fill('input[name="password"]', process.env.USER_PASSWORD!);
  await page.click('button:has-text("Login")');
  await page.waitForURL('**/dashboard');
  await context.storageState({ path: 'auth.json' });
  await context.close();
  await browser.close();
}
export default globalSetup;
2. Medium term, 1 to 3 months
Once quick wins are in place, the next step is improving structure and signal. Start by tagging tests as @smoke, @regression, or @performance and always run smoke tests first. This gives fast feedback and prevents long runs when something basic is broken.
For non-critical flows, add API mocking to reduce dependency on slow or unstable services. Tune navigation by using waitUntil: 'domcontentloaded' and block heavy assets that are not needed for assertions.
Capture simple performance baselines so you can spot regressions early, and enable tracing only on retries to keep artifacts useful without slowing every run.
Simple example for API mocking:
await page.route('**/api/orders', route => {
  route.fulfill({
    status: 200,
    contentType: 'application/json',
    body: JSON.stringify({ orders: [] }),
  });
});
3. Long term, 3+ months
Over the long term, teams keep Playwright fast by treating performance as ongoing work. Run regular audits to find slow or obsolete tests and remove what no longer adds value. Build dashboards that track test duration and CI time so regressions are visible early.
Invest in training around locator rules and performance best practices, and use AI helpers to spot flaky behavior or suggest better selectors. Finally, retire low-value tests and add clear guardrails in PR reviews so slow patterns do not creep back into the suite.
Checklist you can copy now
Quick copy this list, run in this order:
- Find waitForTimeout and replace with expect.
- Add globalSetup with storageState.
- Set headless: true in CI.
- Configure workers: workers: process.env.CI ? 4 : Math.max(1, Math.floor(os.cpus().length / 2)).
- Tag tests @smoke, @regression, @performance.
- Mock slow APIs.
- Capture a performance baseline for key pages.
- Add tracing on first retry.
- Monitor flaky test rate and slow tests weekly.
- Remove or archive obsolete tests each quarter.
Conclusion
In short, slow Playwright tests aren't just an annoyance; they directly impact productivity, CI costs, and team velocity. Small inefficiencies multiply quickly as suites grow, but the good news is that most of these problems have clear, actionable fixes.
By focusing on session reuse, smart waits, parallel execution, API mocking, and proper performance monitoring, teams can cut suite runtimes dramatically, reduce flakiness, and get faster feedback. These improvements scale across any size team or project.
The key takeaway: treat test performance like a product metric. Track it, optimize it, and iterate continuously. With the right processes and tools, Playwright can be lightning-fast, reliable, and a true accelerator for your delivery pipeline.
FAQs

Pratik Patel
Co-founder