Test analytics for QA teams: a simple guide
Most QA teams collect endless test data but struggle to get real insight from it. This guide shows how TestDino turns Playwright logs into clear, actionable analytics that improve speed, stability, and quality.

Your test suites are running. Your CI pipelines are green (mostly). But are you actually confident in your quality?
Every day, your team is flooded with test automation data, a sea of logs, artifacts, and pass/fail statuses. Buried somewhere are the critical signals, like the flaky test that wastes hours of developer time and the performance bottleneck that slows down every release.
So we know traditional test reporting is broken. It tells you what happened in a single run, but it doesn't tell you why it happened or what you should do next.
That’s why we built TestDino. It’s designed to do one thing: turn overwhelming data into a clear, actionable signal.
How We Turn Messy Logs into Clear Answers
When a test fails, you get a confusing log file, leaving your team to guess the cause. Is it a real bug or just a random glitch?
TestDino replaces that guesswork with clear answers. The moment a test fails, we automatically investigate.
- We gather all the clues: the error message, screenshots, the specific code change that caused it, and the test's full history.
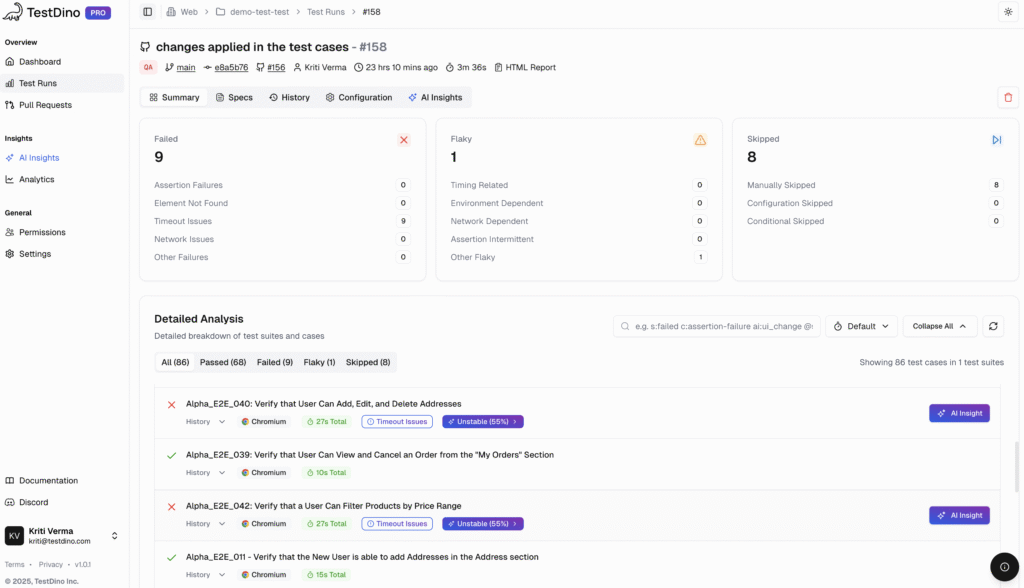
- Next, our AI analyzes this evidence and diagnoses the problem. It intelligently categorizes failures as Actual Bug, UI Change, or Unstable Test.
- Instead of a raw log, you get a simple summary on your dashboard that tells you what's wrong and why.
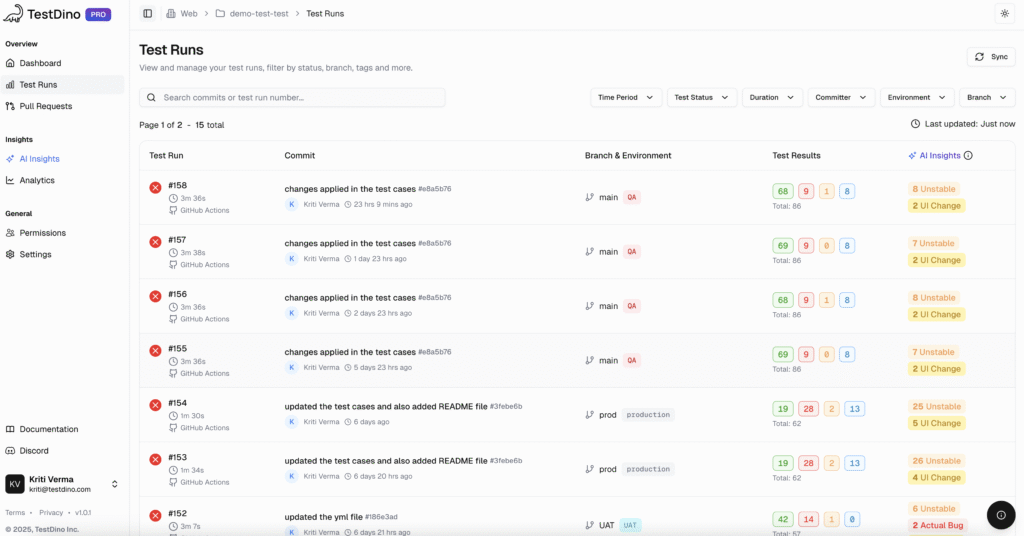
This clear signal lets your team stop digging through noise and start fixing what matters.
The Core Metrics we Track & Why they matter
Inside TestDino, our Analytics module is organized into four powerful tabs, each designed to answer specific questions about your testing operation.
| Analytics Tab | Primary Goal | Key Metrics to Watch |
|---|---|---|
| Summary | Understand overall test health at a glance. | Test Run Volume, Flakiness Rate, New Failure Rate |
| Test Run | Find and fix performance bottlenecks. | Average Run Time, Speed Improvement, Speed by Branch |
| Test Case | Analyze the behavior of individual tests. | Slowest Test Cases, Pass/Fail History |
| Environment | Isolate infrastructure or setup issues. | Execution Results by Environment, Pass Rate Trends |
1. Understanding Overall Health with the Summary Tab
This is your 30,000-foot view. It answers the question: "How healthy is our testing right now?"
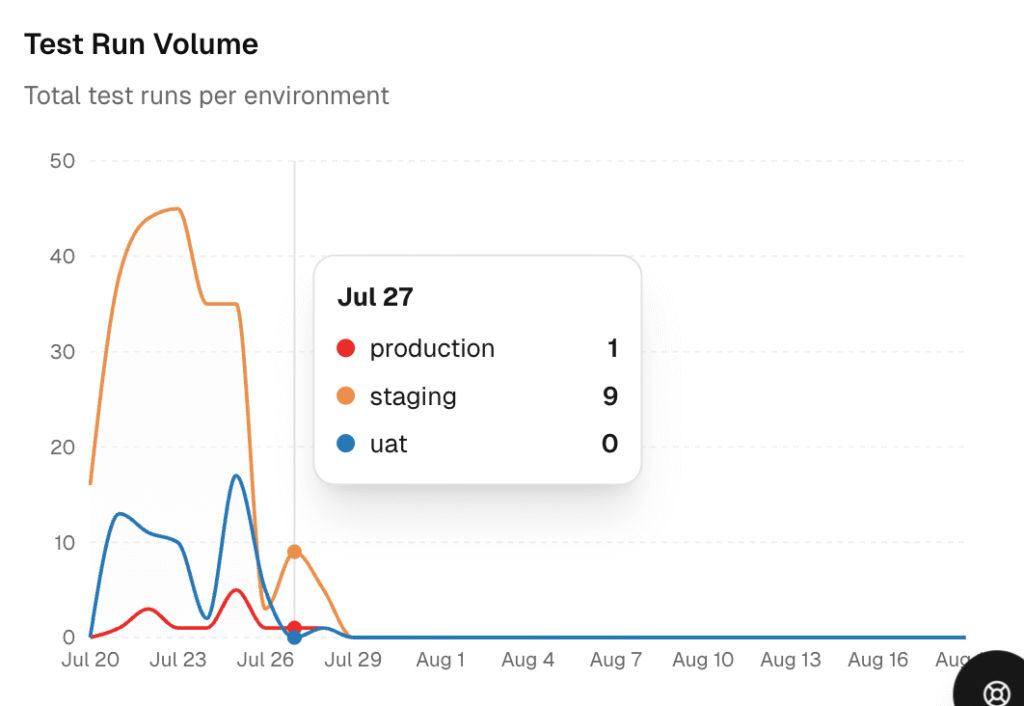
- Test Run Volume: We show you daily run counts broken down by passed and failed tests so that you can correlate failure spikes with deployments or other events.
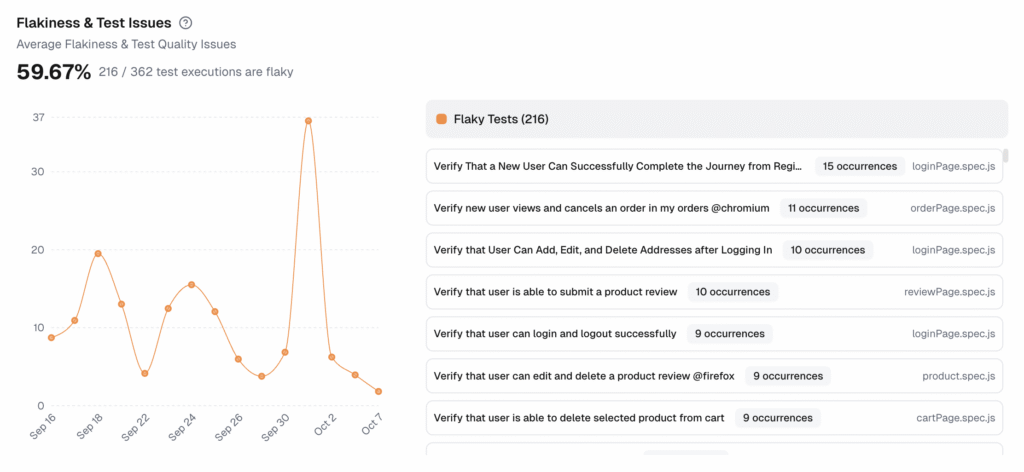
- Flakiness & Test Issues: This is a critical health metric. We calculate the percentage of executions with inconsistent outcomes, giving you a clear indicator of the noise level in your test suite.
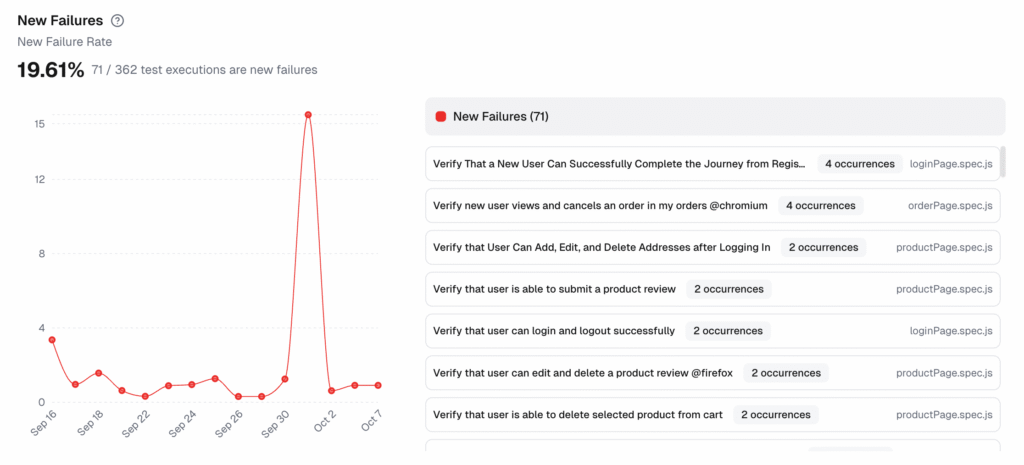
- New Failure Rate: To help you catch regressions the moment they appear, this chart shows the share of tests that are failing for the first time. A spike here is an immediate call to action.
2. Optimizing for Speed with the Test Run Tab
Slow tests kill developer productivity. This tab helps you find and fix performance bottlenecks.
- Key Speed Metrics: We track your Average Run Time, pinpoint the single Fastest Run, and calculate your Speed Improvement over time, quantifying the time saved from your optimizations.
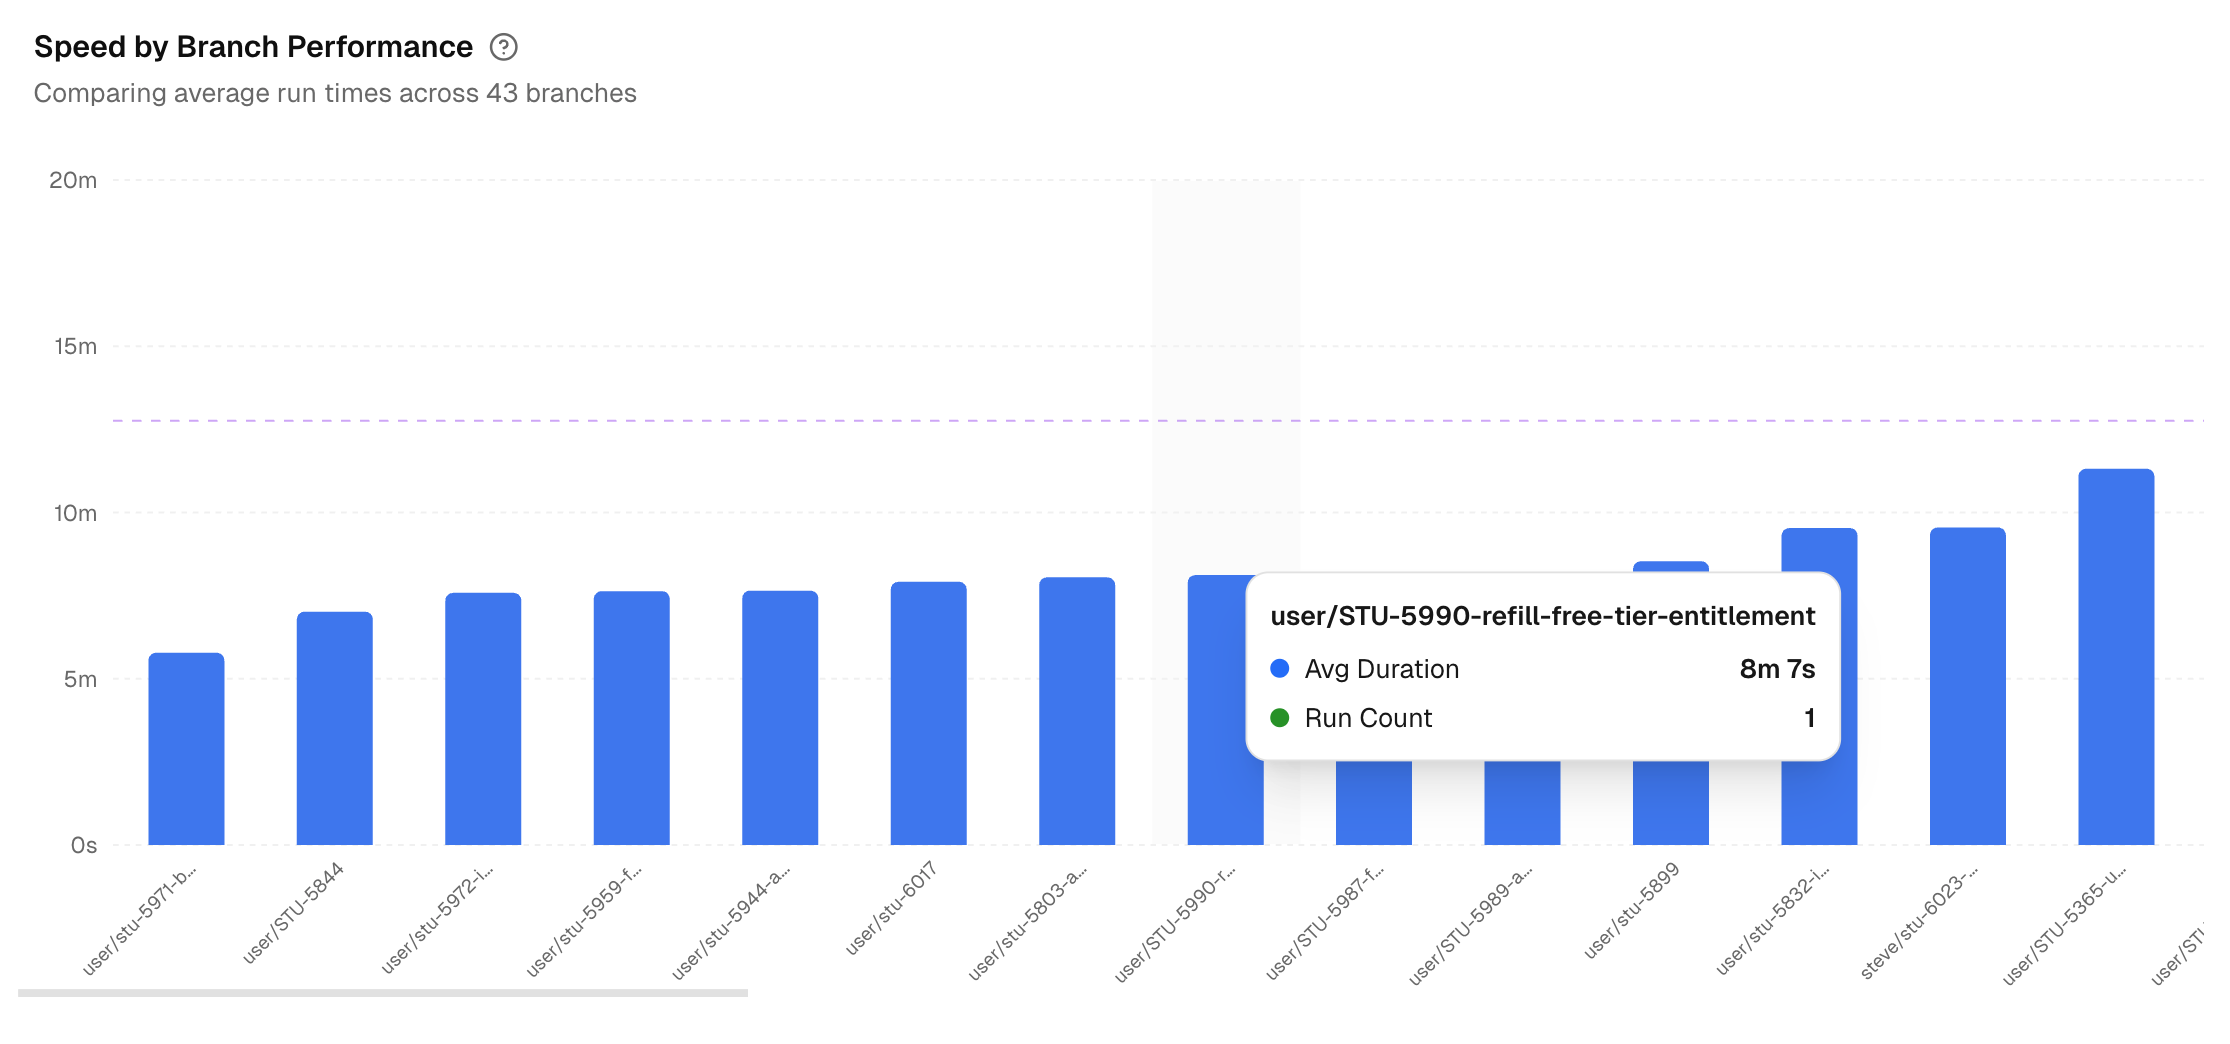
- Speed by Branch Performance: Our column chart instantly shows you which branches are running slower than your baseline, helping you spot branch-specific performance issues before they merge.
3. Drilling Down with the Test Case Tab
This is where you can analyze the behavior of individual tests.
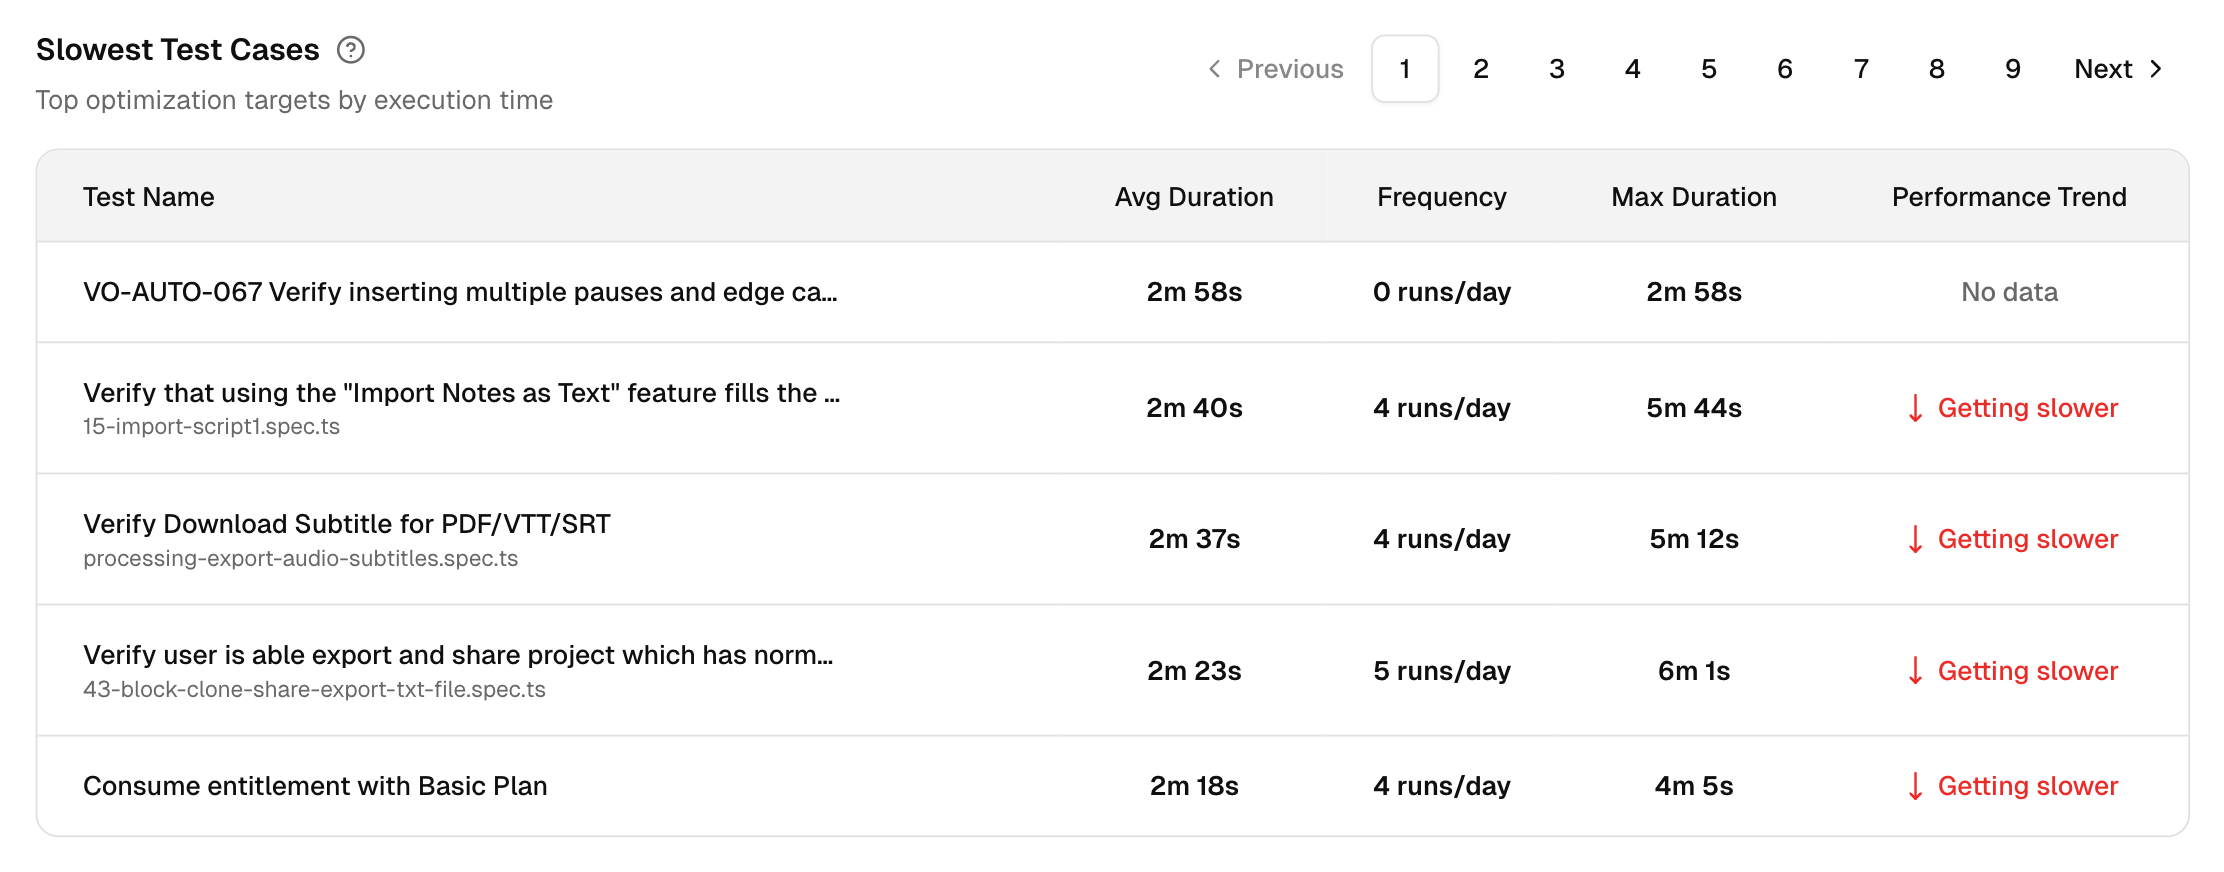
Slowest Test Cases:
We provide a simple, powerful table that lists your top optimization targets. It shows each test's average duration, run frequency, and performance trend, so you know exactly where to focus your efforts.
Comparing reliability with Test Cases Pass/Fail History:
One of the most powerful features in TestDino is the Test Cases Pass/Fail History chart.
Here’s how it works:
- Select up to 10 tests: You can choose from a searchable list of all available tests in your project. This lets you compare related tests (e.g., all tests for the login feature) or a mix of unrelated but problematic ones.
- Visualize trends over time: For each selected test, we plot its pass rate on a time-series chart. The y-axis shows the pass rate from 0% to 100%, and the x-axis shows the date.
- Hover for details: By hovering over any point on the graph, you get a detailed tooltip showing the exact pass/fail counts and the pass rate for that day.
- Confirm fixes and spot regressions: This side-by-side visualization is invaluable.
- If a test’s line jumps from 50% to a steady 100%, you have visual confirmation that a fix was successful.
- Conversely, if a previously stable test suddenly drops to 0%, you know exactly when the regression was introduced.
This feature moves you from looking at a single data point to understanding the complete story of a test’s reliability.
4. Isolating Issues with the Environment Tab
Is it a code bug or an infrastructure problem? This tab helps you find out.
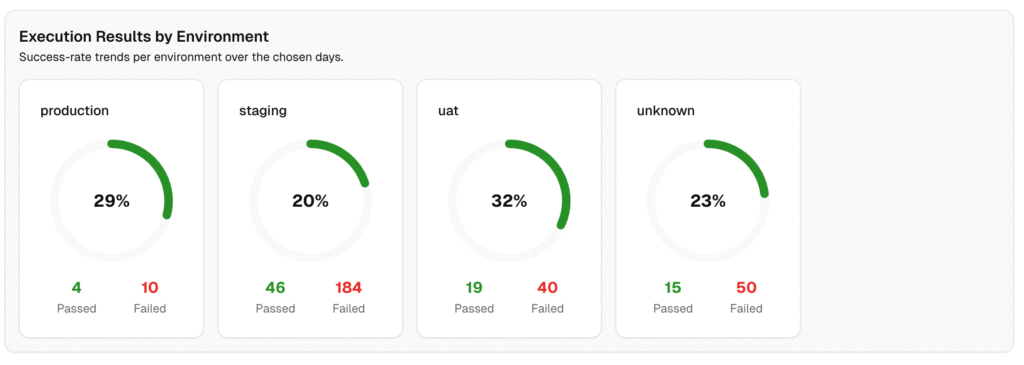
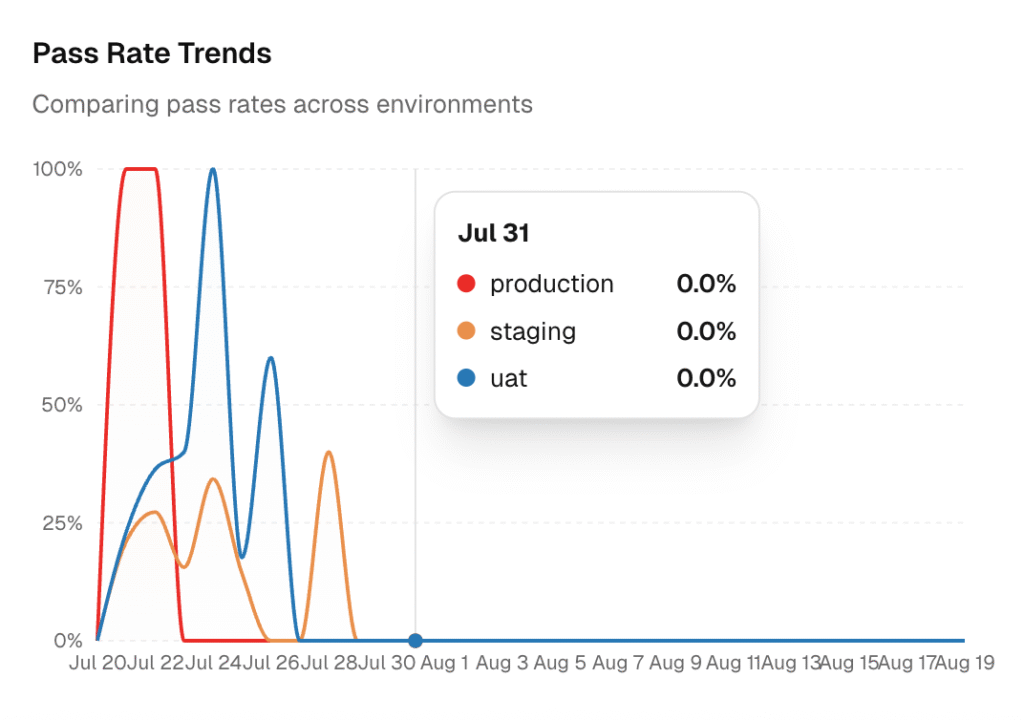
- Execution Results by Environment: We show you a side-by-side comparison of success rates across your environments (e.g., Staging vs. Production). This immediately highlights if failures are concentrated in one specific setup.
- Pass Rate Trends: Each environment gets its own trend line, making it easy to see if an environment's stability has recently degraded, which often correlates with infrastructure changes.
Understanding Test Coverage through the Lens of Analytics
When teams talk about "test coverage," they often mean code coverage, a metric that shows what percentage of the codebase is executed by tests.
While useful, it doesn't tell the whole story. 100% code coverage doesn't mean your application is bug-free; it just means the code was run.
At TestDino, we encourage you to think about Quality Coverage. This concept looks not just at what is tested, but how well it's tested.
Our analytics provide deep insights into your quality coverage:
- Stability Coverage: Are the tests covering your critical features stable? Our Flakiness Rate and Pass Rate Trends show you if the tests for your most important user flows are reliable or a constant source of noise.
- Performance Coverage: Are your tests fast enough to provide quick feedback? The Slowest Test Cases table shows which test cases covering specific parts of your app are disproportionately slow, indicating potential performance issues in the application itself.
- Environmental Coverage: Is your application quality consistent across different environments? Our Environment Analysis shows where failures concentrate, helping you understand if your quality holds up in production-like settings.
By using TestDino, you move beyond a simple percentage and gain a multidimensional view of how effectively your tests ensure quality across your entire application.
Software Testing methods and their Impact on Analytics
Your testing methodology shapes the data you generate. TestDino is designed to provide value regardless of your approach.
Agile Teams: In an Agile environment, you have frequent, small releases.
- The volume of test runs is high. TestDino helps you make sense of this velocity by tracking sprint-over-sprint trends.
- Our New Failure Rate is perfect for catching regressions introduced in a new sprint.
- And Speed Improvement metrics help ensure your test suite doesn't slow down as you add more features.
Behavior-Driven Development (BDD): BDD ties tests directly to business requirements.
- When a test named Given a user adds an item to the cart, Then the cart total should update fails, it represents a broken user feature.
- TestDino’s historical views and failure categorization help you quickly assess the business impact of a failure and prioritize fixes based on user-facing functionality.
Test-Driven Development (TDD): TDD focuses on a tight loop of writing unit tests before code.
- While TestDino is primarily focused on higher-level tests (integration, E2E), our analytics are the perfect complement. TDD ensures the building blocks work.
- TestDino ensures the entire structure is stable, fast, and reliable when all the blocks are put together.
Best Practices for Test Analytics
A powerful tool is only effective when paired with strong practices. Here’s how successful teams use TestDino:
- Define Your "North Star" Metric: Don't track everything. Pick one or two key metrics that align with your biggest pain point. Is it the Flakiness Rate? Or the Average Run Time? Focus the team on improving that number.
- Make Triage a Team Sport: Use the QA Dashboard as a starting point for a daily or weekly triage meeting. Quickly review the AI-categorized failures and assign owners.
- Integrate Actions, Not Just Data: Don't just look at the dashboards. Use our integrations with Jira, Linear, and Slack to make sure insights are turned into tickets and conversations.
- Set Quality Gates in Your CI: Use analytics to set intelligent thresholds. For example, you could fail a build if the New Failure Rate spikes above a certain percentage, preventing regressions from ever reaching your main branch.
- Celebrate Wins: When the Speed Improvement metric shows you’ve saved hours of CI time, or the Flakiness Rate drops to a new low, share it with the team. Proving progress keeps everyone motivated.
The Future of Test Analytics
We're just scratching the surface of what's possible. At TestDino, we're building towards a future where test analytics is not just descriptive, but predictive and prescriptive.
Imagine a world where your analytics platform can:
- Predict Risk: Analyze code changes in a pull request and predict which existing tests are most likely to fail before you even run them.
- Suggest Fixes: Use generative AI to analyze a flaky test's code and failure history, then suggest specific code changes to make it more stable.
- Optimize Test Selection: Intelligently select and run only the most relevant subset of tests for a given change, dramatically reducing CI times without sacrificing confidence.
This is the future we are building, a future where testing is not a bottleneck, but a source of intelligence that accelerates development.
Conclusion
Stop letting your team drown in raw test data. The future of effective QA is not about running more tests; it’s about deriving more intelligence from the tests you already have.
We built our platform to provide that intelligence.
We give you the signals you need to find real bugs faster, eliminate flaky tests, and speed up your feedback loops. We turn your test suite from a simple gatekeeper into a source of continuous improvement.
Ready to see the difference between data and a true signal? Explore TestDino Analytics and start your free trial today.
FAQs
TestDino automatically identifies flaky tests by analyzing their history.
- Our Analytics platform then tracks your overall Flakiness Rate and highlights the tests that contribute the most noise, so you can prioritize stabilizing them.
- Our AI also helps distinguish intermittent "Unstable Test" failures from consistent "Actual Bug" failures.
TestDino reads the standard Playwright JSON report and, if available, the HTML report folder (screenshots, traces, logs, console).
It extracts outcomes, durations, retries, error messages, branch/commit, and environment metadata to cluster errors, label failures (Actual Bug, UI Change, Unstable Test), and build trends.
Yes.
- Change a failure’s label (Actual Bug, UI Change, Unstable Test) and add a short note.
- TestDino records your correction and factors it into future suggestions for similar tests, branches, and environments.

Pratik Patel
Co-founder