Guide to test automation reporting for Playwright
Discover how Playwright test automation reporting turns technical test results into clear business insights. Learn how real-time dashboards and detailed reports help CEOs and teams track quality, speed up releases, and make smarter data-driven decisions for their digital products.
Over the years, I've seen countless engineering teams hit a wall. It’s the same story: they invest heavily in building a sophisticated test automation suite, only to find their CI/CD pipelines clogged with ambiguous failures.
Not a new problem, but the old solutions are no longer enough. Basic pass/fail reports don't provide the context needed to make fast, smart decisions.
This guide is my perspective on the evolution of test automation reporting. We’ll go from the fundamentals to the advanced analytics that modern teams need, and I'll show you how we approach each concept to give your team the visibility it deserves.
The Evolution of Test Reporting: From Raw Logs to Actionable Insights
Not long ago, a software test report was often just the raw console output from a CI job. We’d scroll through thousands of lines looking for a stack trace.
Then came simple HTML reports and JUnit XML summaries, which were a step up. They gave us basic pass/fail counts and timings, which CI tools like Jenkins and GitLab could display.
Now, the complex applications and rapid release cycles demand more. So the simple pass or fail status doesn't answer:
- What went wrong with this test? (a bug in the app, a problem with the test, or an issue with the setup?)
- Is this a new failure, or has it happened before?
- Is this test becoming slower over time?
- Which group of tests is the most unstable and eroding our team's trust?
This is where the paradigm shifts from reporting to analytics. Reporting tells you what happened in a single run. Analytics tells you why it happened and reveals patterns over time.
At TestDino, we've built our platform around this distinction, creating a single source of truth for every test execution in your project.
Challenge
The Old Way (Basic Reporting)
The TestDino Way (Intelligent Analytics)
Failure Triage
Manually reading through CI logs to find the error.
AI automatically categorizes failures into Actual Bug, UI Change, or Unstable test.
Flaky Tests
Guesswork based on inconsistent results; trust in tests erodes.
Automatically tracks test history to identify flaky tests and measure their impact.
Performance Issues
No visibility into test speed until the entire suite is slow.
Analytics dashboards track the duration of every test, highlighting the slowest ones to optimize.
PR Reviews
Reviewers must switch to the CI tool to see a basic pass/fail status.
A rich summary of test results appears directly in the Pull Requests view, showing risk at a glance.
Team Visibility
Reports are siloed in CI artifacts, accessible only to a few.
Role-specific dashboards give QA, Developers, and Managers the exact information they need.
| Challenge | The Old Way (Basic Reporting) | The TestDino Way (Intelligent Analytics) |
|---|---|---|
| Failure Triage | Manually reading through CI logs to find the error. | AI automatically categorizes failures into Actual Bug, UI Change, or Unstable test. |
| Flaky Tests | Guesswork based on inconsistent results; trust in tests erodes. | Automatically tracks test history to identify flaky tests and measure their impact. |
| Performance Issues | No visibility into test speed until the entire suite is slow. | Analytics dashboards track the duration of every test, highlighting the slowest ones to optimize. |
| PR Reviews | Reviewers must switch to the CI tool to see a basic pass/fail status. | A rich summary of test results appears directly in the Pull Requests view, showing risk at a glance. |
| Team Visibility | Reports are siloed in CI artifacts, accessible only to a few. | Role-specific dashboards give QA, Developers, and Managers the exact information they need. |
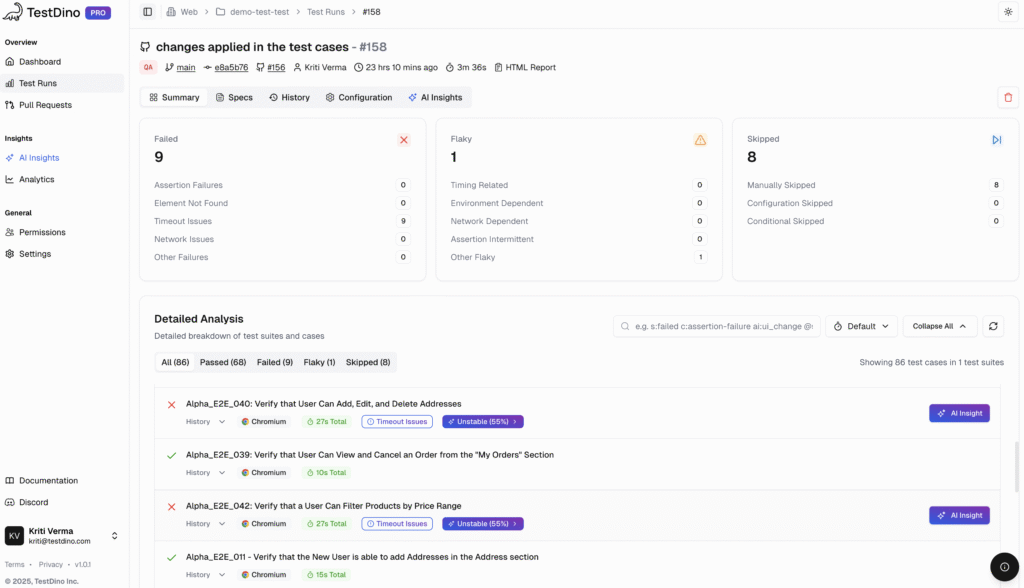
The Anatomy of a Modern Test Report (The TestDino Way)
To build rich analytics, you need to start with the right raw materials. A modern test run generates a wealth of artifacts, and TestDino is designed to synthesize them into a coherent story.
We don’t just store these artifacts; we add layers of context, status, branch, environment, and AI-driven labels to make them instantly useful.
Here are the core components we work with:
- Playwright Test Report: We parse this to derive the counts of the tests that passed, failed, and were skipped.
- Trace Files: Playwright’s trace viewer is a game-changer for debugging. We integrate these traces directly, so you can see a step-by-step DOM snapshot, network requests, and console logs for every action without leaving the platform.
- Screenshots: We link visual evidence directly to the failing test step. A developer can see the UI at the moment of failure, dramatically reducing the time it takes to reproduce a bug.
- Logs: We capture browser console logs and other outputs to ensure all the necessary error messages are tied to the specific test run.
In TestDino, these artifacts are presented in a clean, file-centric view where you can sort by slow or failing specs and tests, moving from a high-level signal to the exact test that needs action in seconds.
Bringing Intelligence to Your CI/CD Pipeline with TestDino
A reporting tool shouldn't live outside your development workflow; it should be an integral part of it.
We designed TestDino to deeply integrate with your CI/CD process, providing crucial insights where you need them most.
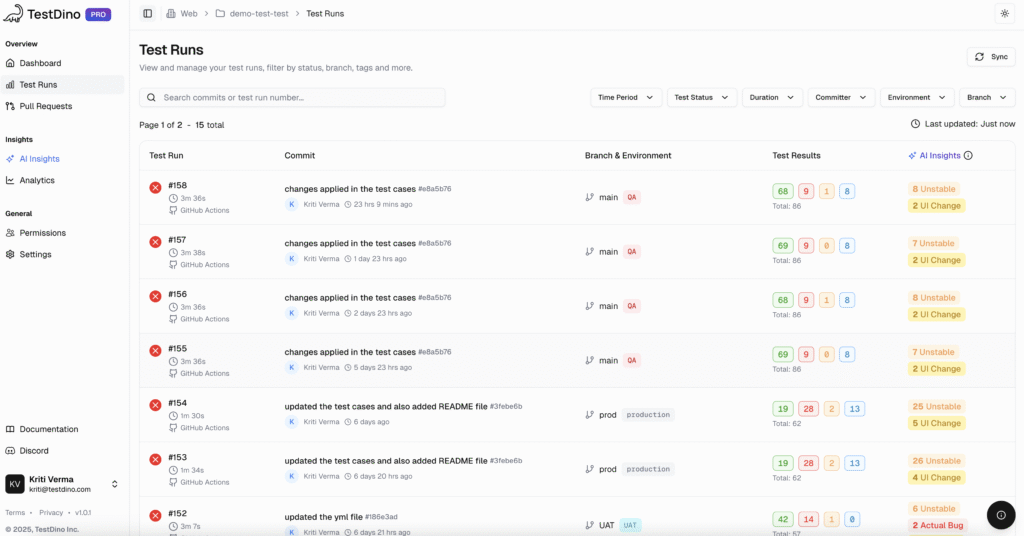
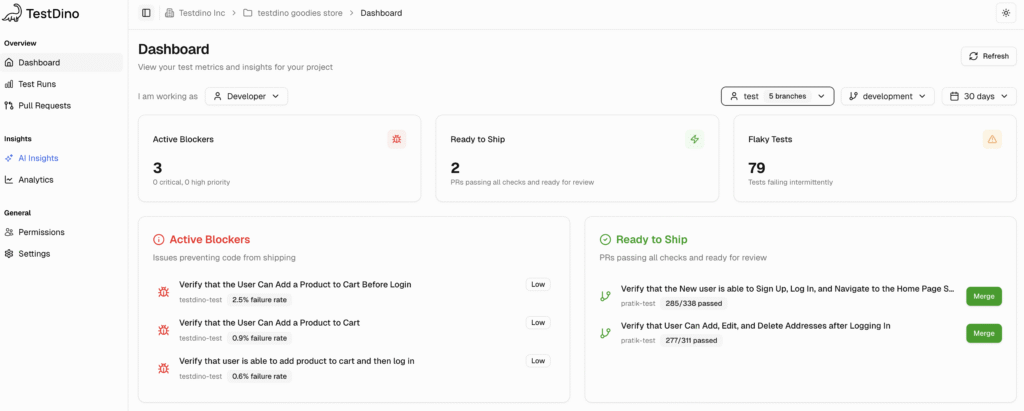
1. A Single Source of Truth for Every Run
Once your CI pipeline is connected to TestDino, our Test Runs tab becomes the mission control for your testing operations. It's more than a list of builds.
- For every run, you can see the commit message, author, branch, and environment all in one place.
- You can filter runs by time period, test status, committer, or environment, making it easy to focus on what matters.
- This view transforms a chaotic list of CI jobs into an organized, searchable history of your project's quality.
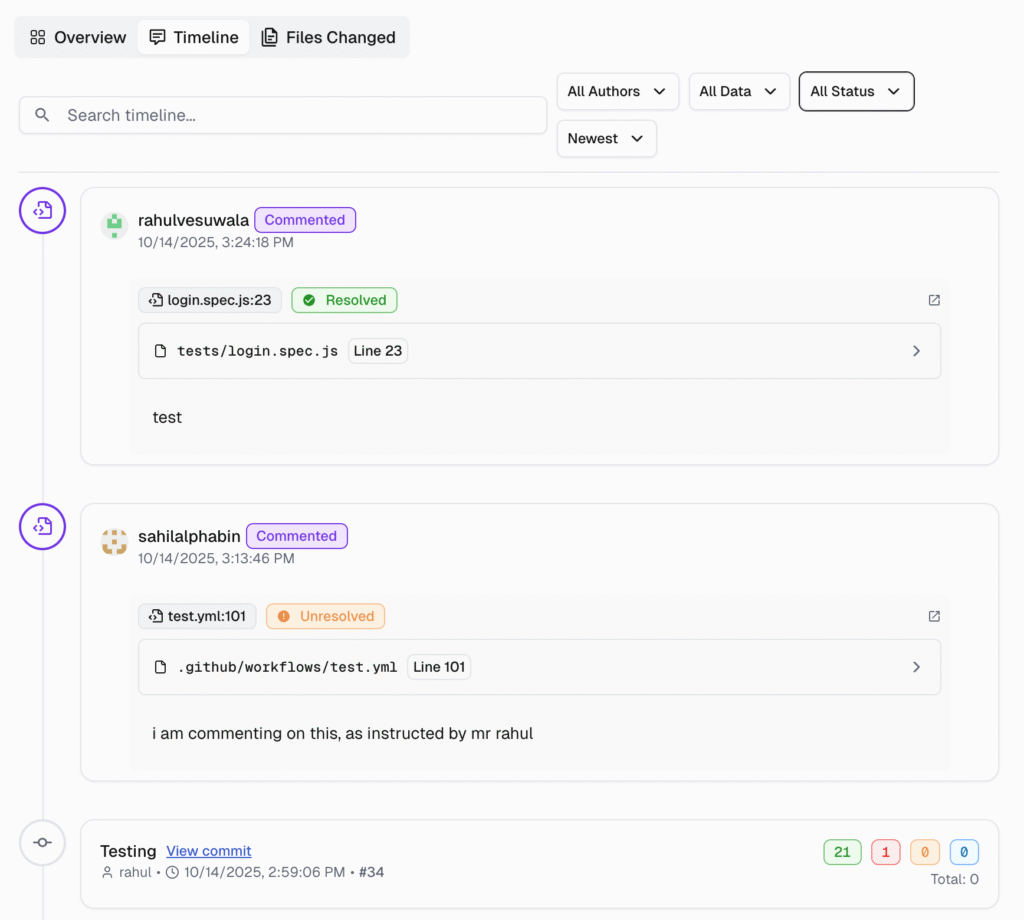
2. Test Context Where It Matters: In the Pull Request
One of the biggest friction points in development is the code review process. A developer submits a pull request, and the reviewer has to jump to the CI tool to see if the tests passed. We solve this with our Pull Requests view.
TestDino lists each PR with a compact summary of its latest test run.
- It adds crucial test context, like pass/fail/flaky counts, so reviewers can assess the risk of a change before they even look at the code.
- If a test failed, the reviewer can jump from the PR view straight into the detailed run with all the evidence needed for triage.
- This workflow keeps the focus on shipping quality code, not hunting for test results.
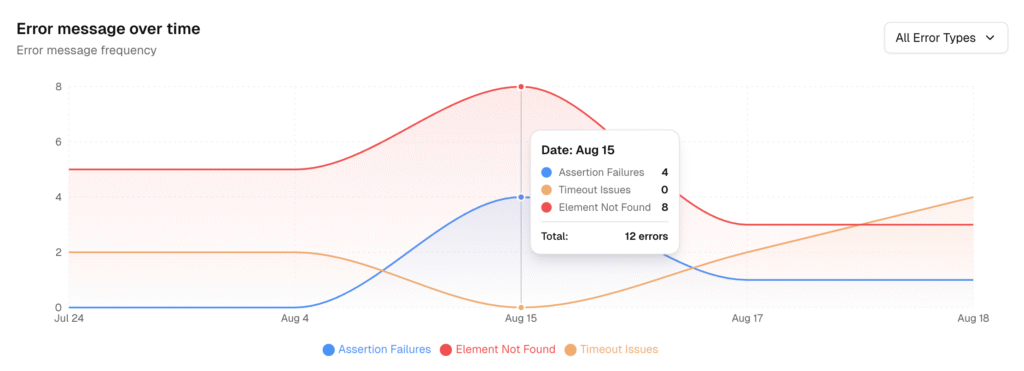
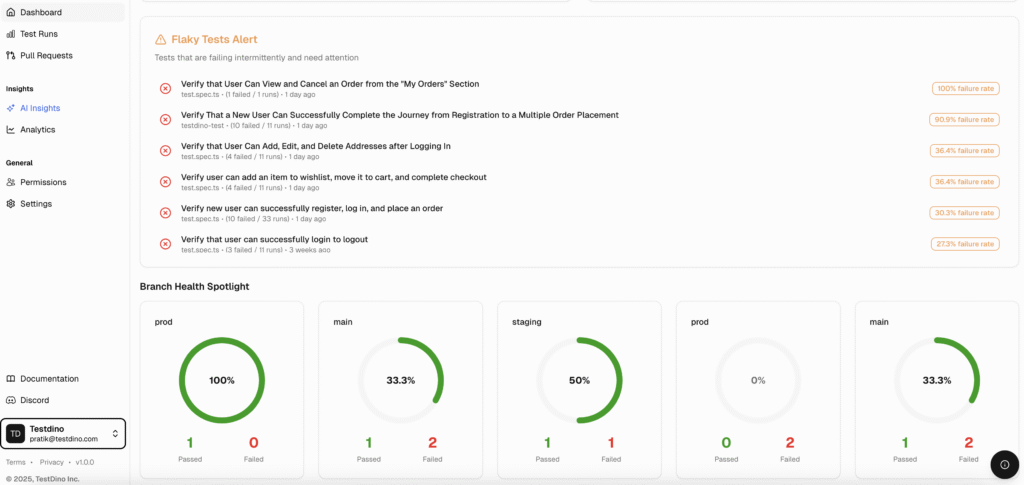
Beyond Pass & Fail: Experience True Analytics
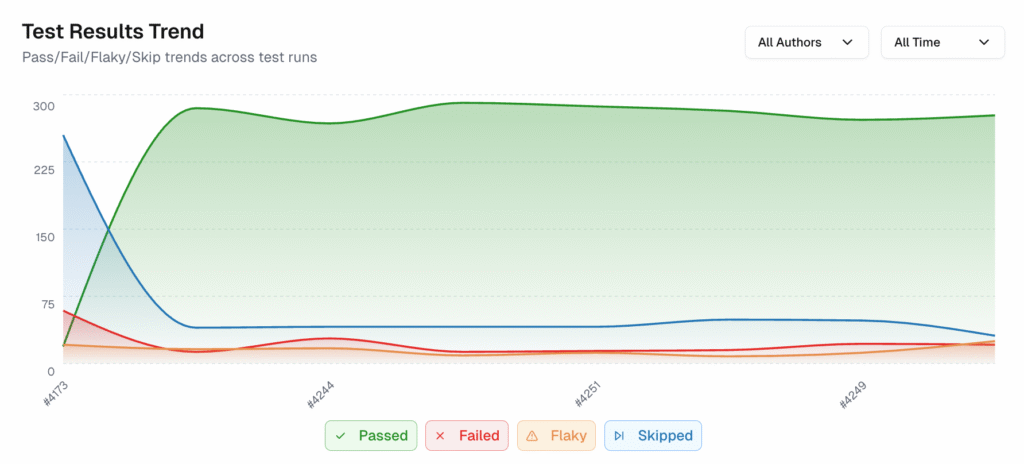
To understand the health of your application, you need to look at the trends, not just individual data points. That’s why we built our Analytics dashboard.
It turns all your test activity into clear, simple trends, so you can spend less time guessing and more time fixing the right things.
Our dashboard is built around four key perspectives:
- Summary View: This is your high-level health check.
- It shows total test runs, pass/fail rates, and, most importantly, it tracks your flakiness and new failure rates over time.
- A spike in the "New Failure Rate" chart is an immediate signal of a regression from a recent change.
- Test Run View: This view is all about speed and efficiency.
- It tracks your average run time, highlights your fastest run, and calculates the time saved from optimizations.
- You can even compare performance by branch to see if a feature branch is introducing slowness.
- Test Case View: Here, we help you find your biggest optimization targets.
- The "Slowest Test Cases" table lists the tests that consume the most time, making it obvious where you should focus your efforts to speed up the entire suite.
- Environment View: Failures are often not caused by code but by the environment in which they run.
- This view lets you quickly see which environments have the most test failures, helping you separate product bugs from infrastructure issues.
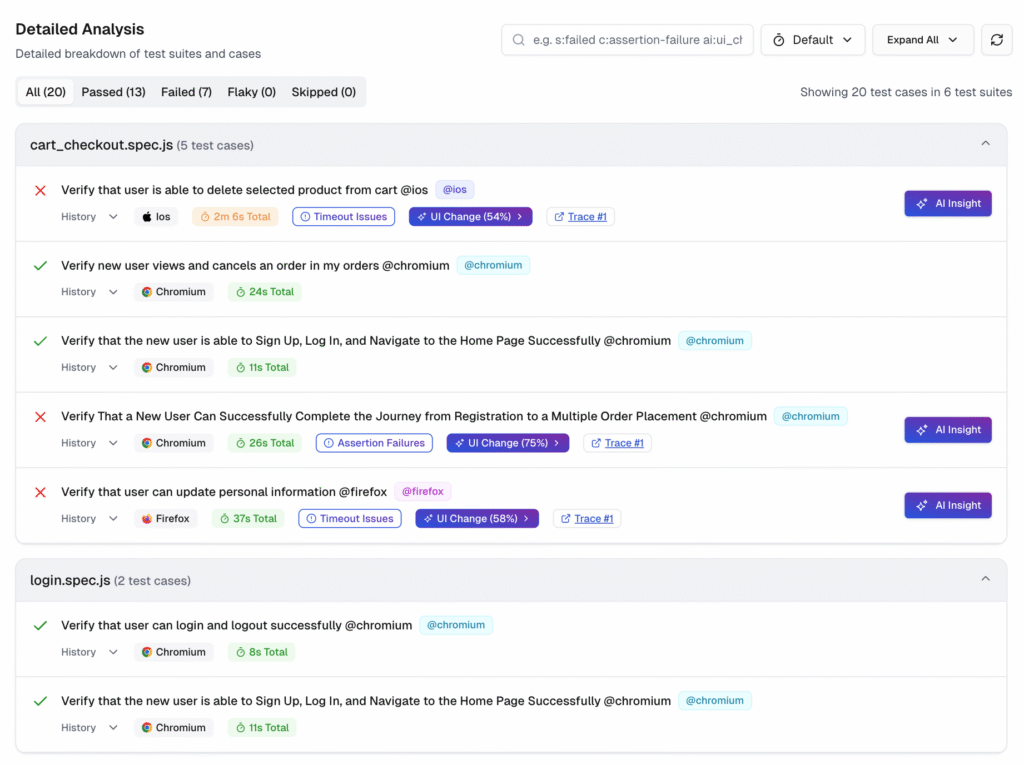
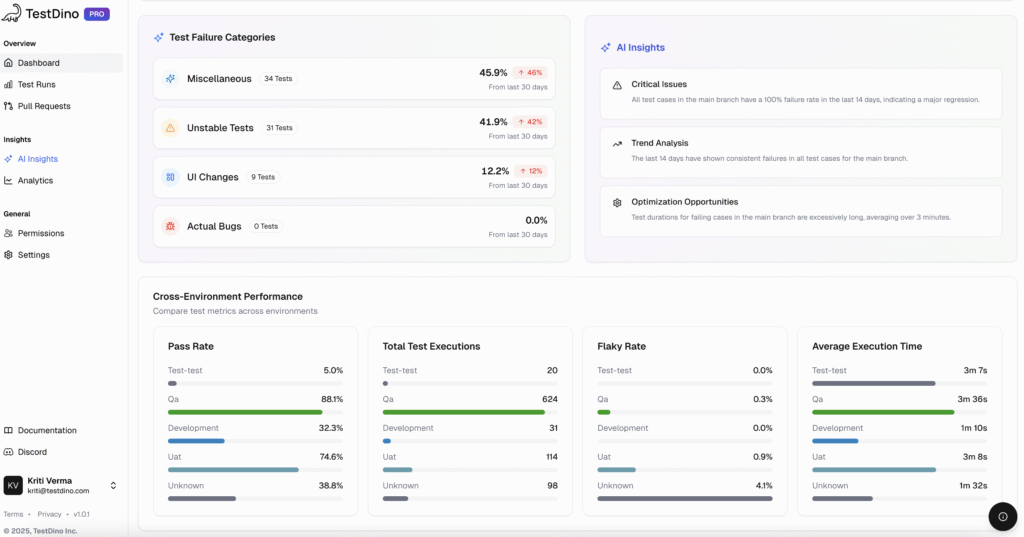
The Power of AI in Test Triage
The most time-consuming part of managing test failures is triage. We're applying AI to make this process dramatically faster and more accurate. Our
AI Insights engine analyzes your failures and groups them by root cause, so you can act on signals instead of noise.
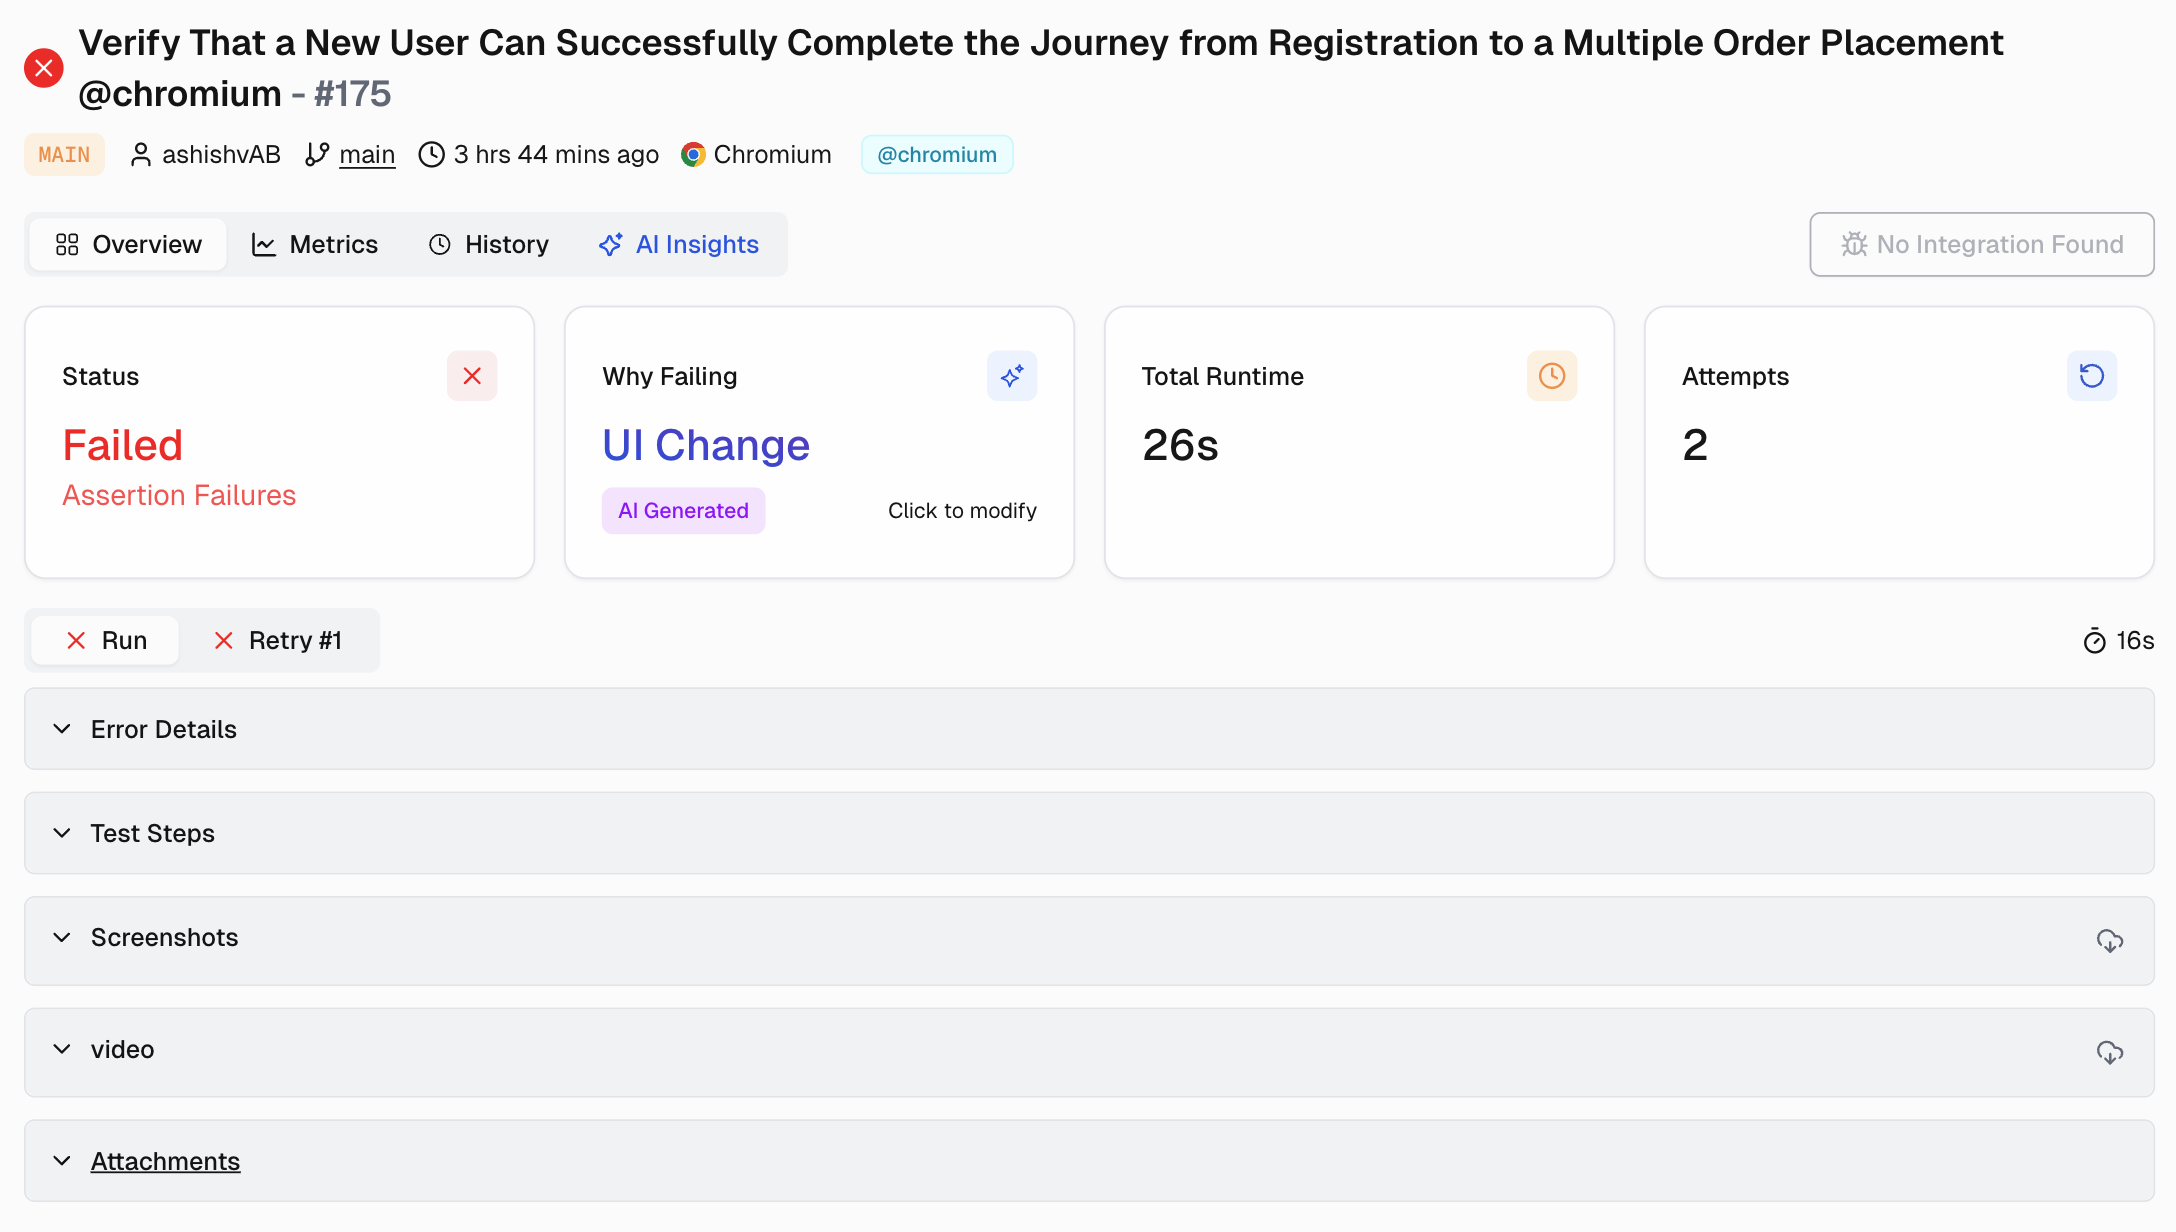
Our AI automatically categorizes every failure into one of four buckets:
- Actual Bug: Consistent failures that point to a real product defect. These are your top priorities.
- UI Change: Failures caused by a selector or DOM change that broke a test. These can be routed to the team responsible for the UI update.
- Unstable Test: Intermittent failures that often pass on retry. We group these so you can focus on stabilizing them and reducing pipeline noise.
- Miscellaneous: Failures caused by setup, data, or CI issues.
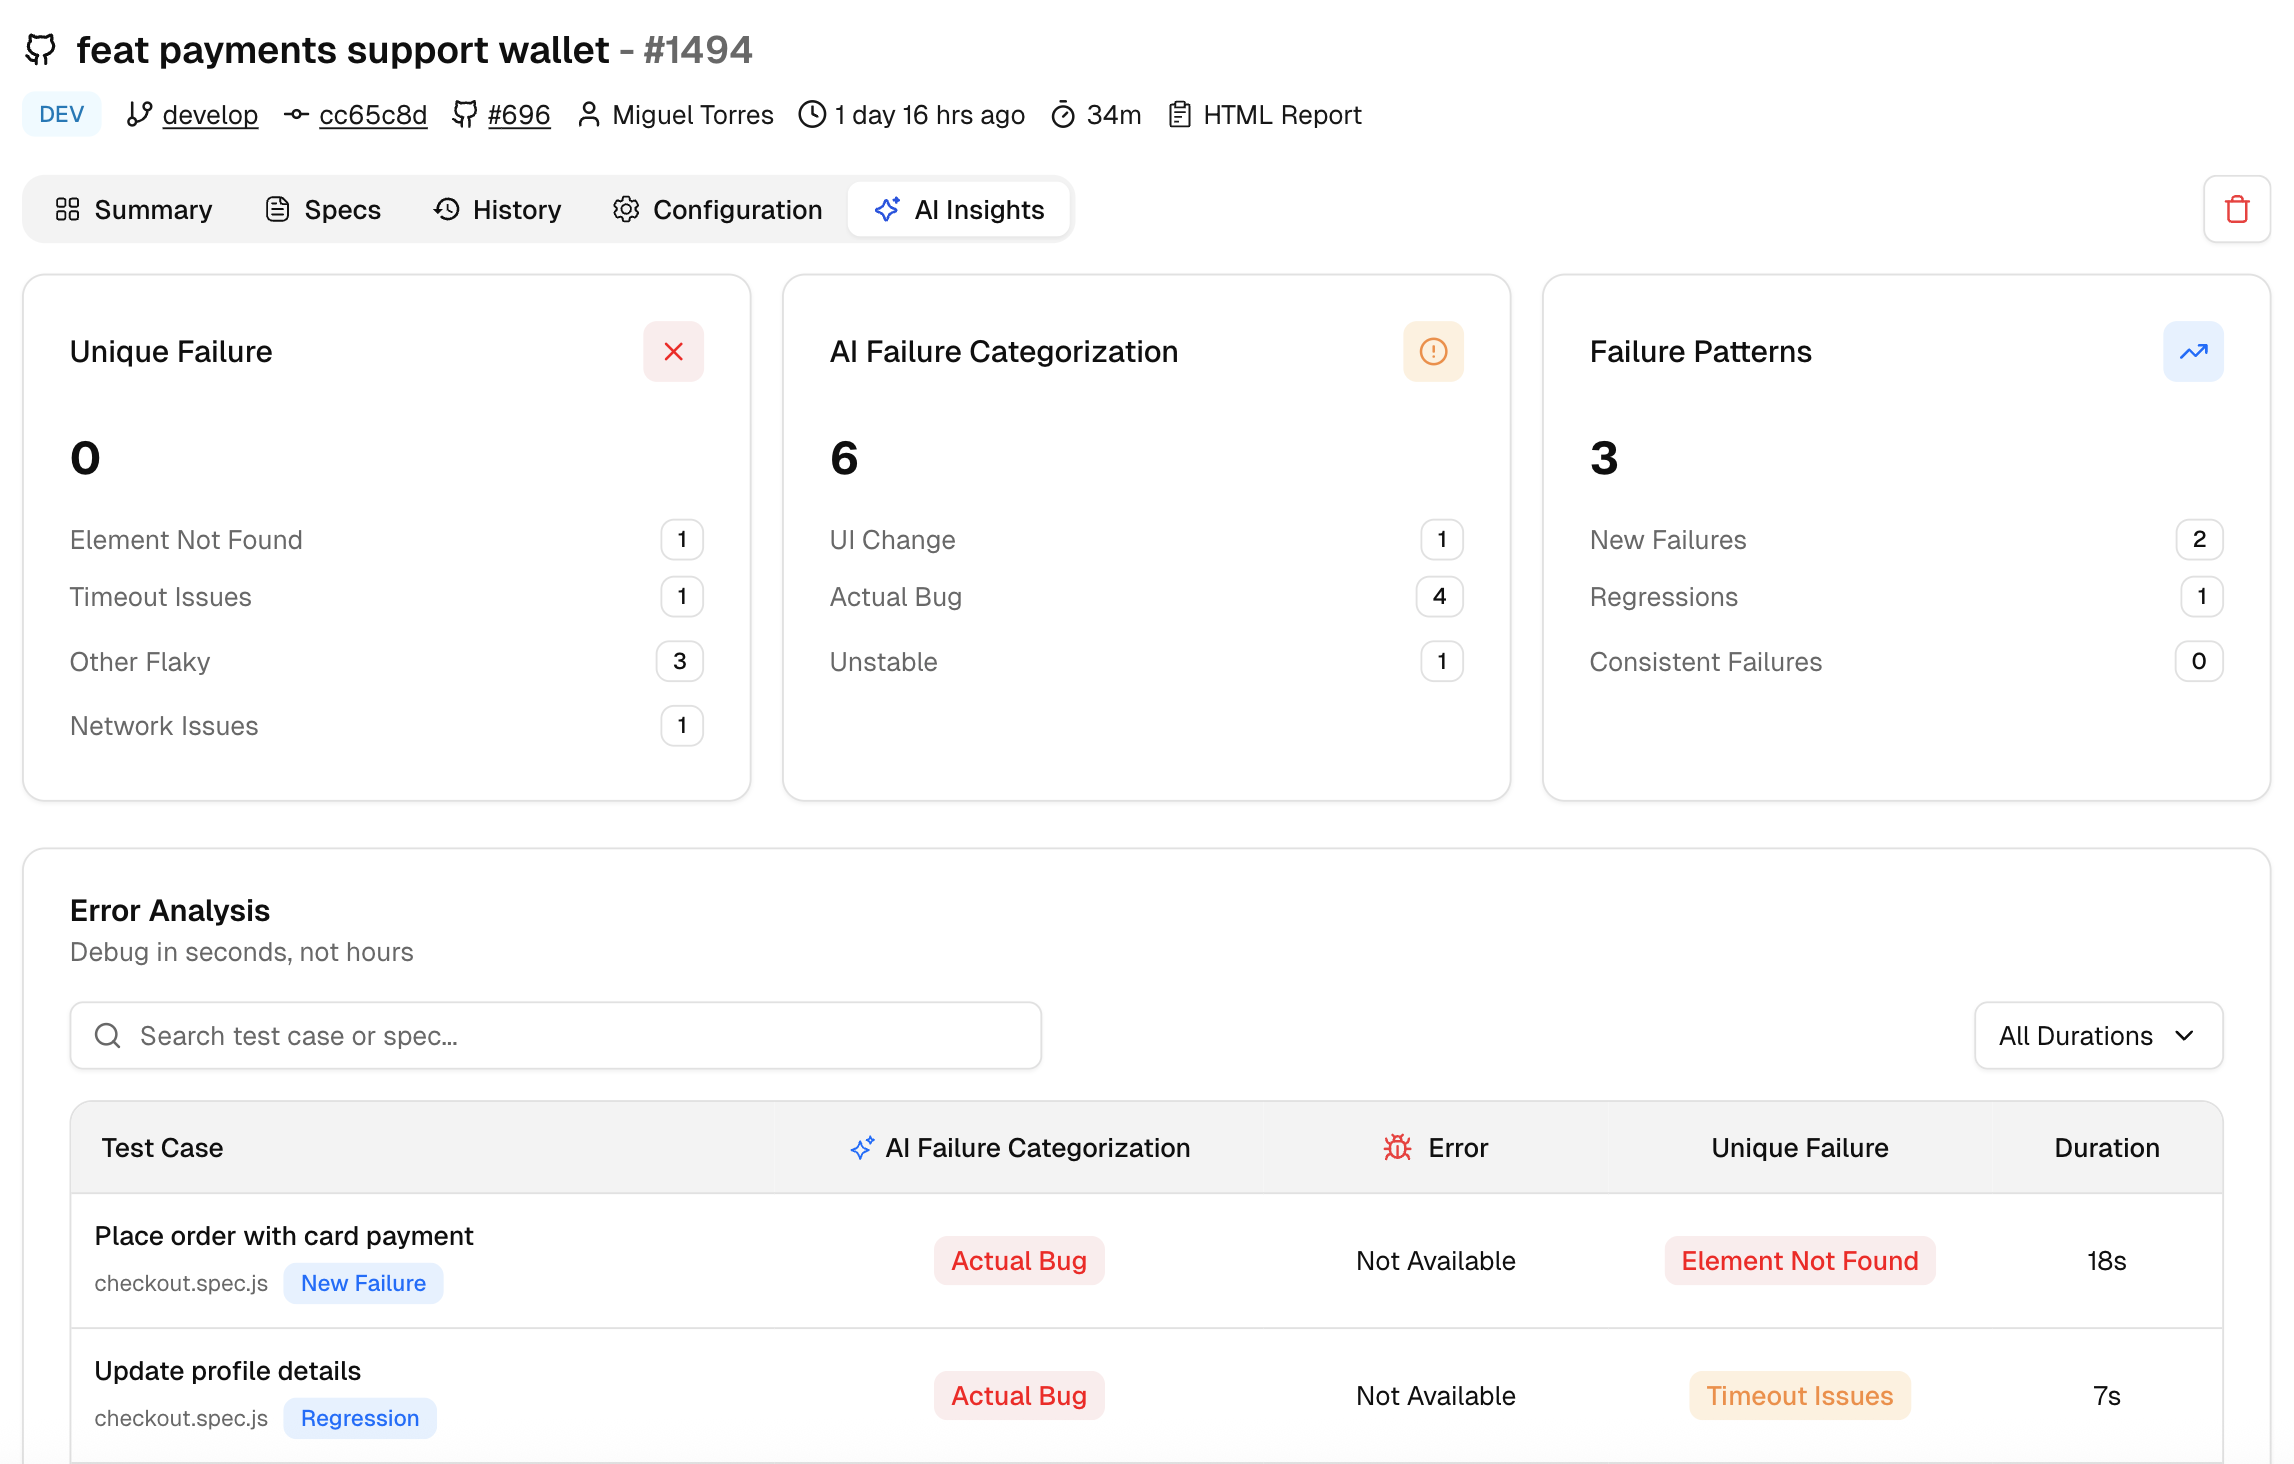
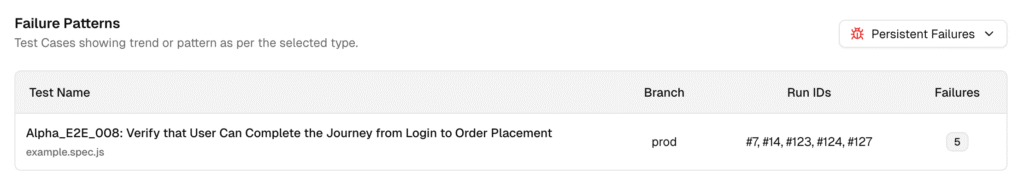
[image_caption caption="AI Insights"]
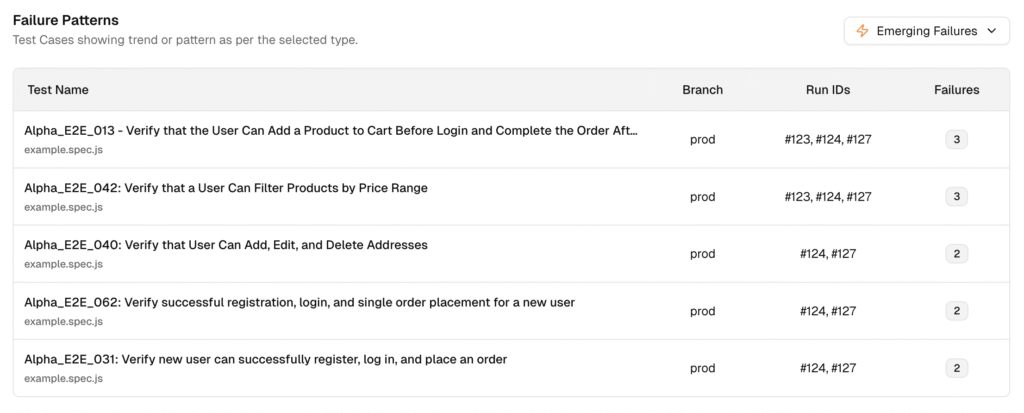
- Persistent Failures: The tests that are failing across many runs.
- Emerging Failures: These tests just started failing recently.
Now your team can prioritize what to fix first, tackle the emerging issues to catch regressions early, and chip away at the persistent ones to improve overall stability.
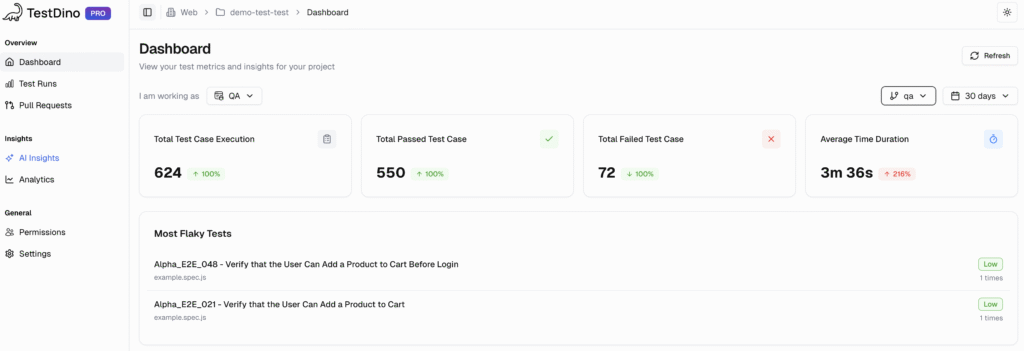
Making Reporting Collaborative for the Whole Team
A reporting tool is only effective if it serves the entire team, from the engineer running the tests to the manager assessing release readiness. We built TestDino with collaboration at its core.
Our Dashboard shows you what you need to see based on your role.
- For QA Engineers: See which tests are passing, failing, or are unstable ("flaky"). This helps you decide what to fix first.
- For Developers: You'll quickly see the test results for your new code, so you know right away if something broke.
Furthermore, you can manage who sees what with granular Project Roles.
- Assign members as Admins, Editors, or Viewers. While stakeholders can have read-only access.
Key Metrics for Test Automation Success
Measuring the success of your test automation initiatives requires tracking the right metrics.
- Test Coverage reveals how much of your application is being tested, helping you spot gaps in your test suite.
- Pass/Fail Rates provide a quick snapshot of test outcomes, making it easier to monitor the health of your test automation.
- Test Execution Time helps teams optimize their testing strategies by identifying slow tests and improving efficiency.
- Defect Density measures the number of defects found per test run, offering insights into software quality and the effectiveness of your testing processes.
- Automation Rate tracks the proportion of automated tests versus manual tests, highlighting opportunities to further reduce manual effort.
By consistently monitoring these key metrics, teams can refine their testing strategies, reduce test failures, and drive continuous improvement in both test automation and overall project quality.
Best Practices for Test Automation Reporting
Creating effective test automation reports is about more than just collecting data; it’s about delivering actionable insights that drive better decisions.
To achieve this, teams should adopt best practices that ensure their test automation reports are comprehensive, accurate, and easy to use.
- Start by using a standardized reporting template that includes detailed test results, test coverage, and pass/fail rates.
- This consistency makes it easier to compare results across test runs and identify trends.
- Ensure that your reports are easily accessible and customizable, so stakeholders can focus on the information most relevant to them.
- Integration with other testing tools and frameworks is also crucial, enabling seamless data flow and reducing manual effort.
Common Challenges and How to Overcome Them
Problem: Flaky tests, too much manual effort, and inconsistent reports
- These issues often hide what's really happening in your tests, making your reports less useful.
Solution: Focus on the right data & deep analysis
- Customizable reports: Let your team see only the data that matters most to them.
- Test analytics and error logs: These tools help you spot trends and uncover the real reasons why tests fail.
By tackling these challenges directly, your test reports become a strong tool. They help your team deliver better software with more confidence.
Conclusion
You just can’t treat test automation reporting as an afterthought anymore.
A great reporting strategy should provide fast feedback loops, deep insights, and a collaborative foundation that engineering teams need to build better software, faster.
We've built the platform that I wish I had leading my own engineering teams. TestDino is designed to bring clarity to complex problems, separate signals from noise, and provide confidence in every release. Now, easily make data-driven decisions about your product's quality.
Ready to revamp your test reporting? Start your free TestDino trial and see the difference for yourself.
FAQs
Use the QA Dashboard and AI Insights to surface high-priority issues. TestDino ranks and groups failures so you can act first on what matters.
-
- AI categories: Every failure is auto-tagged as Actual Bug, UI Change, Unstable Test, or Miscellaneous with a confidence score.
- Impact context: See affected PRs/branches, failure count, duration impact, and retry outcomes to judge blast radius.
Fast path: QA Dashboard → AI Insights → open the top “Actual Bug” or “Persistent” group → review evidence → create ticket.

Vishwas Tiwari
Software Engineer