Test intelligence platform for modern teams

Playwright reporting that helps you interpret failures, flakiness, and test patterns with clear evidence and insights so you understand what your tests really mean.

User

Pratik Patel

Dec 30, 2025

Test intelligence platform for modern teams

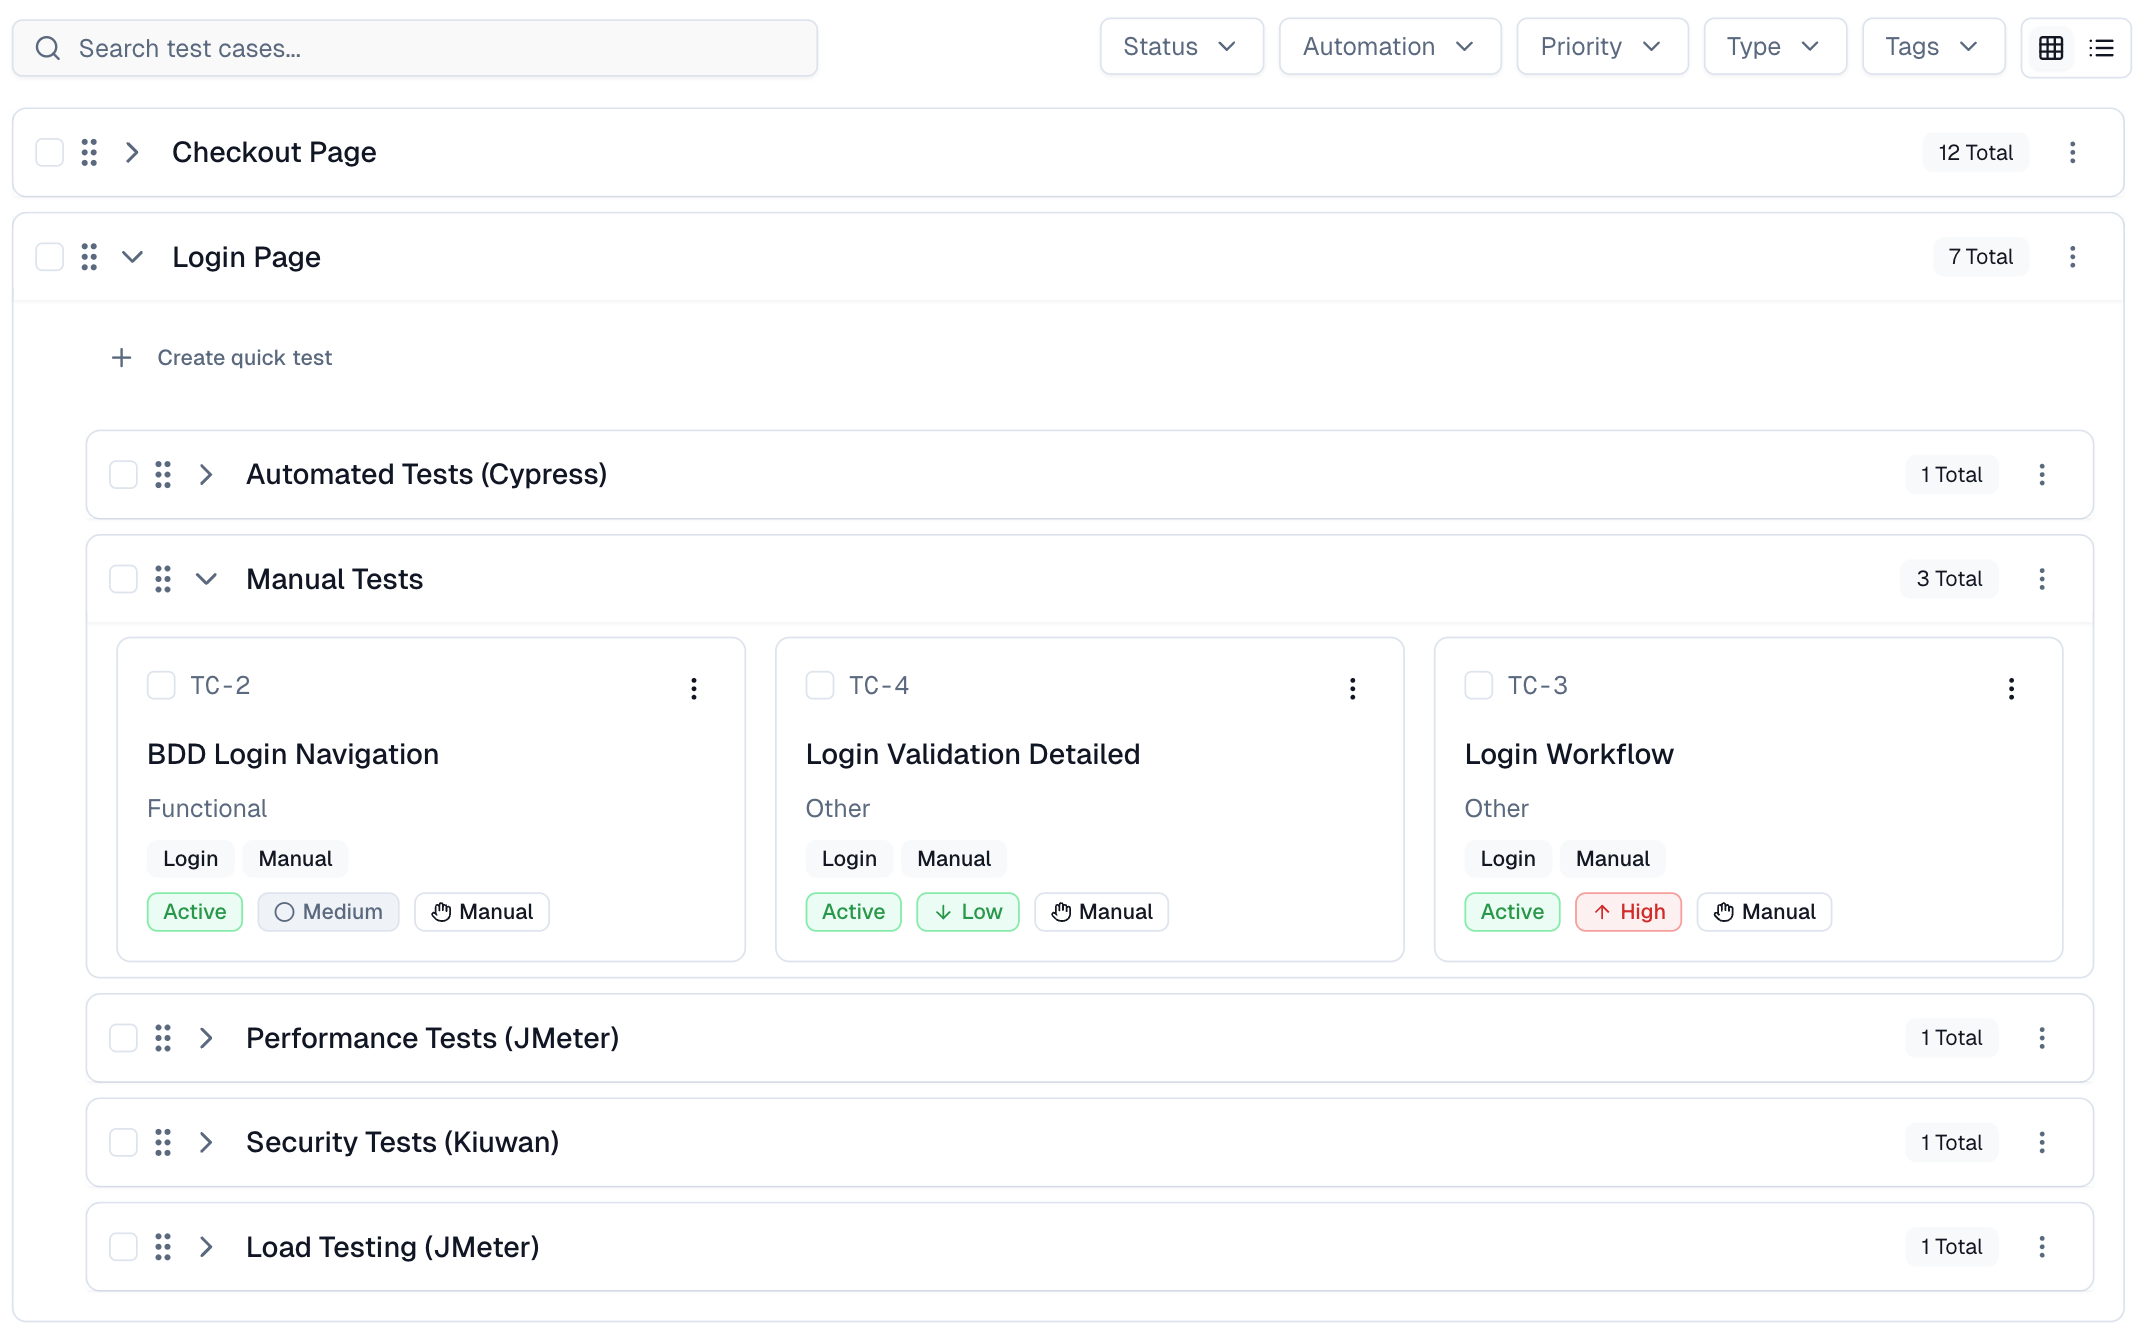
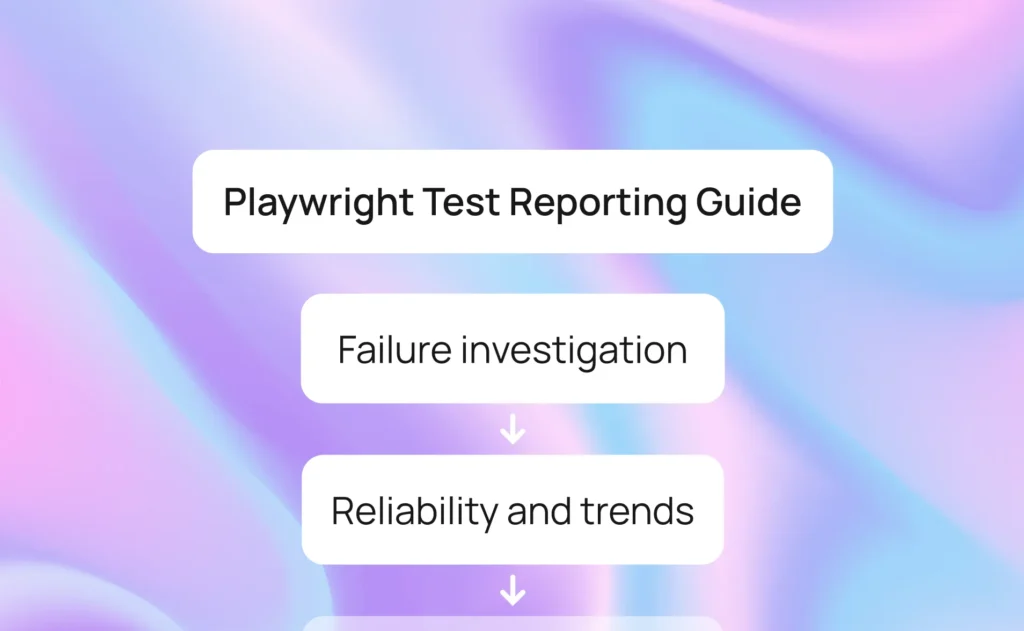
Running automated tests is easy. Understanding them is not.

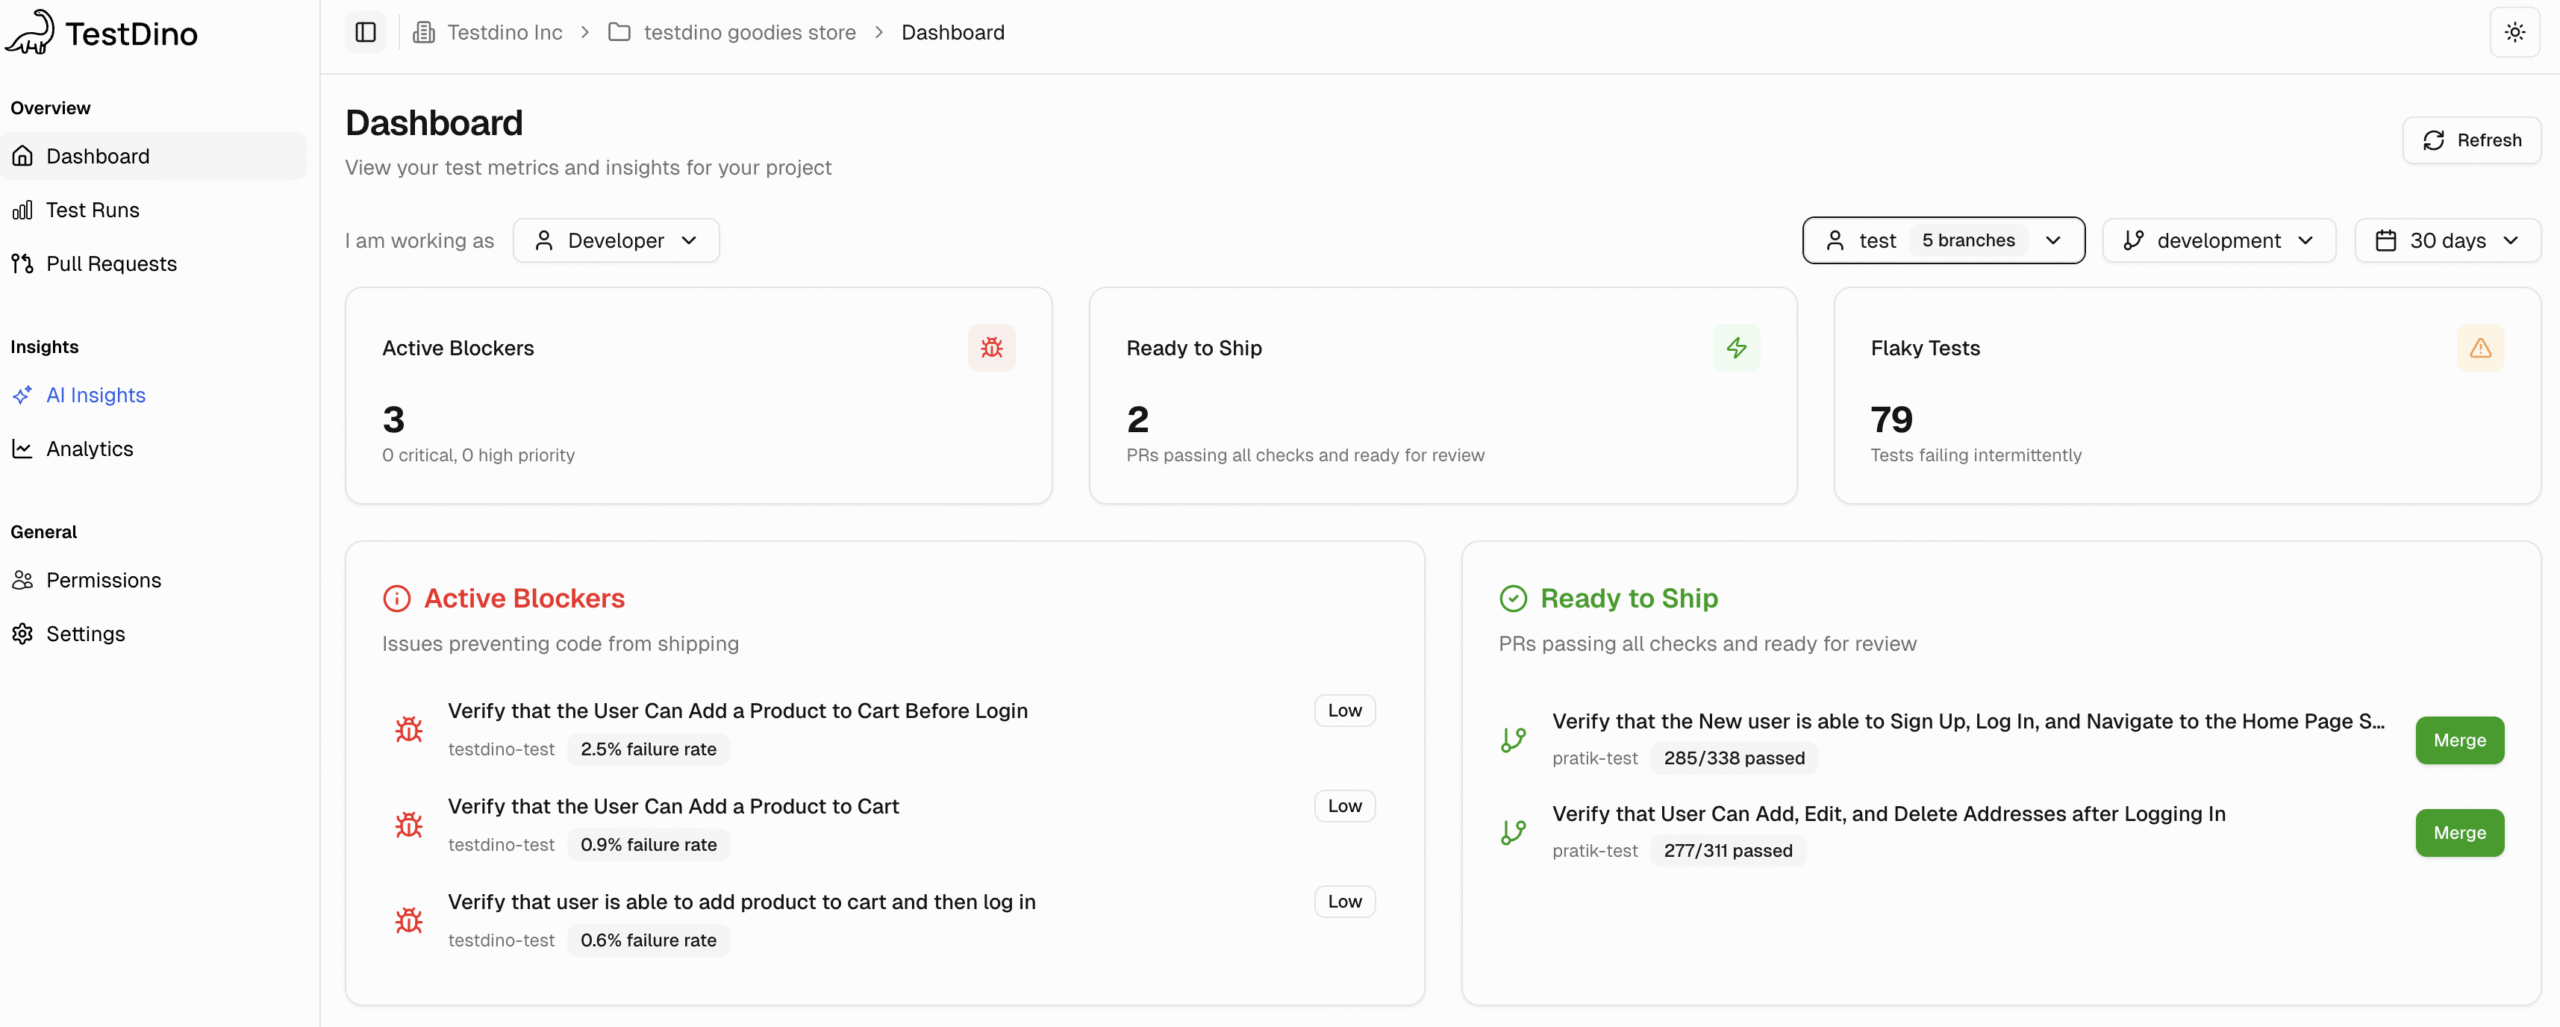
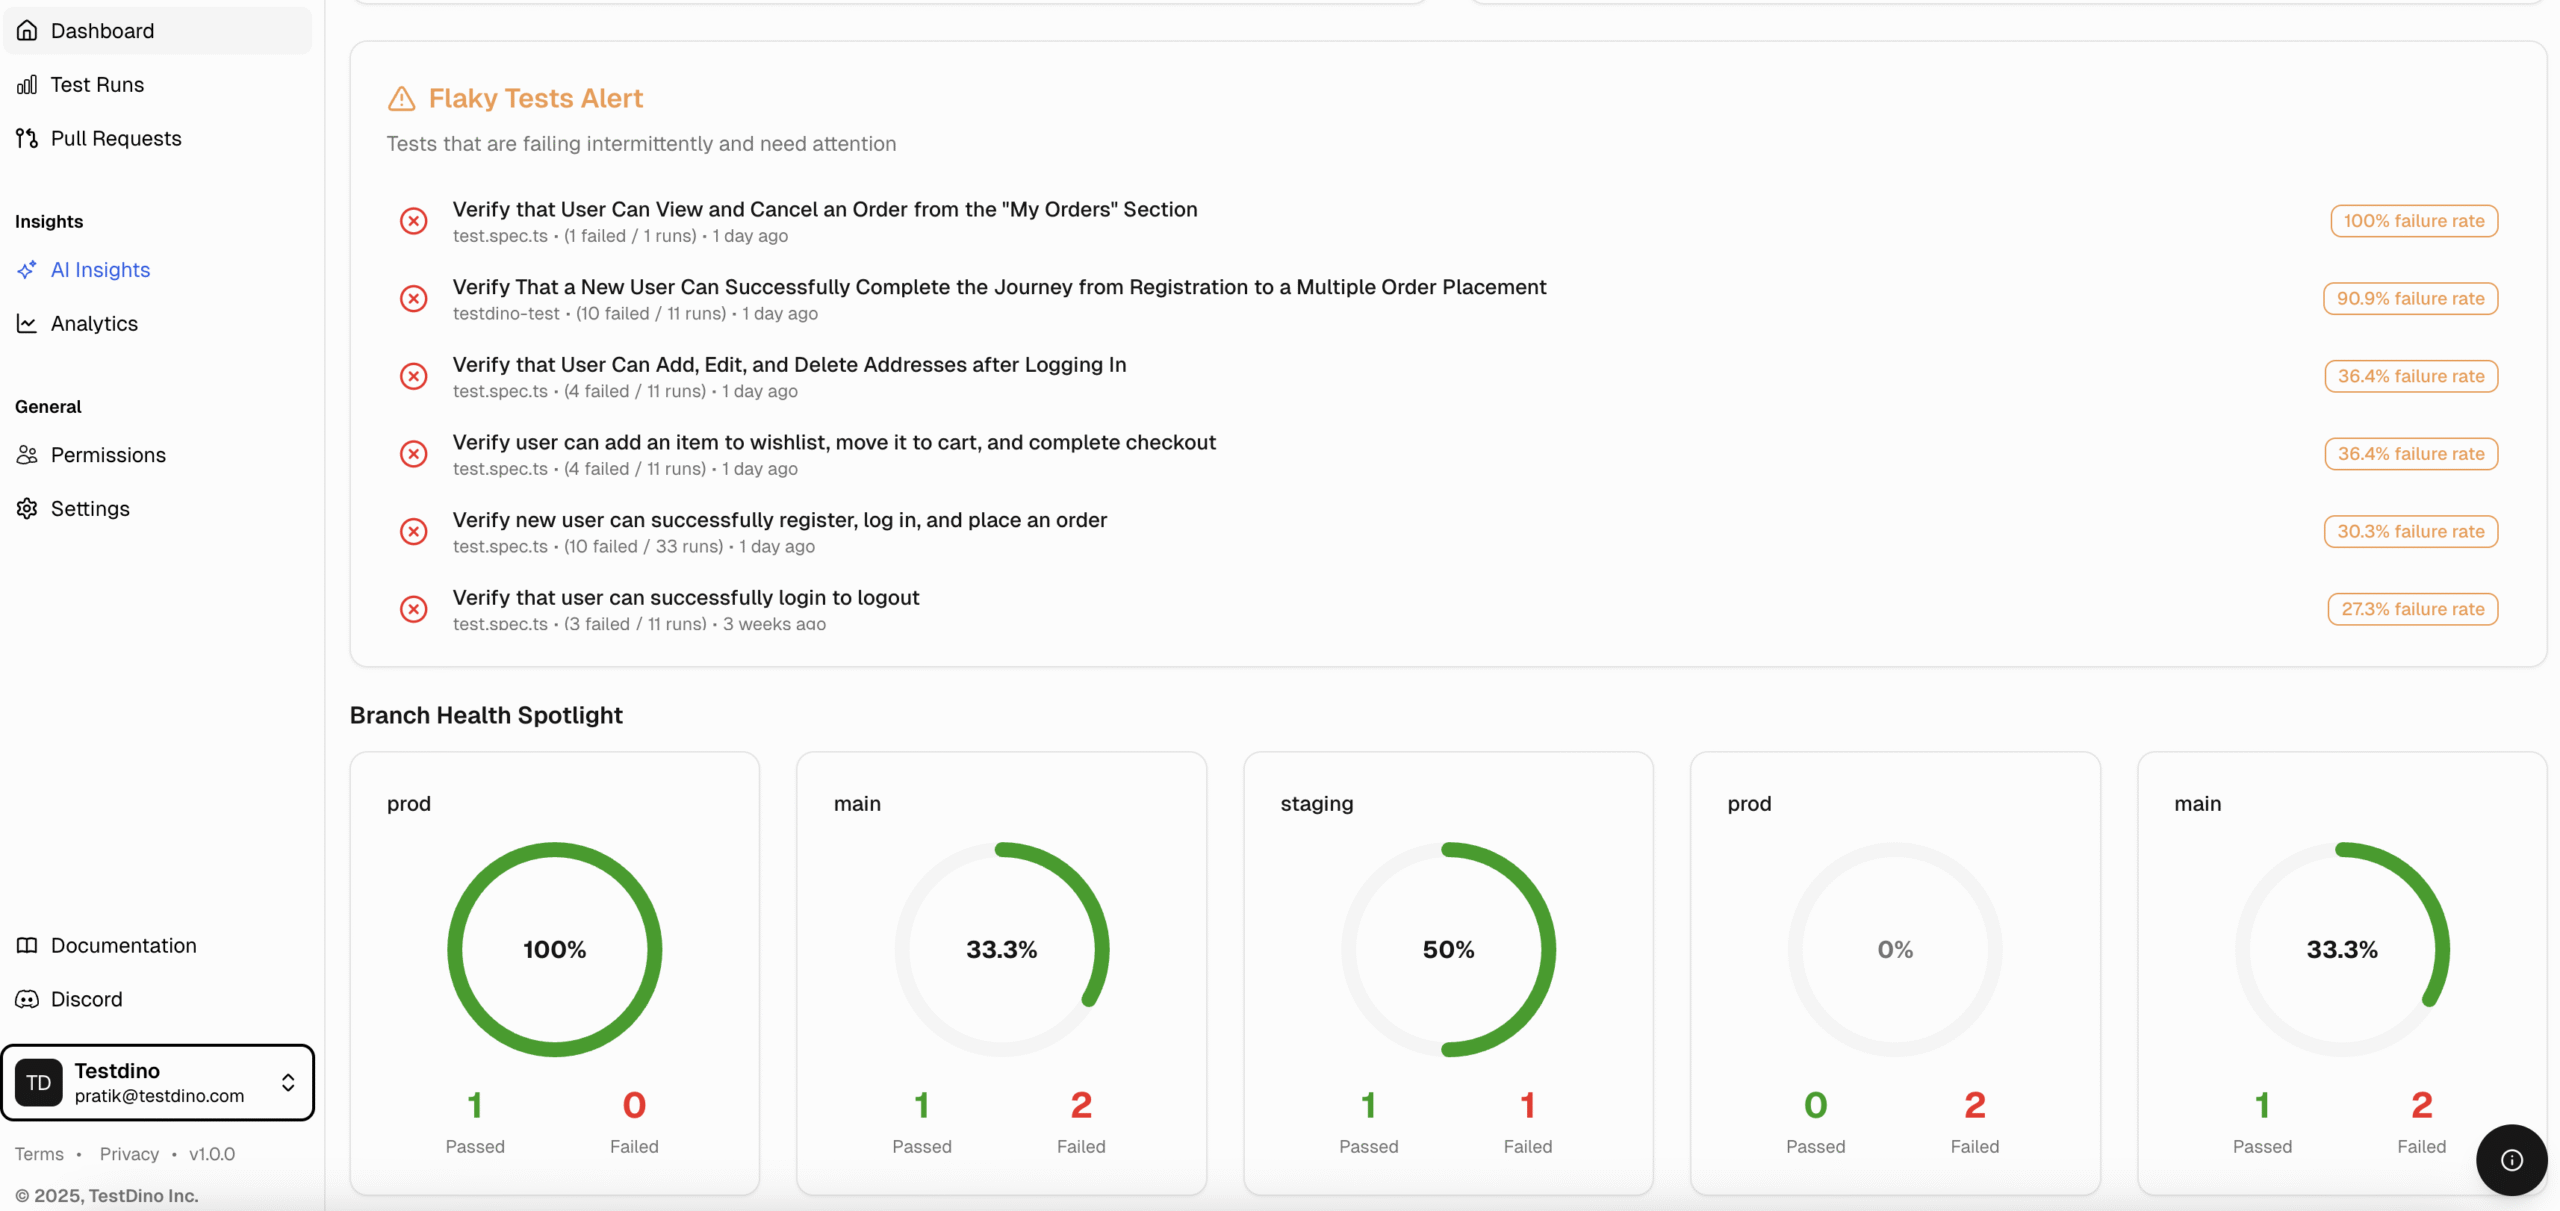
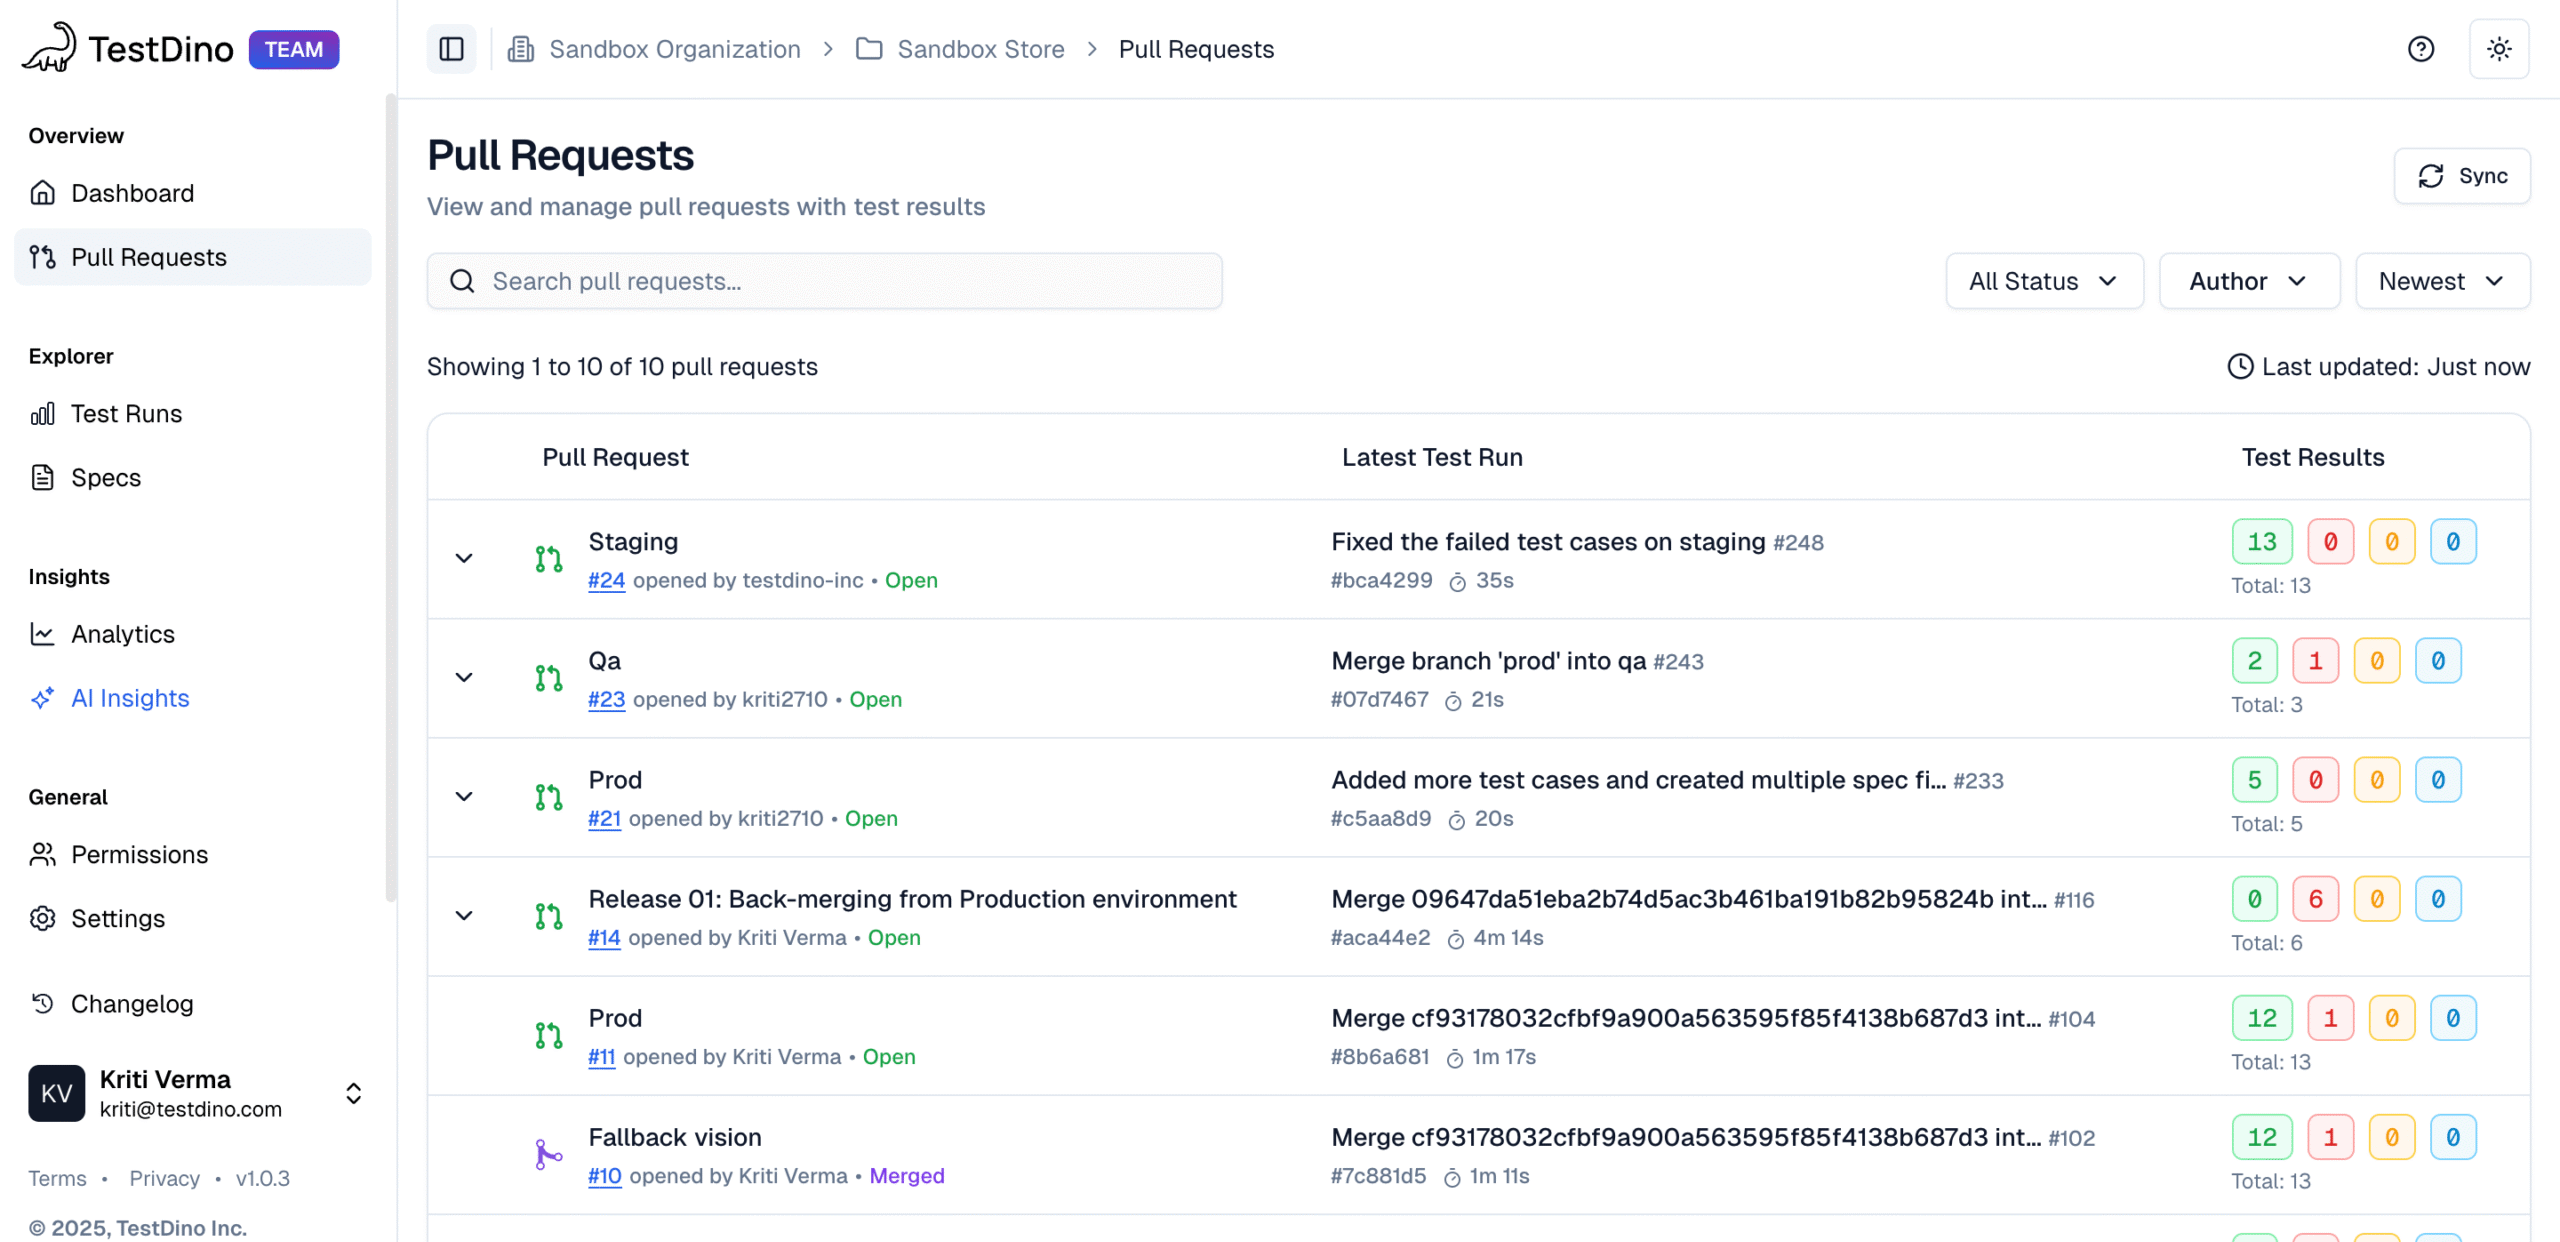
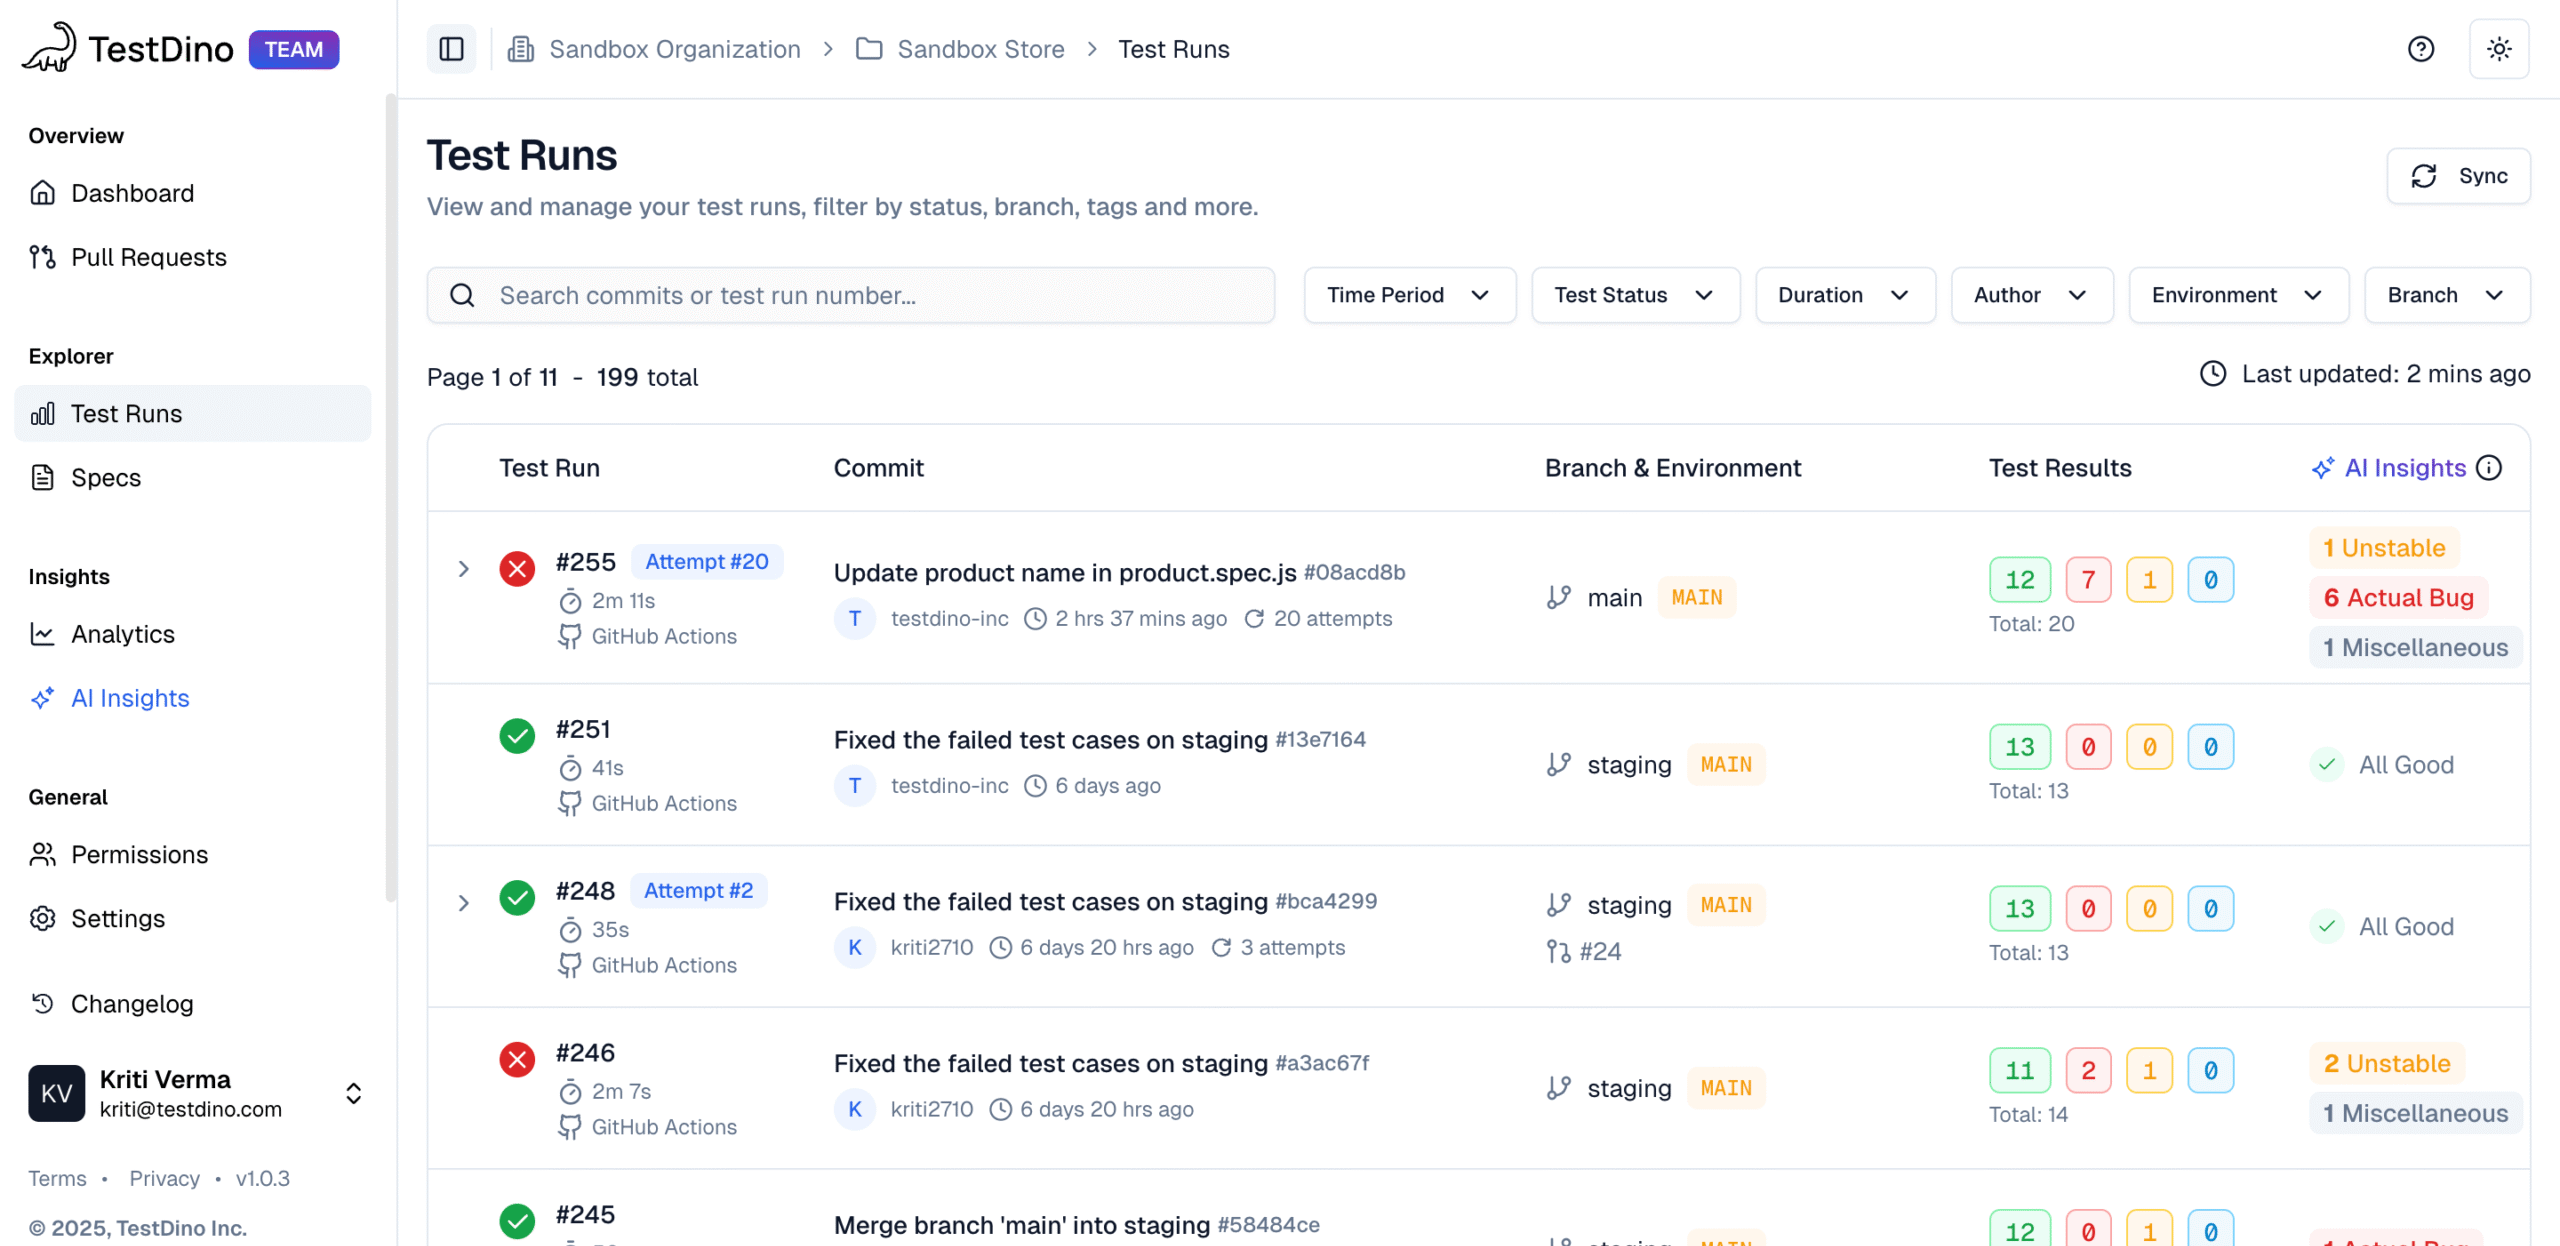
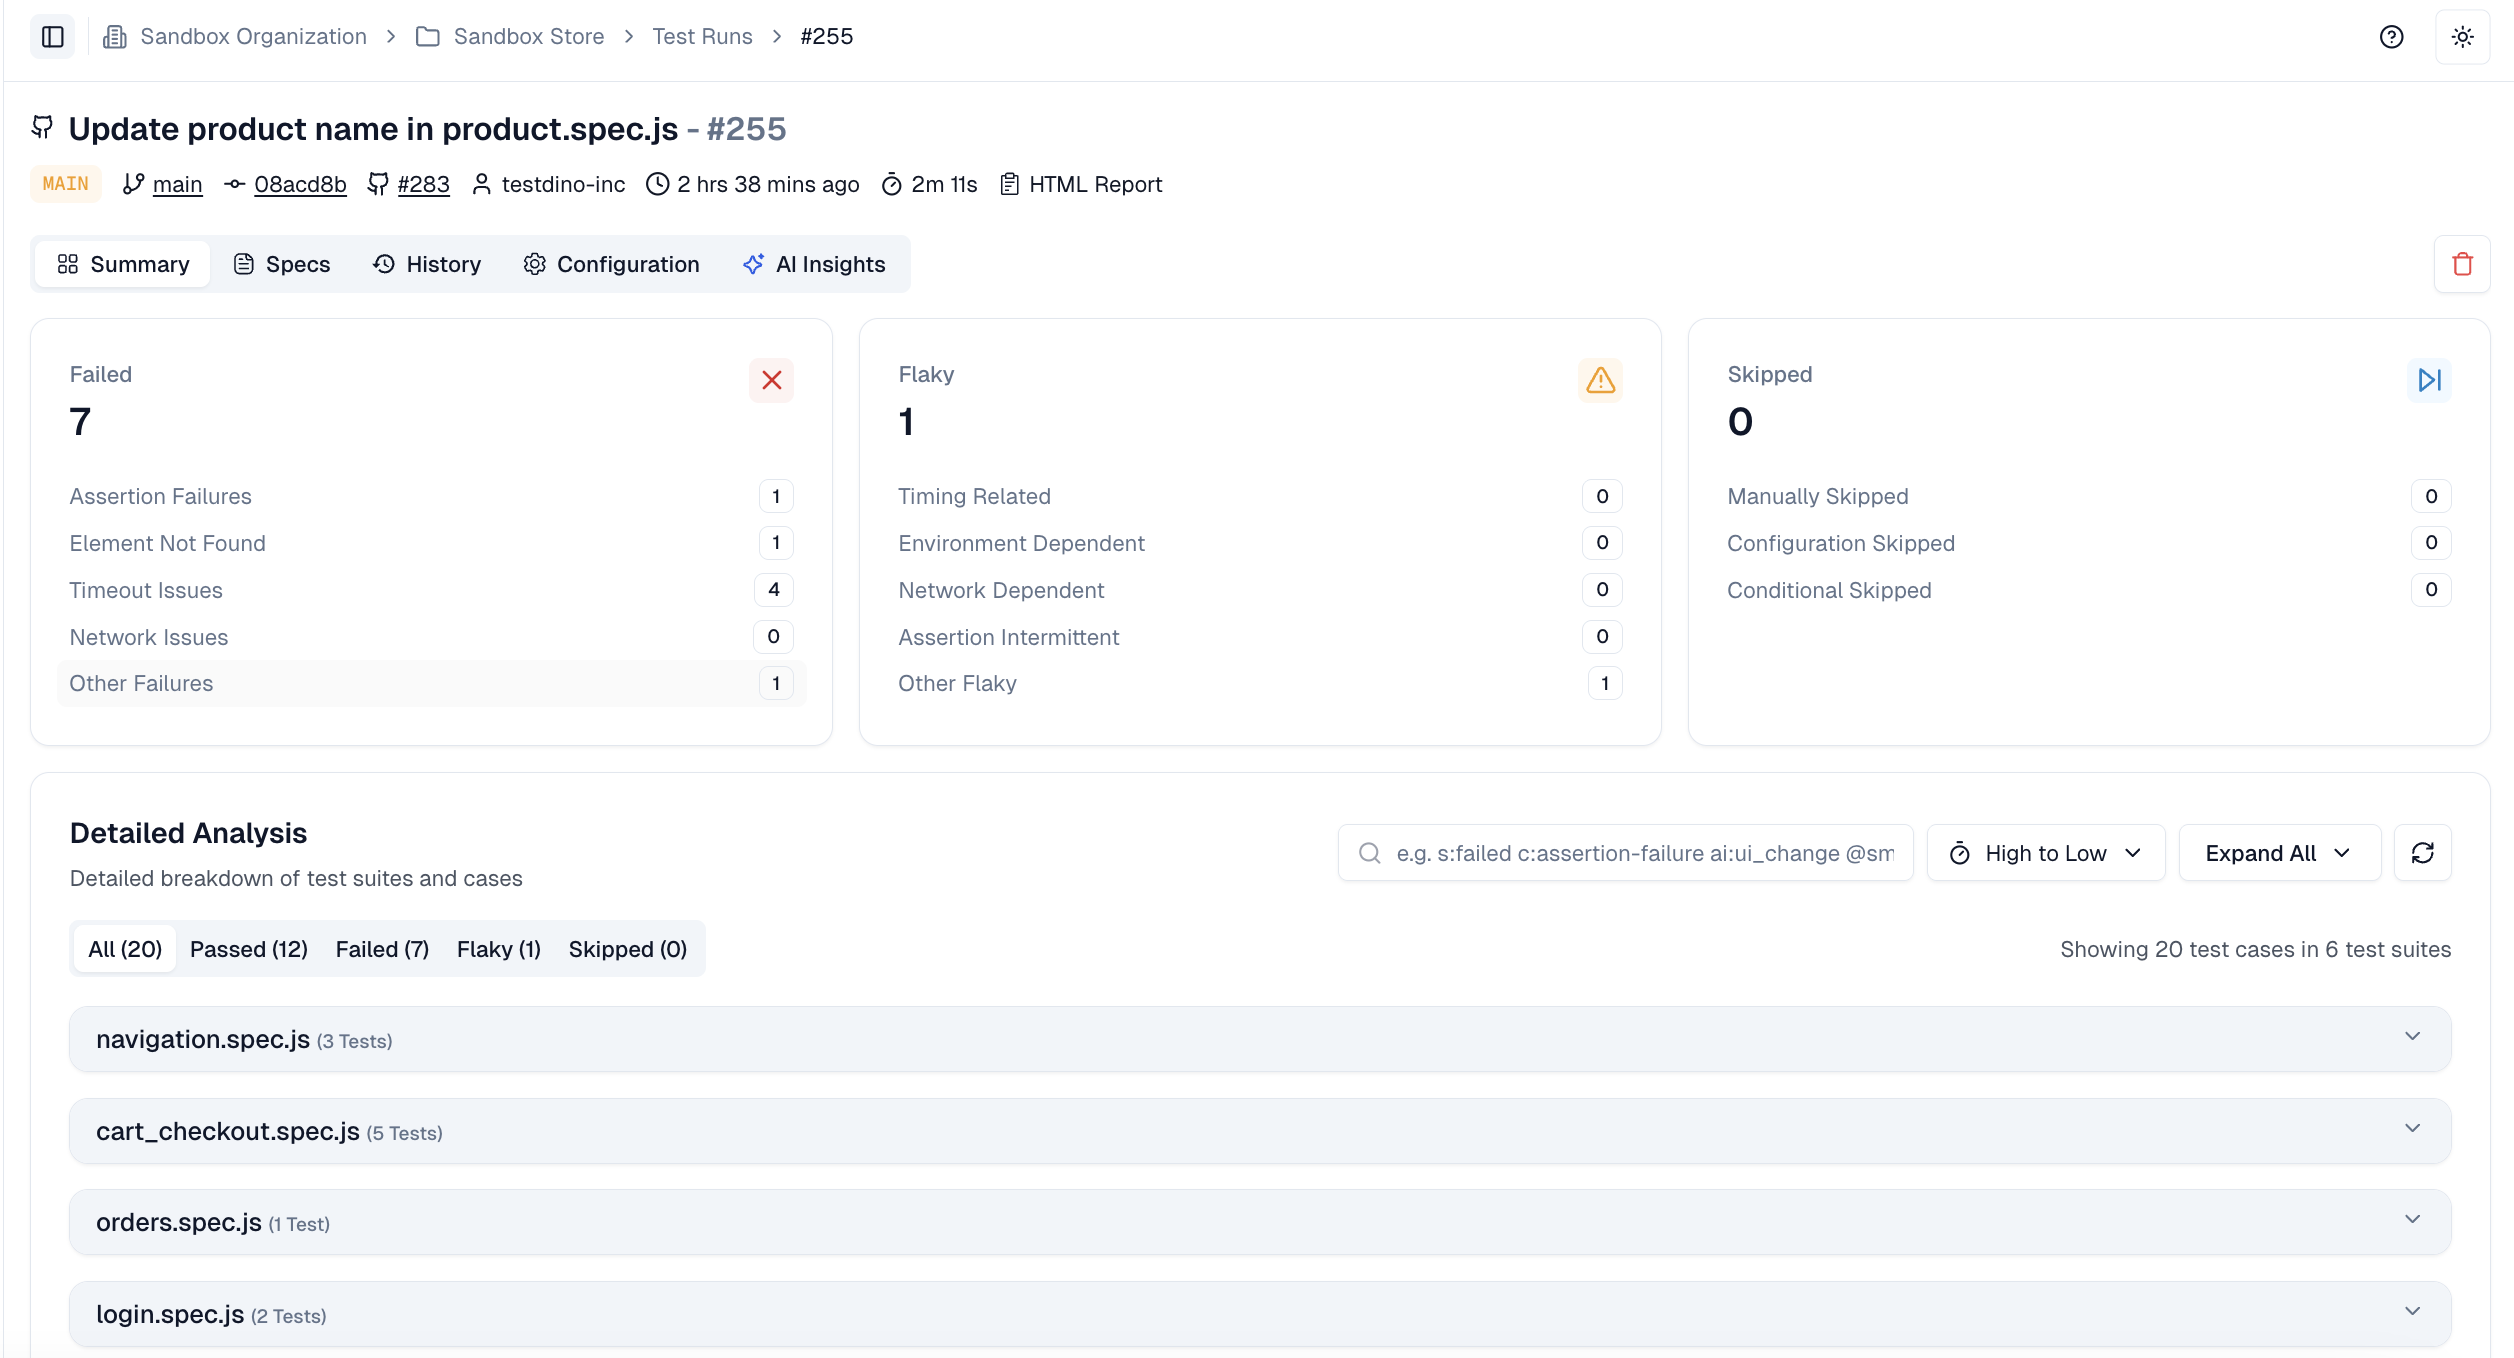
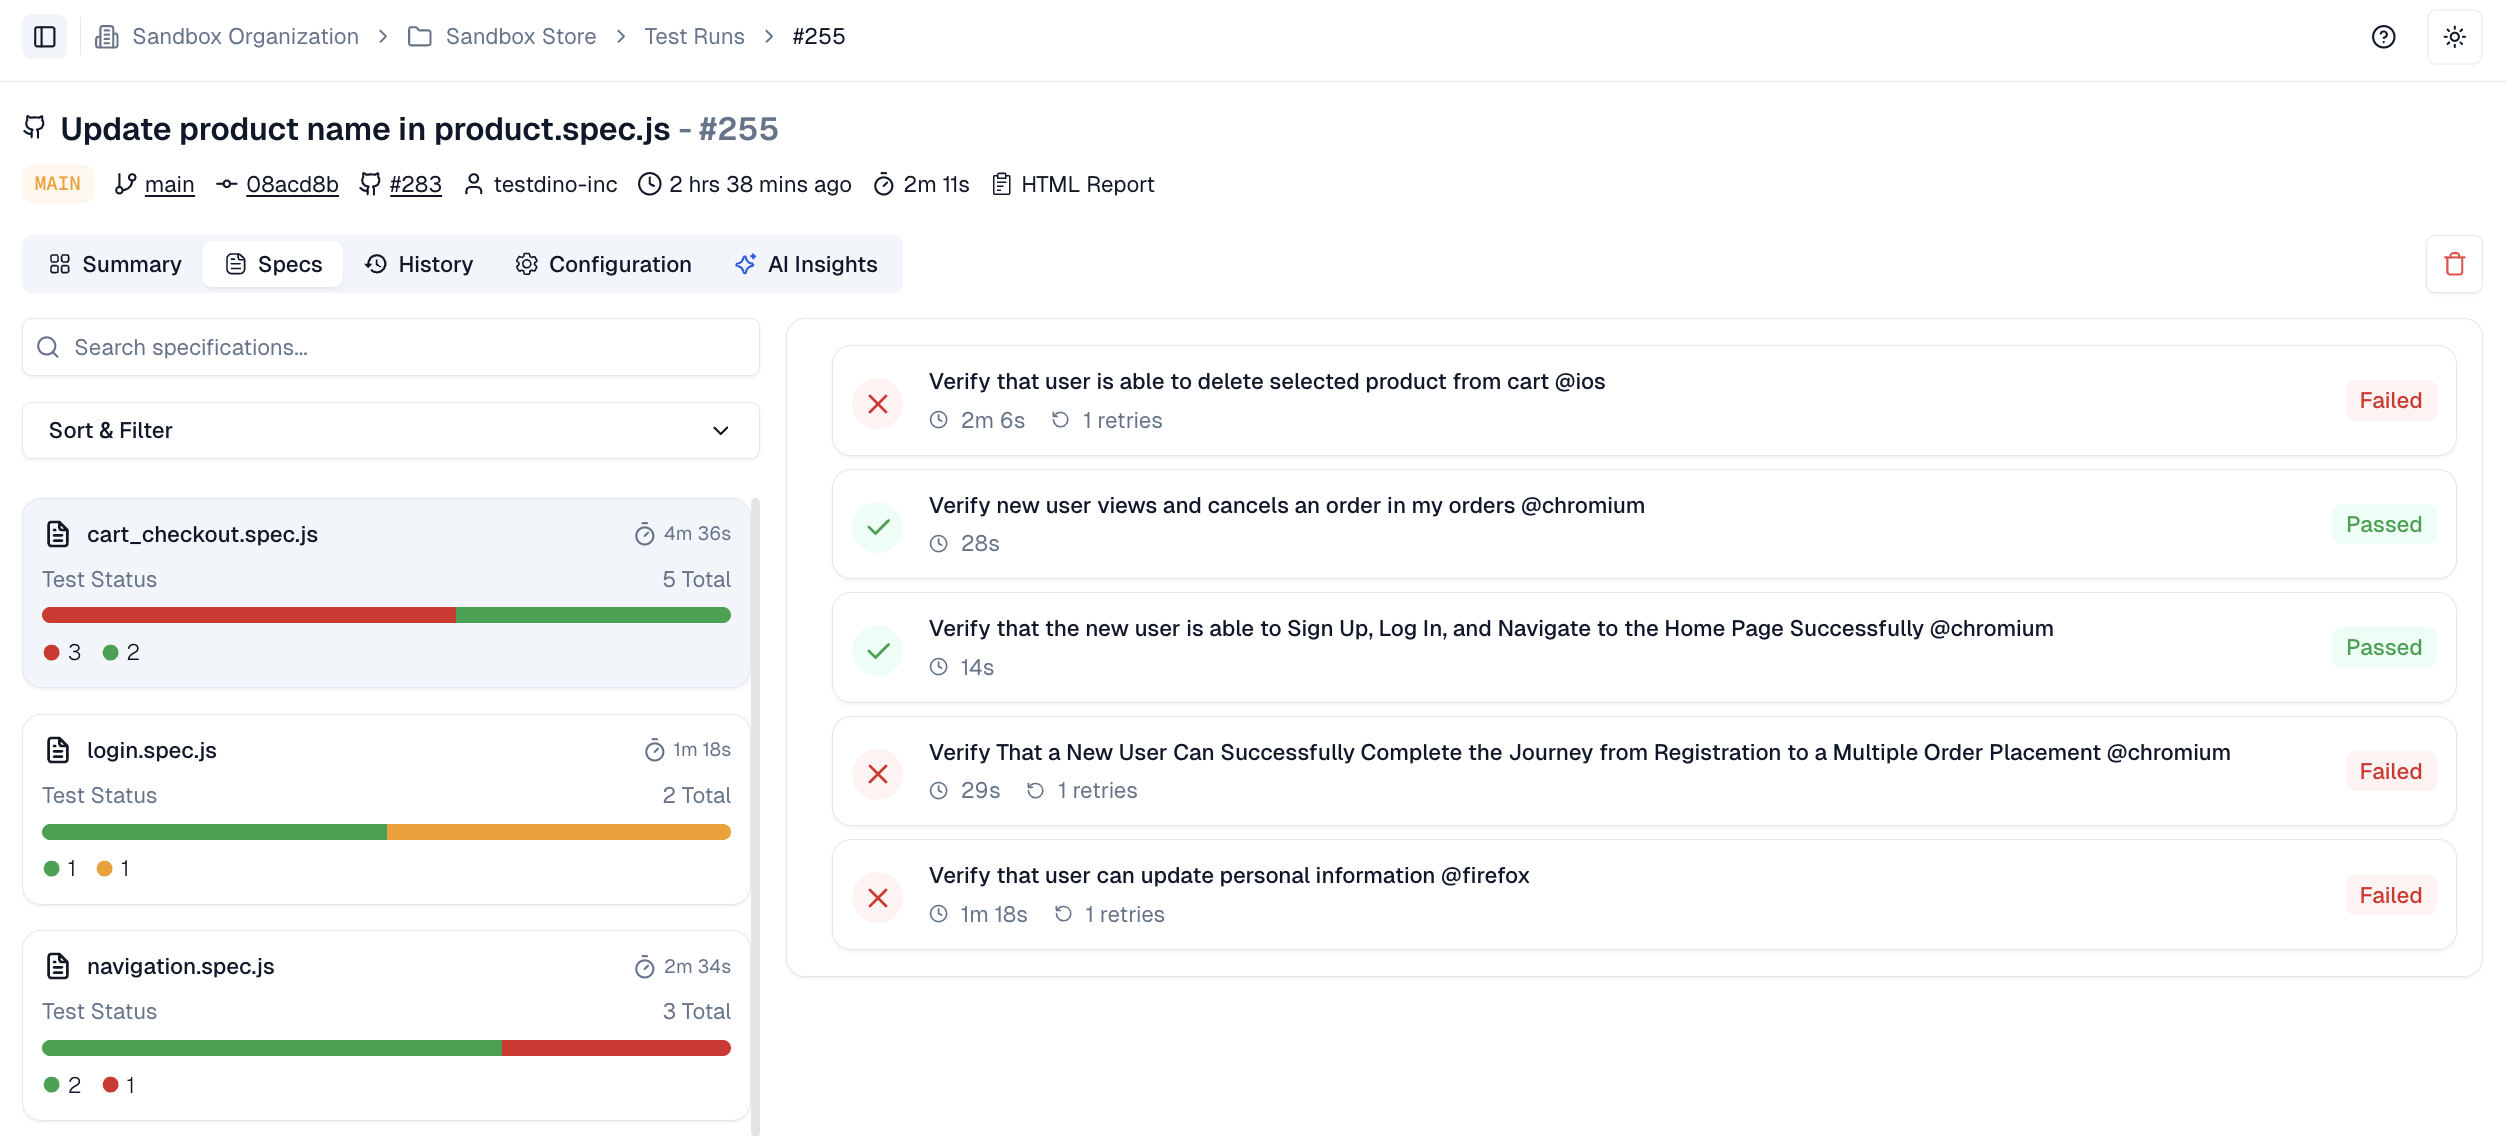
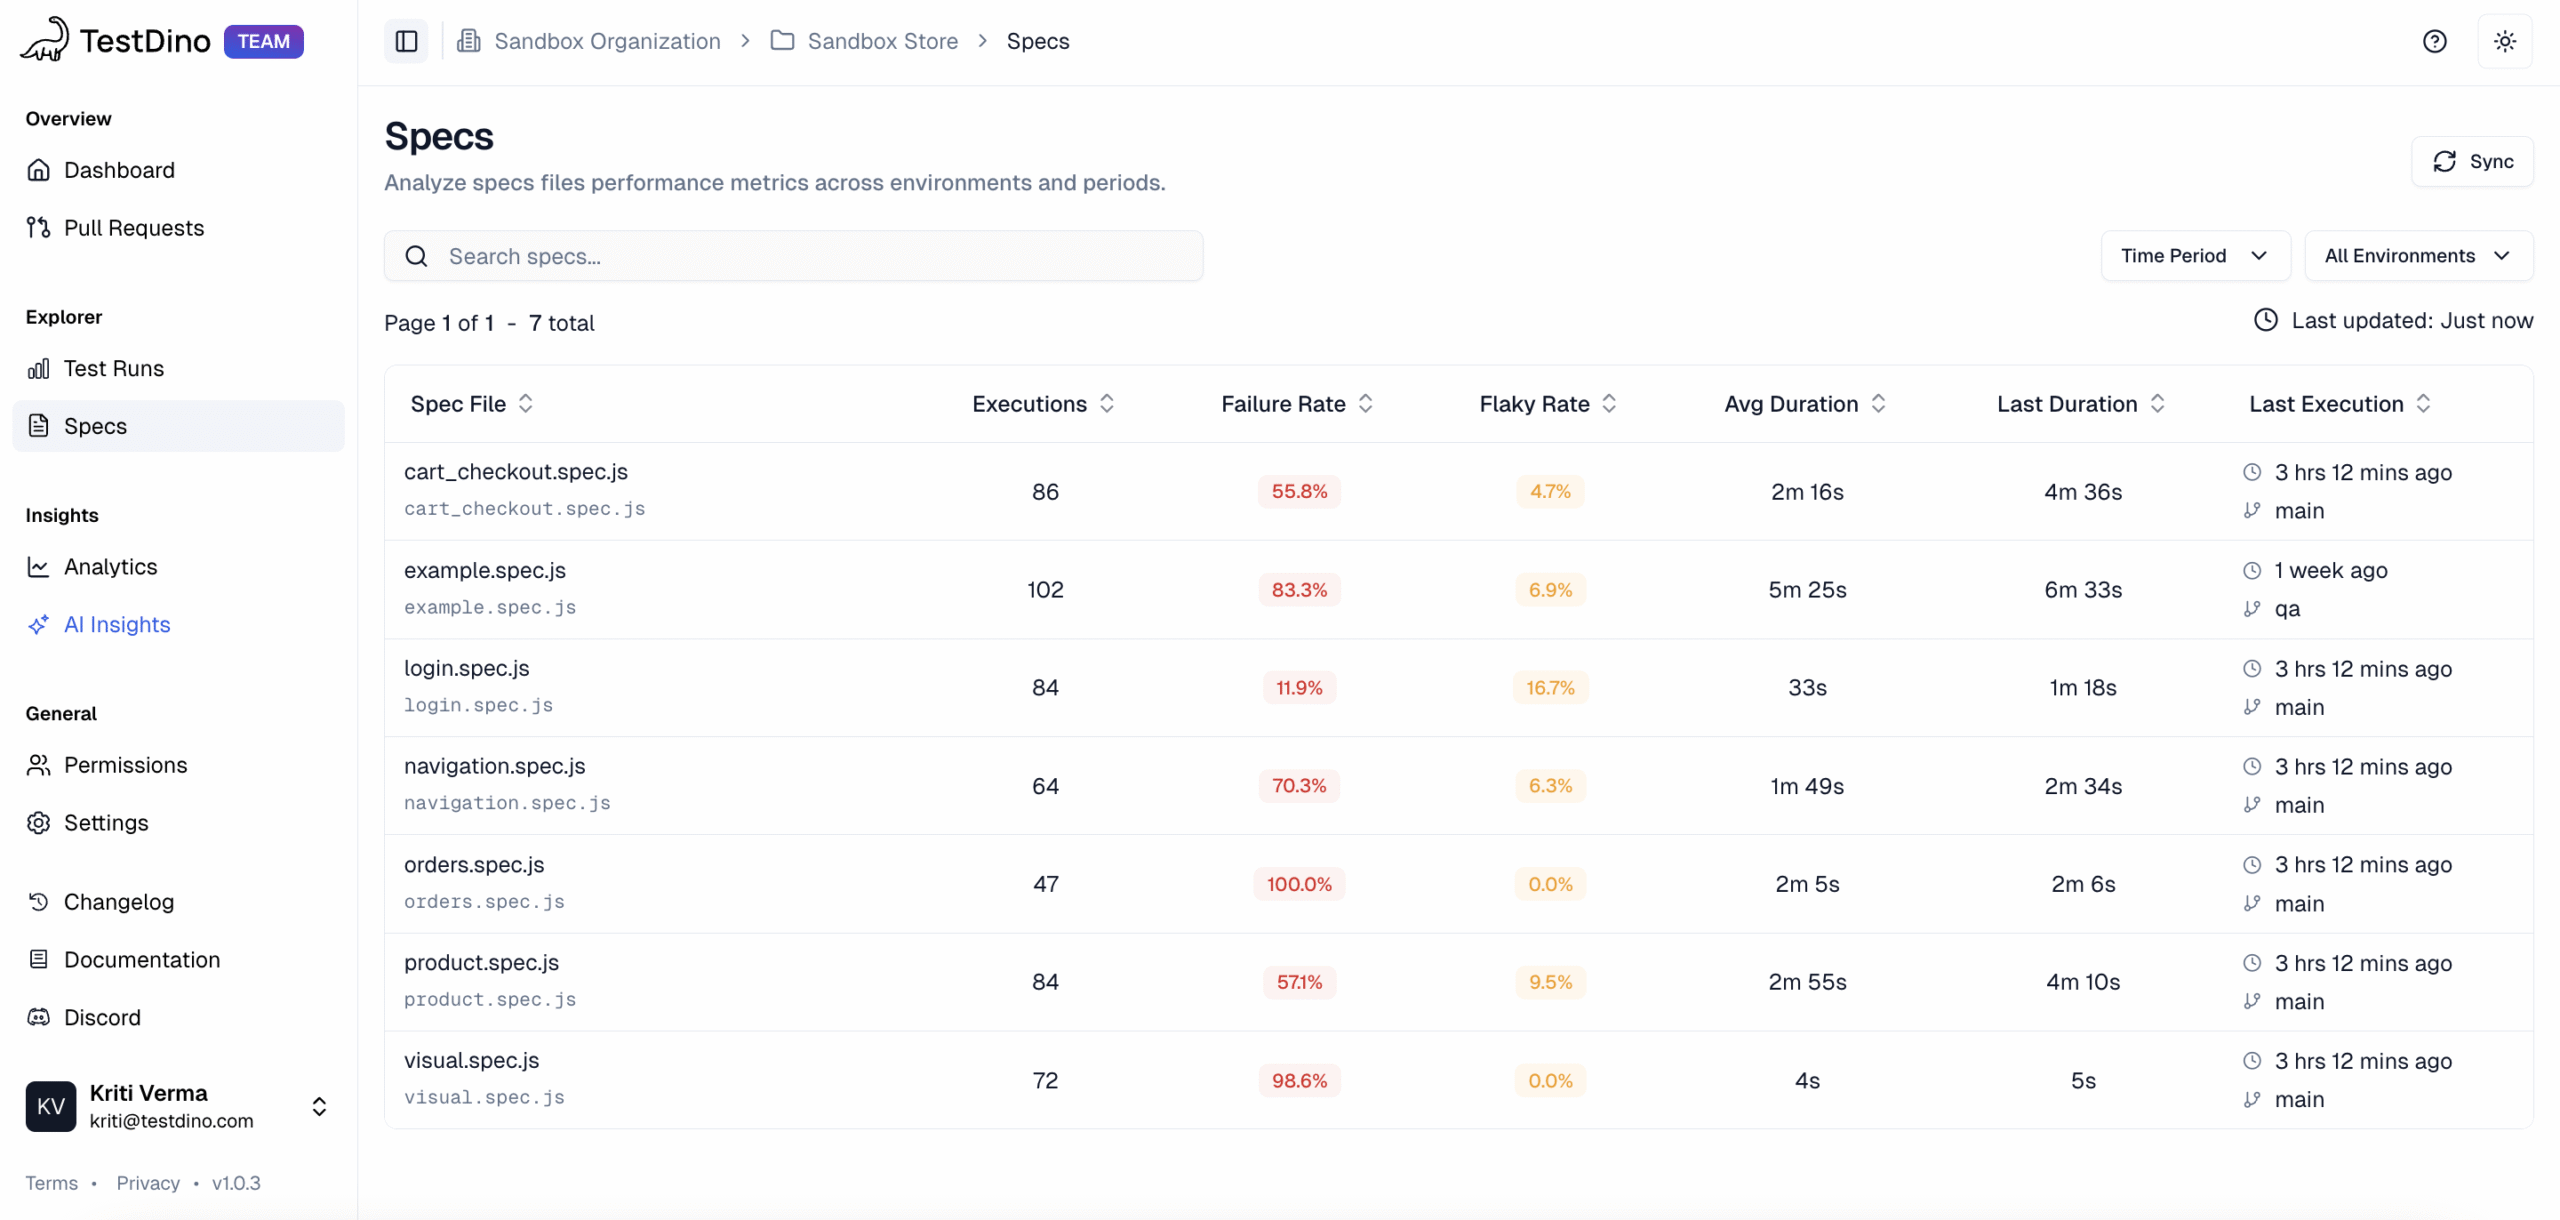
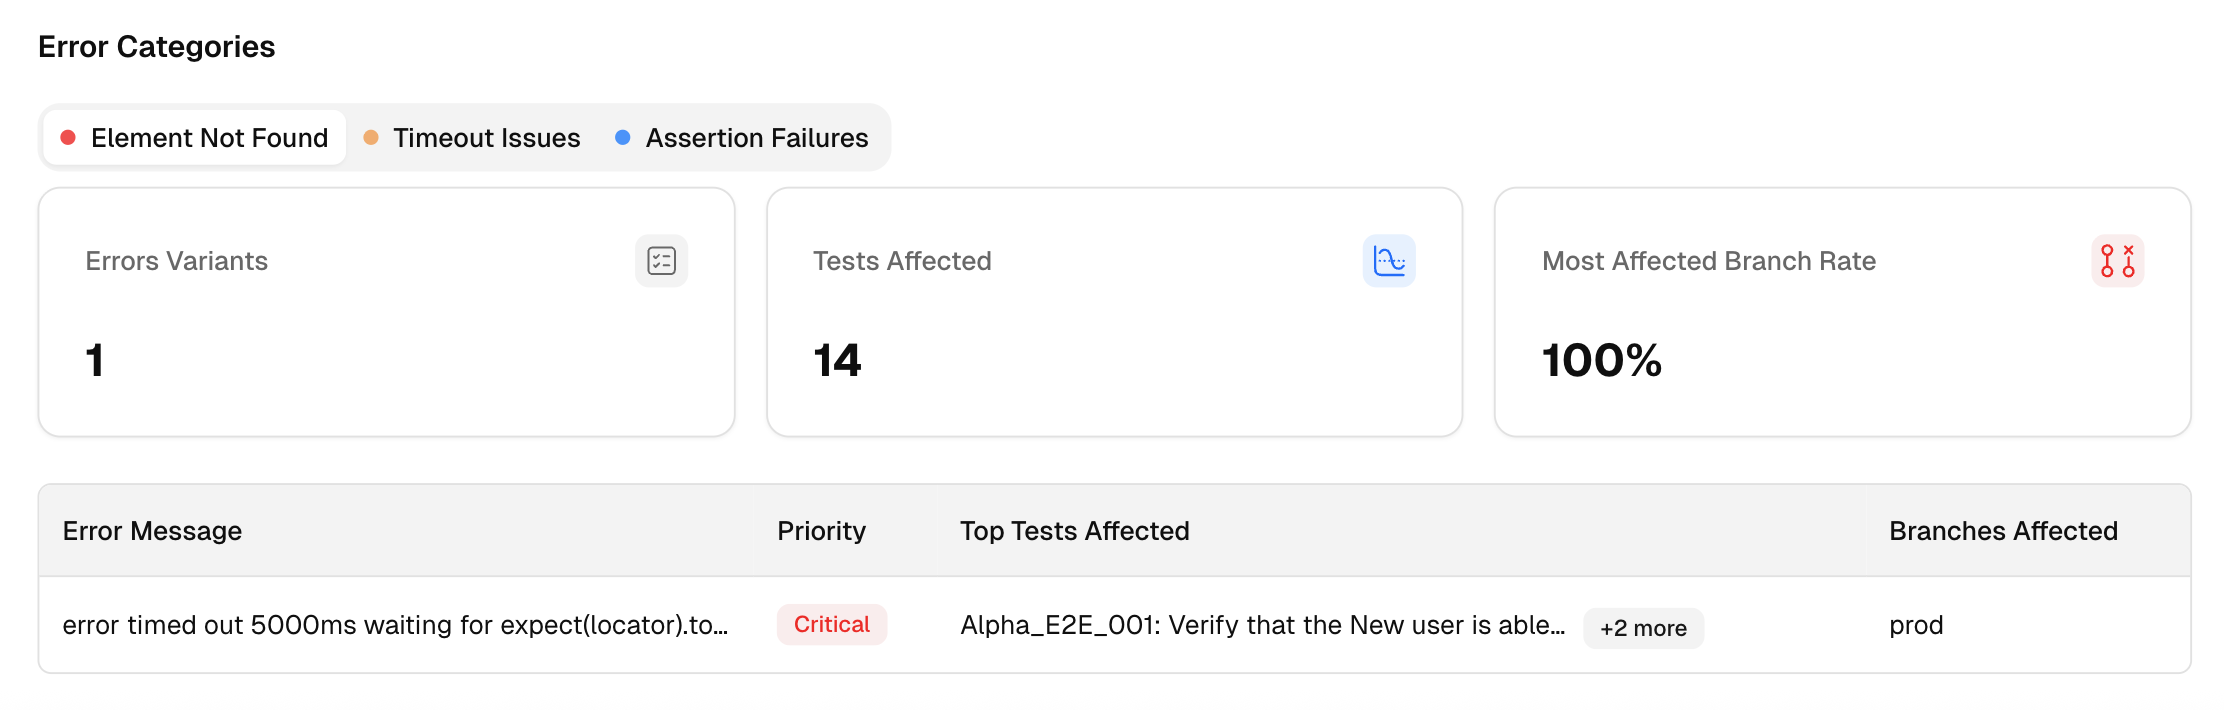
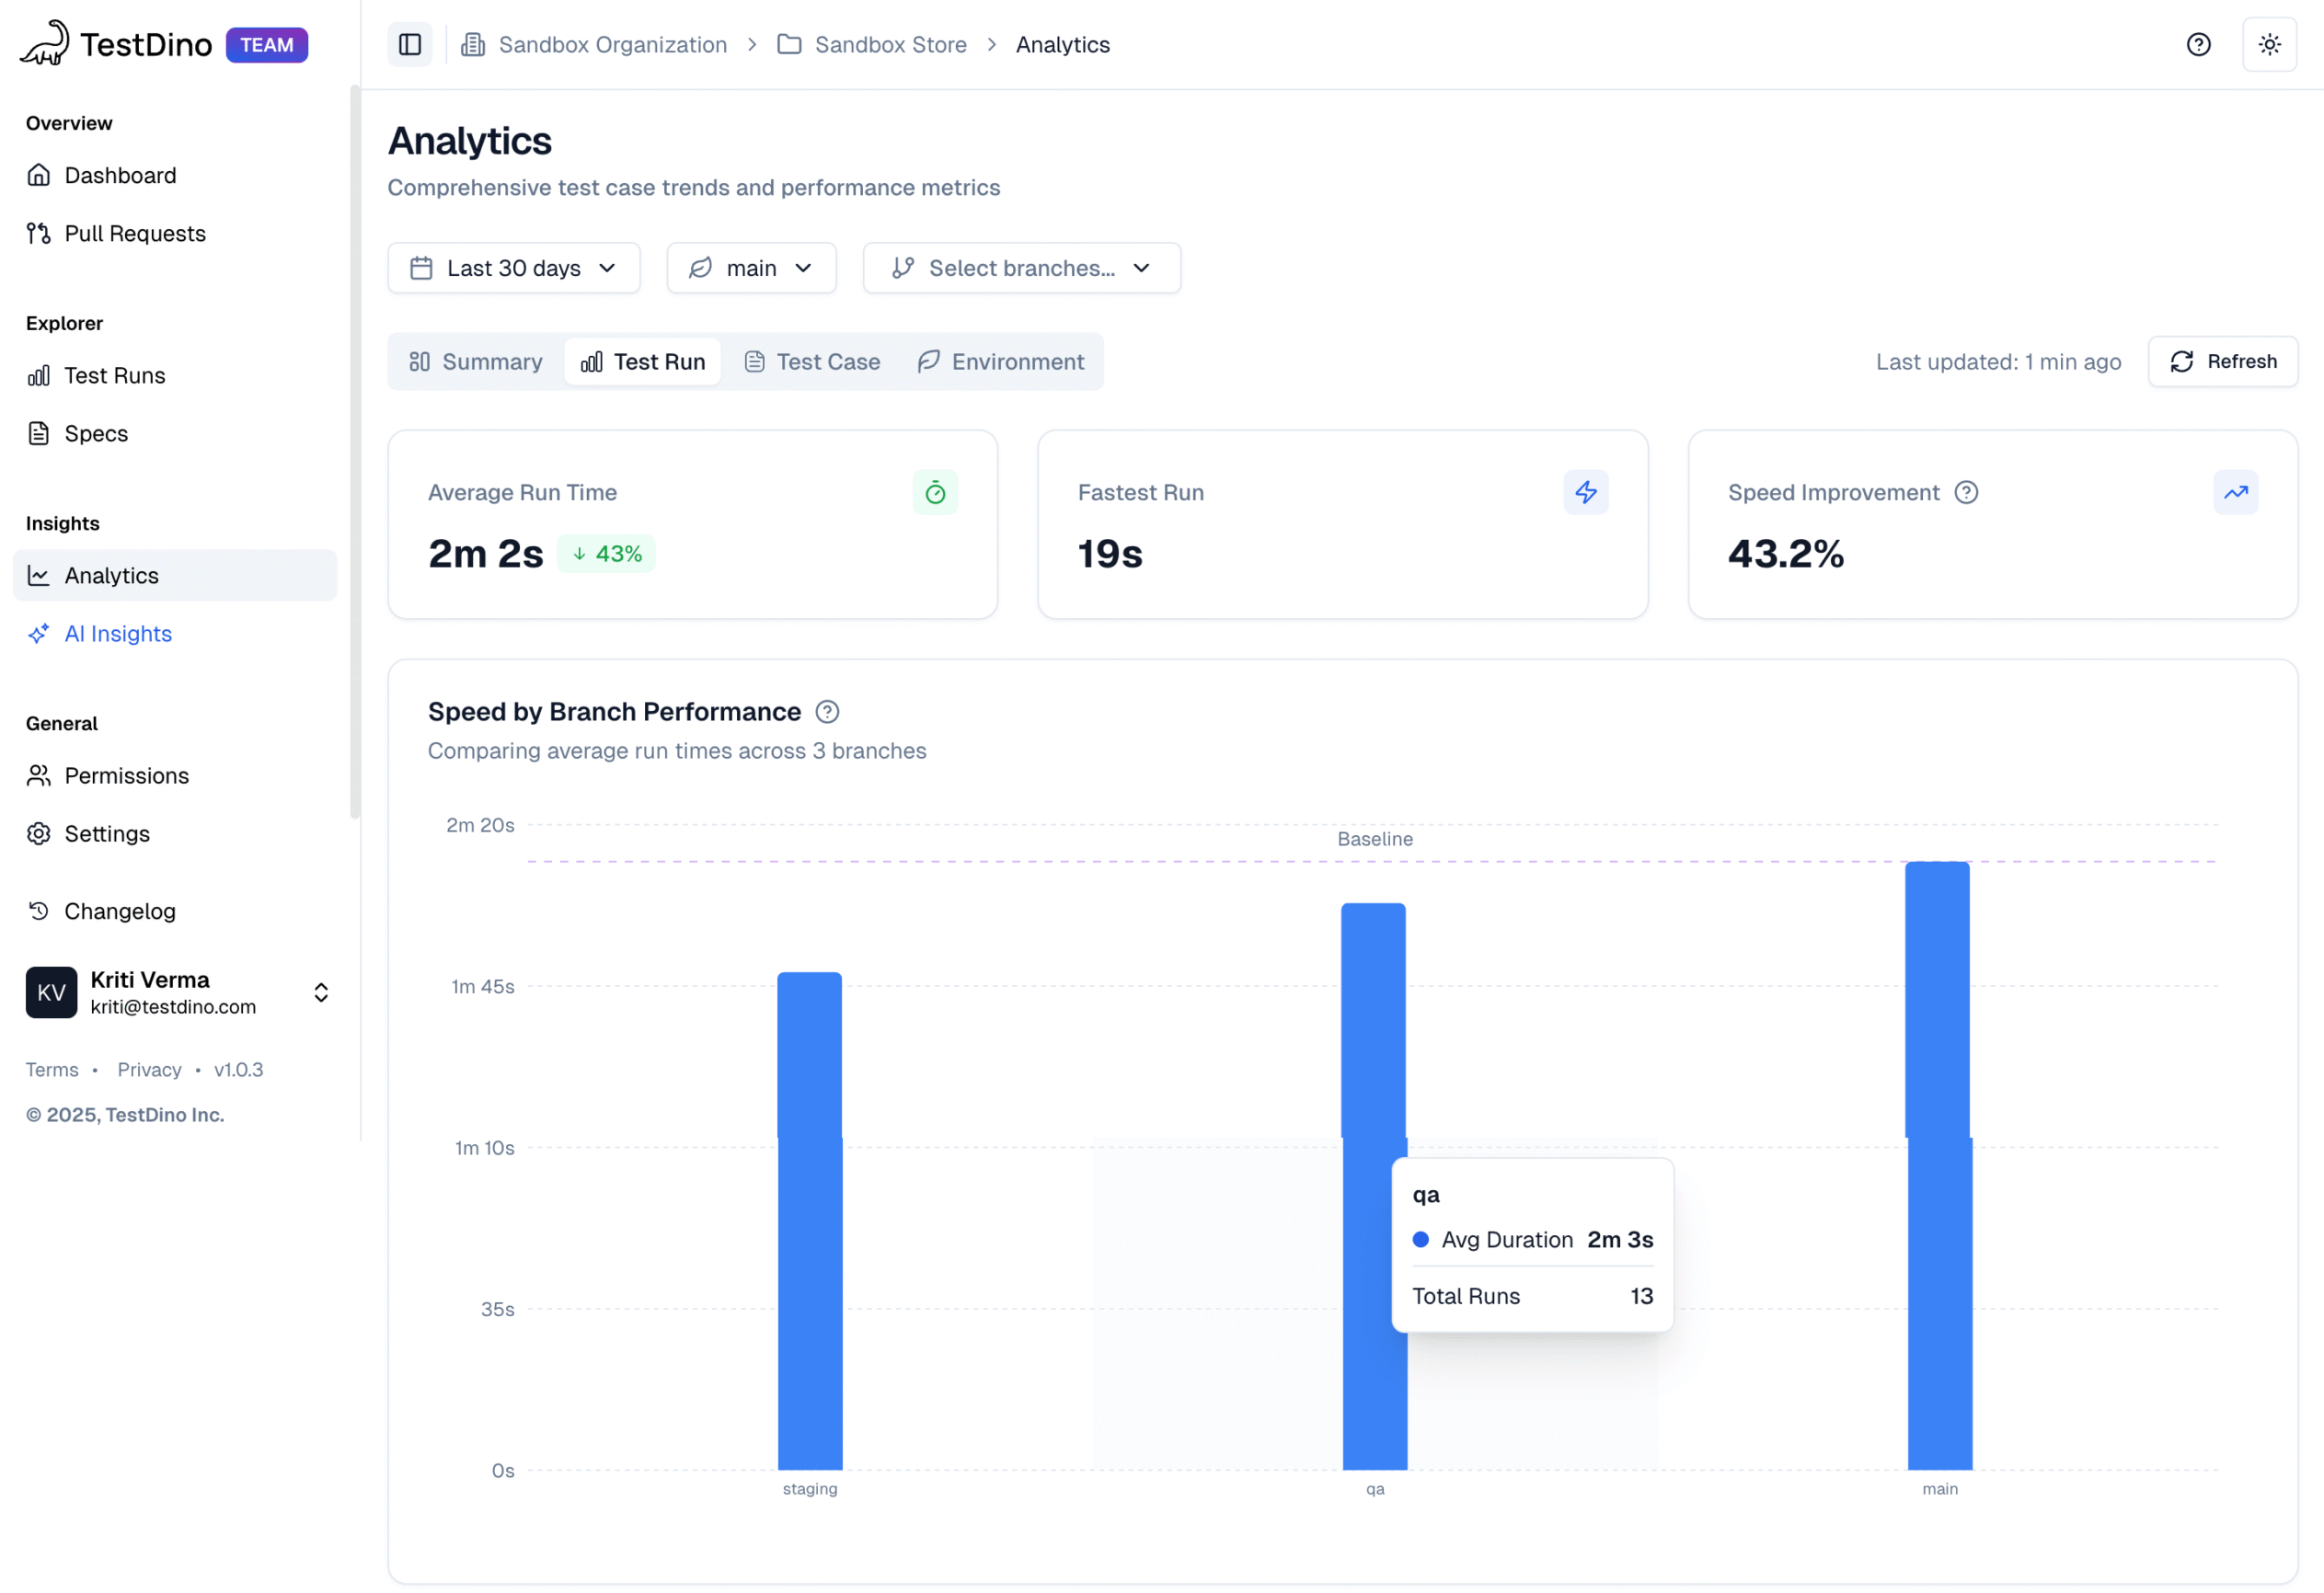
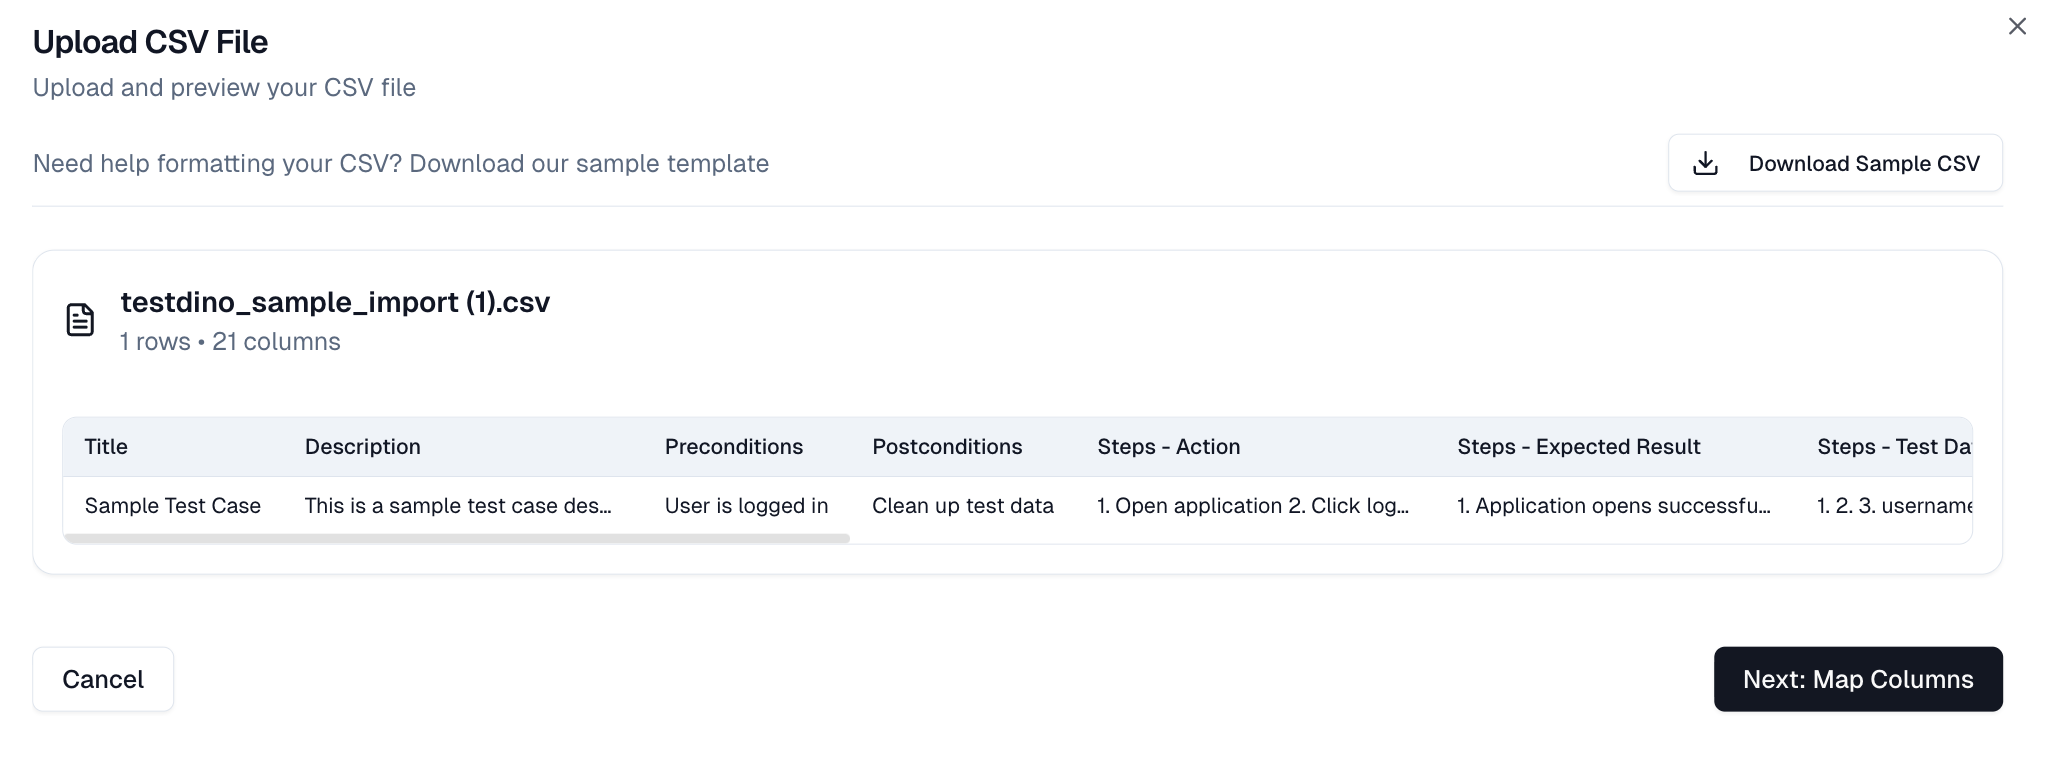
Most Playwright teams face the same daily struggle: thousands of test executions, endless CI logs, and countless pass/fail marks that reveal what happened but not why. Developers sift through CI pipelines, QA engineers fight flaky tests, and managers can’t see whether software quality is improving or slipping.

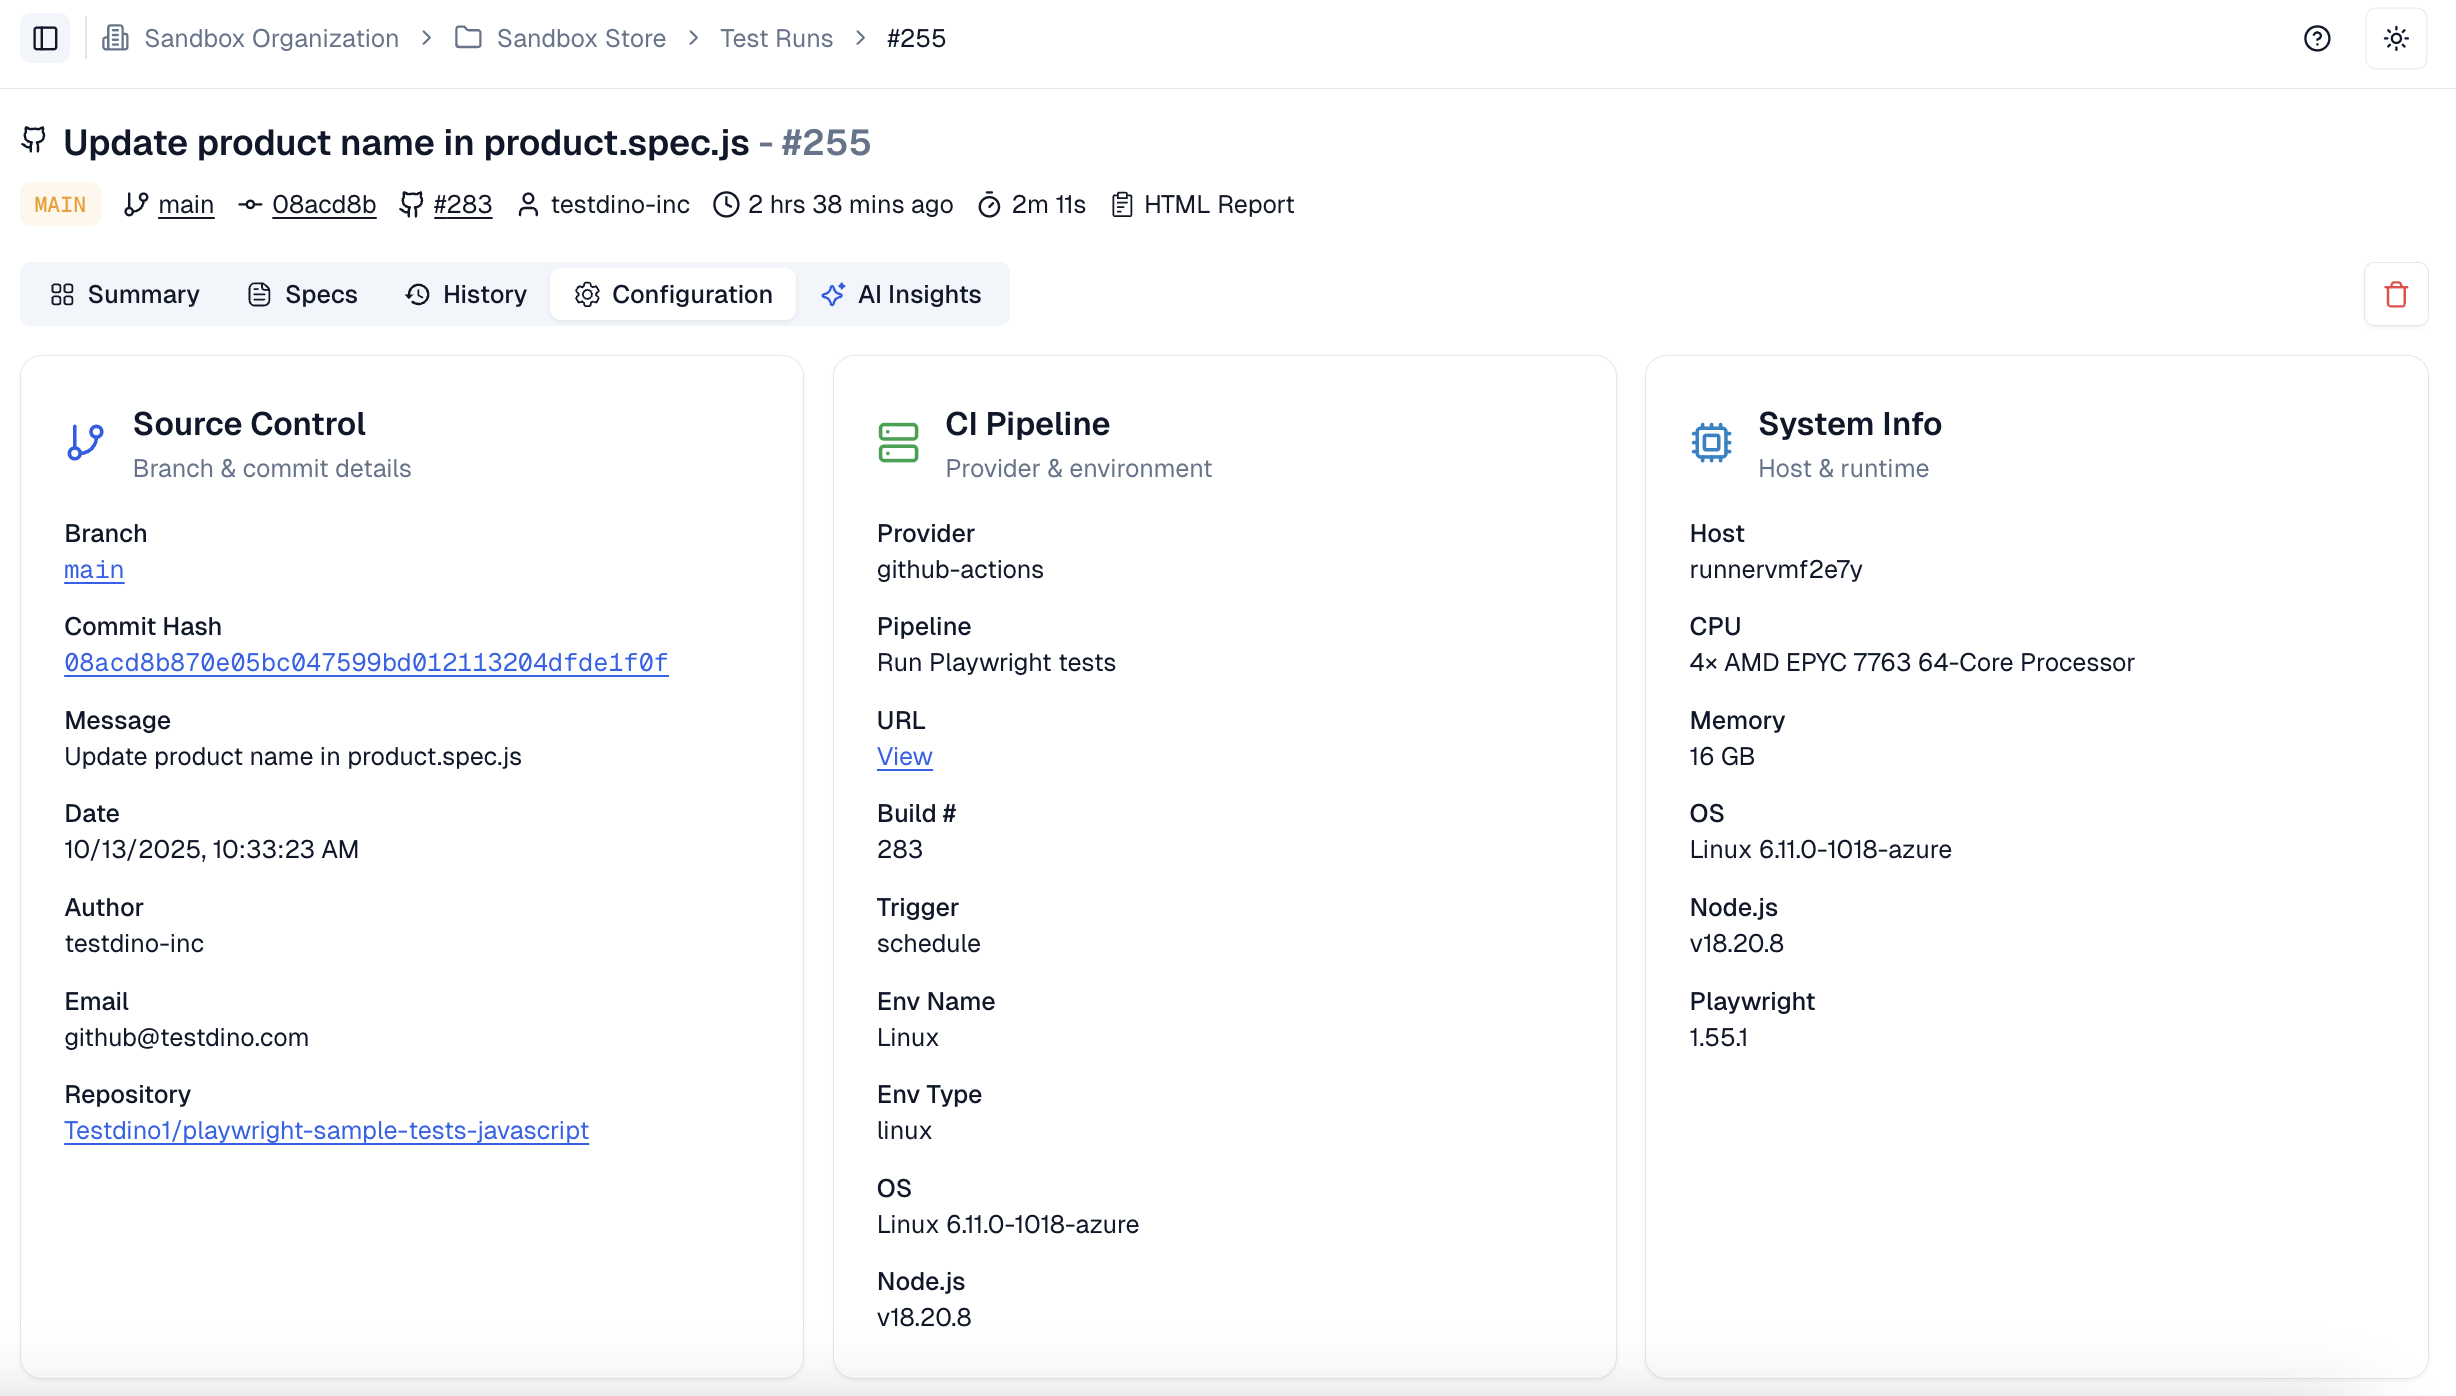
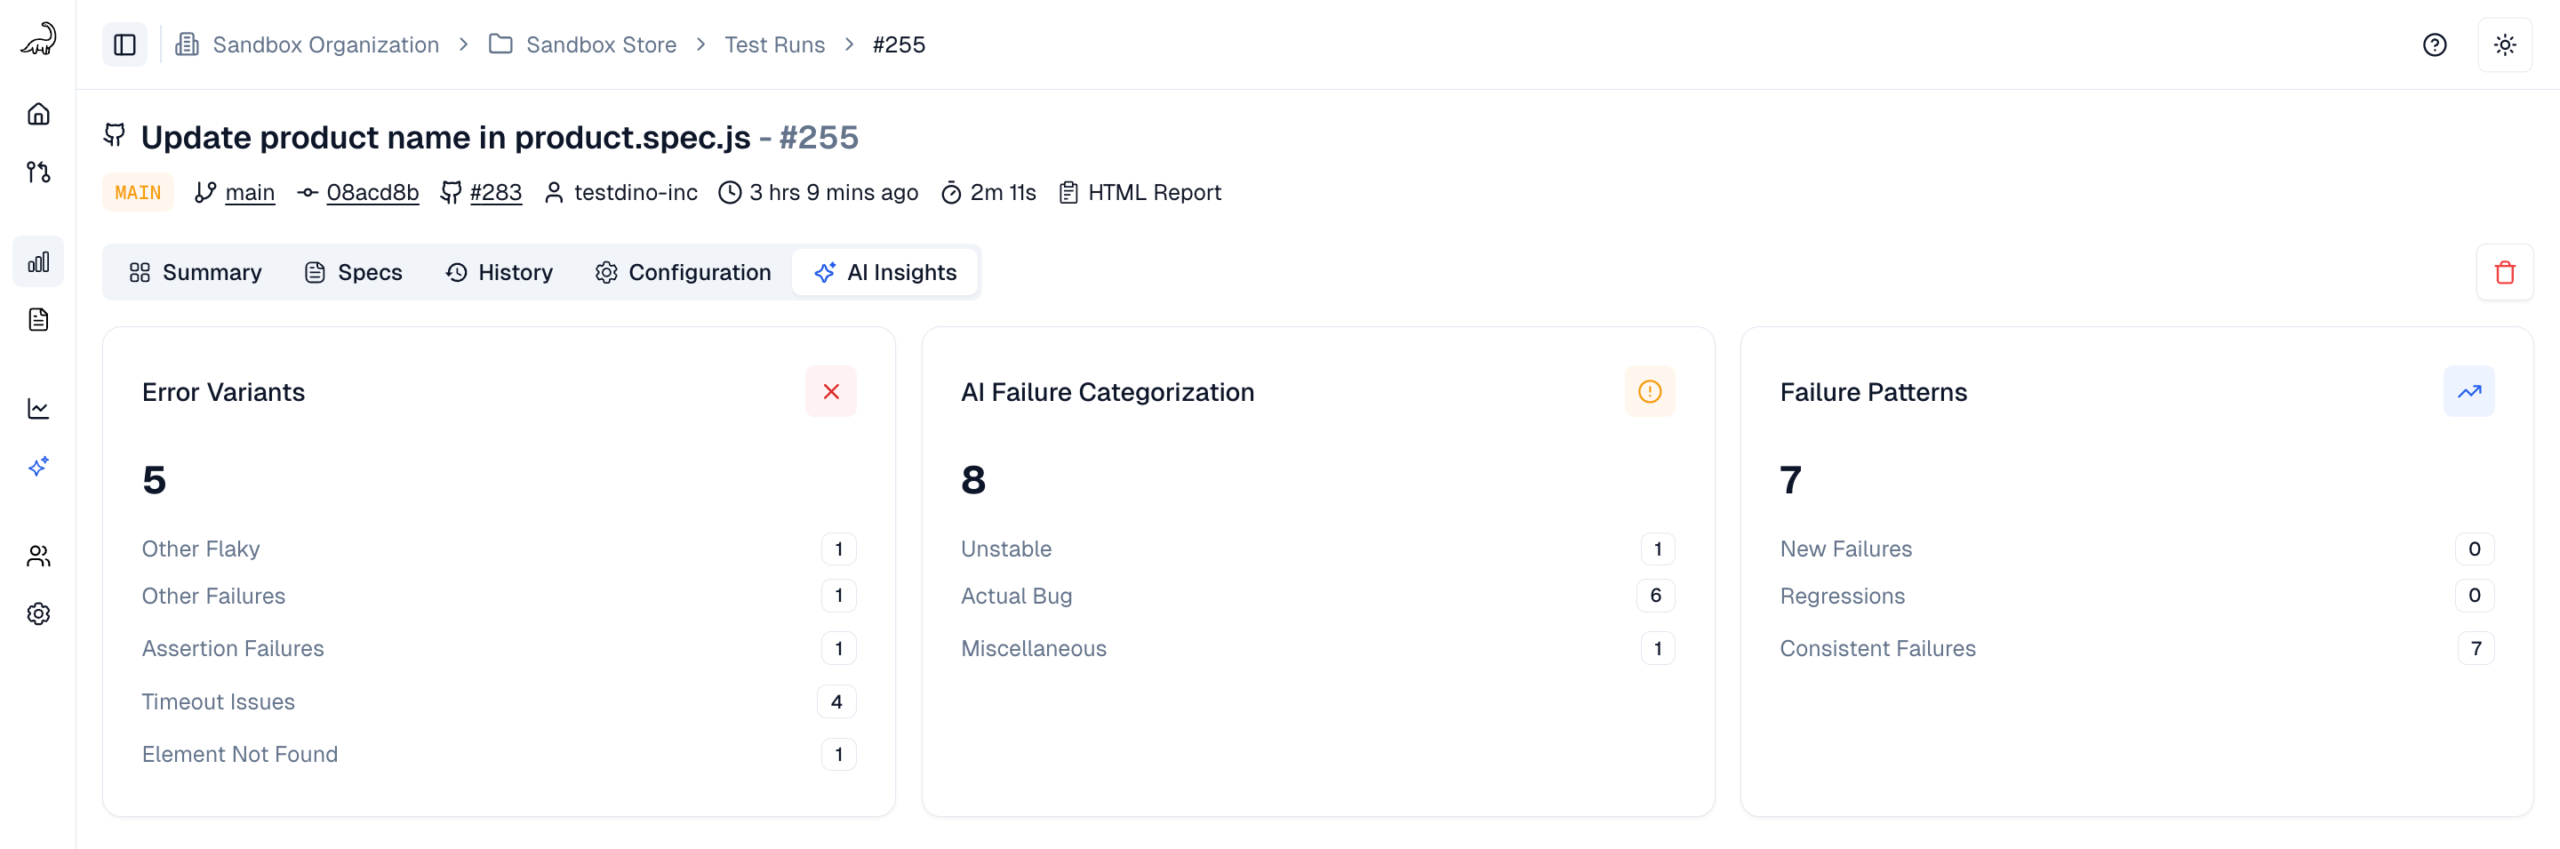
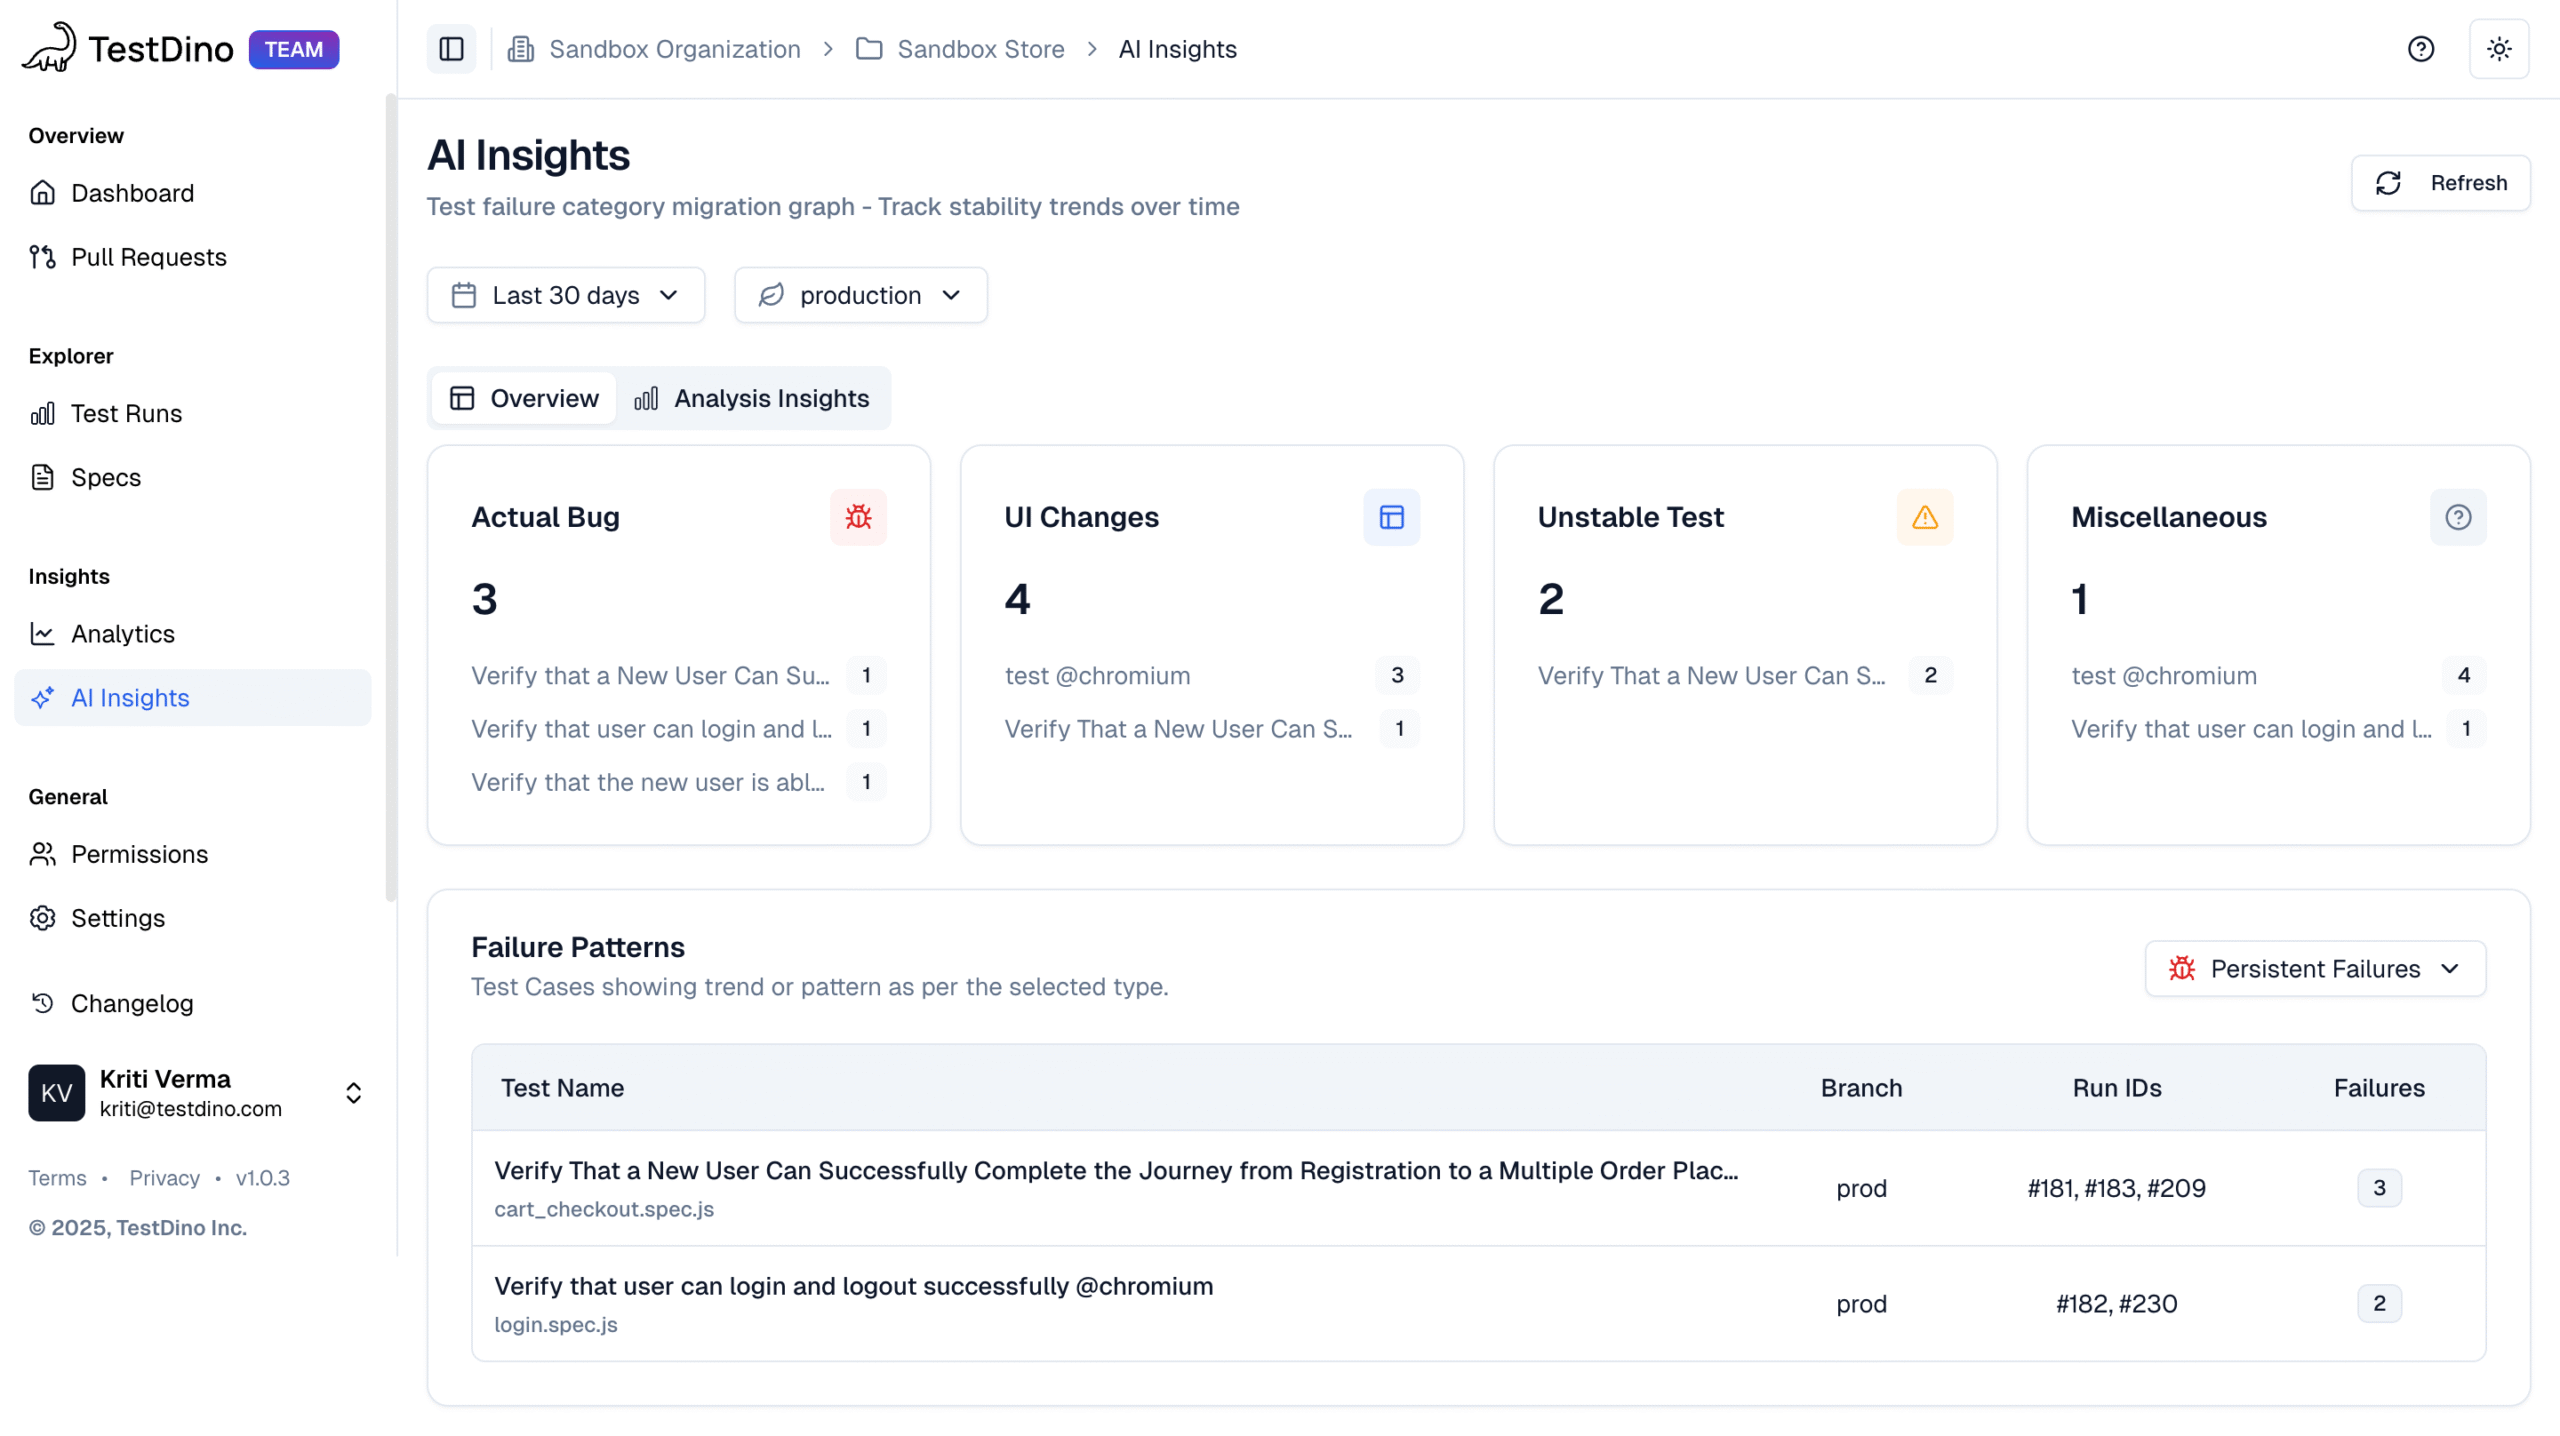
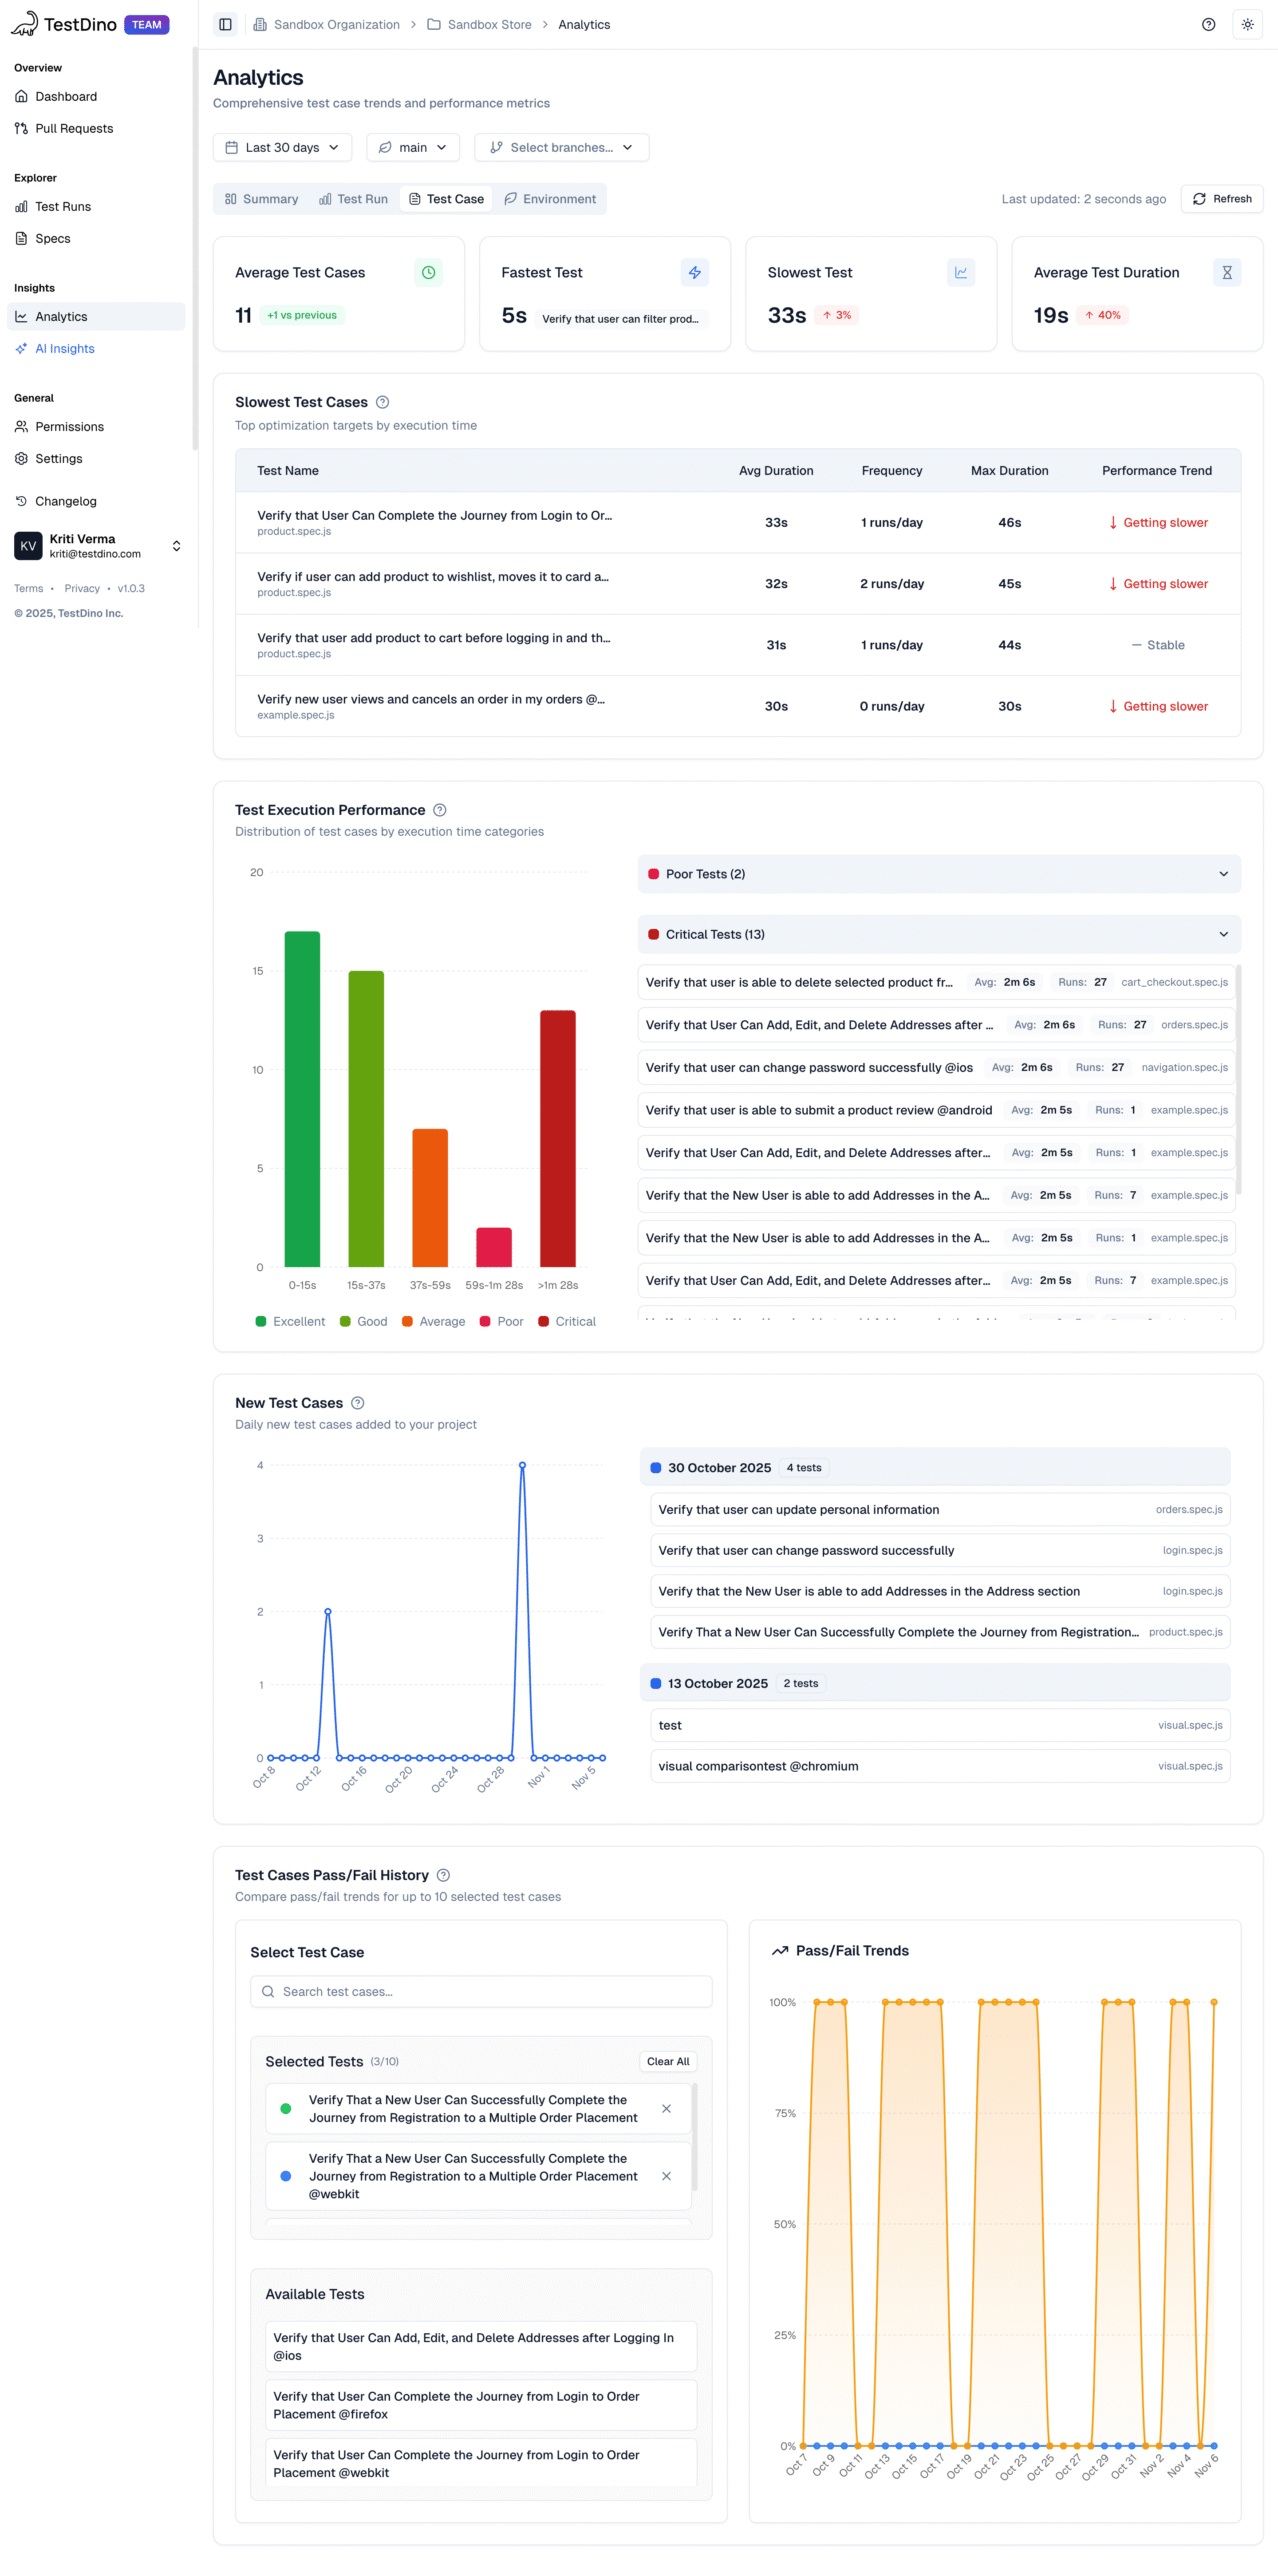
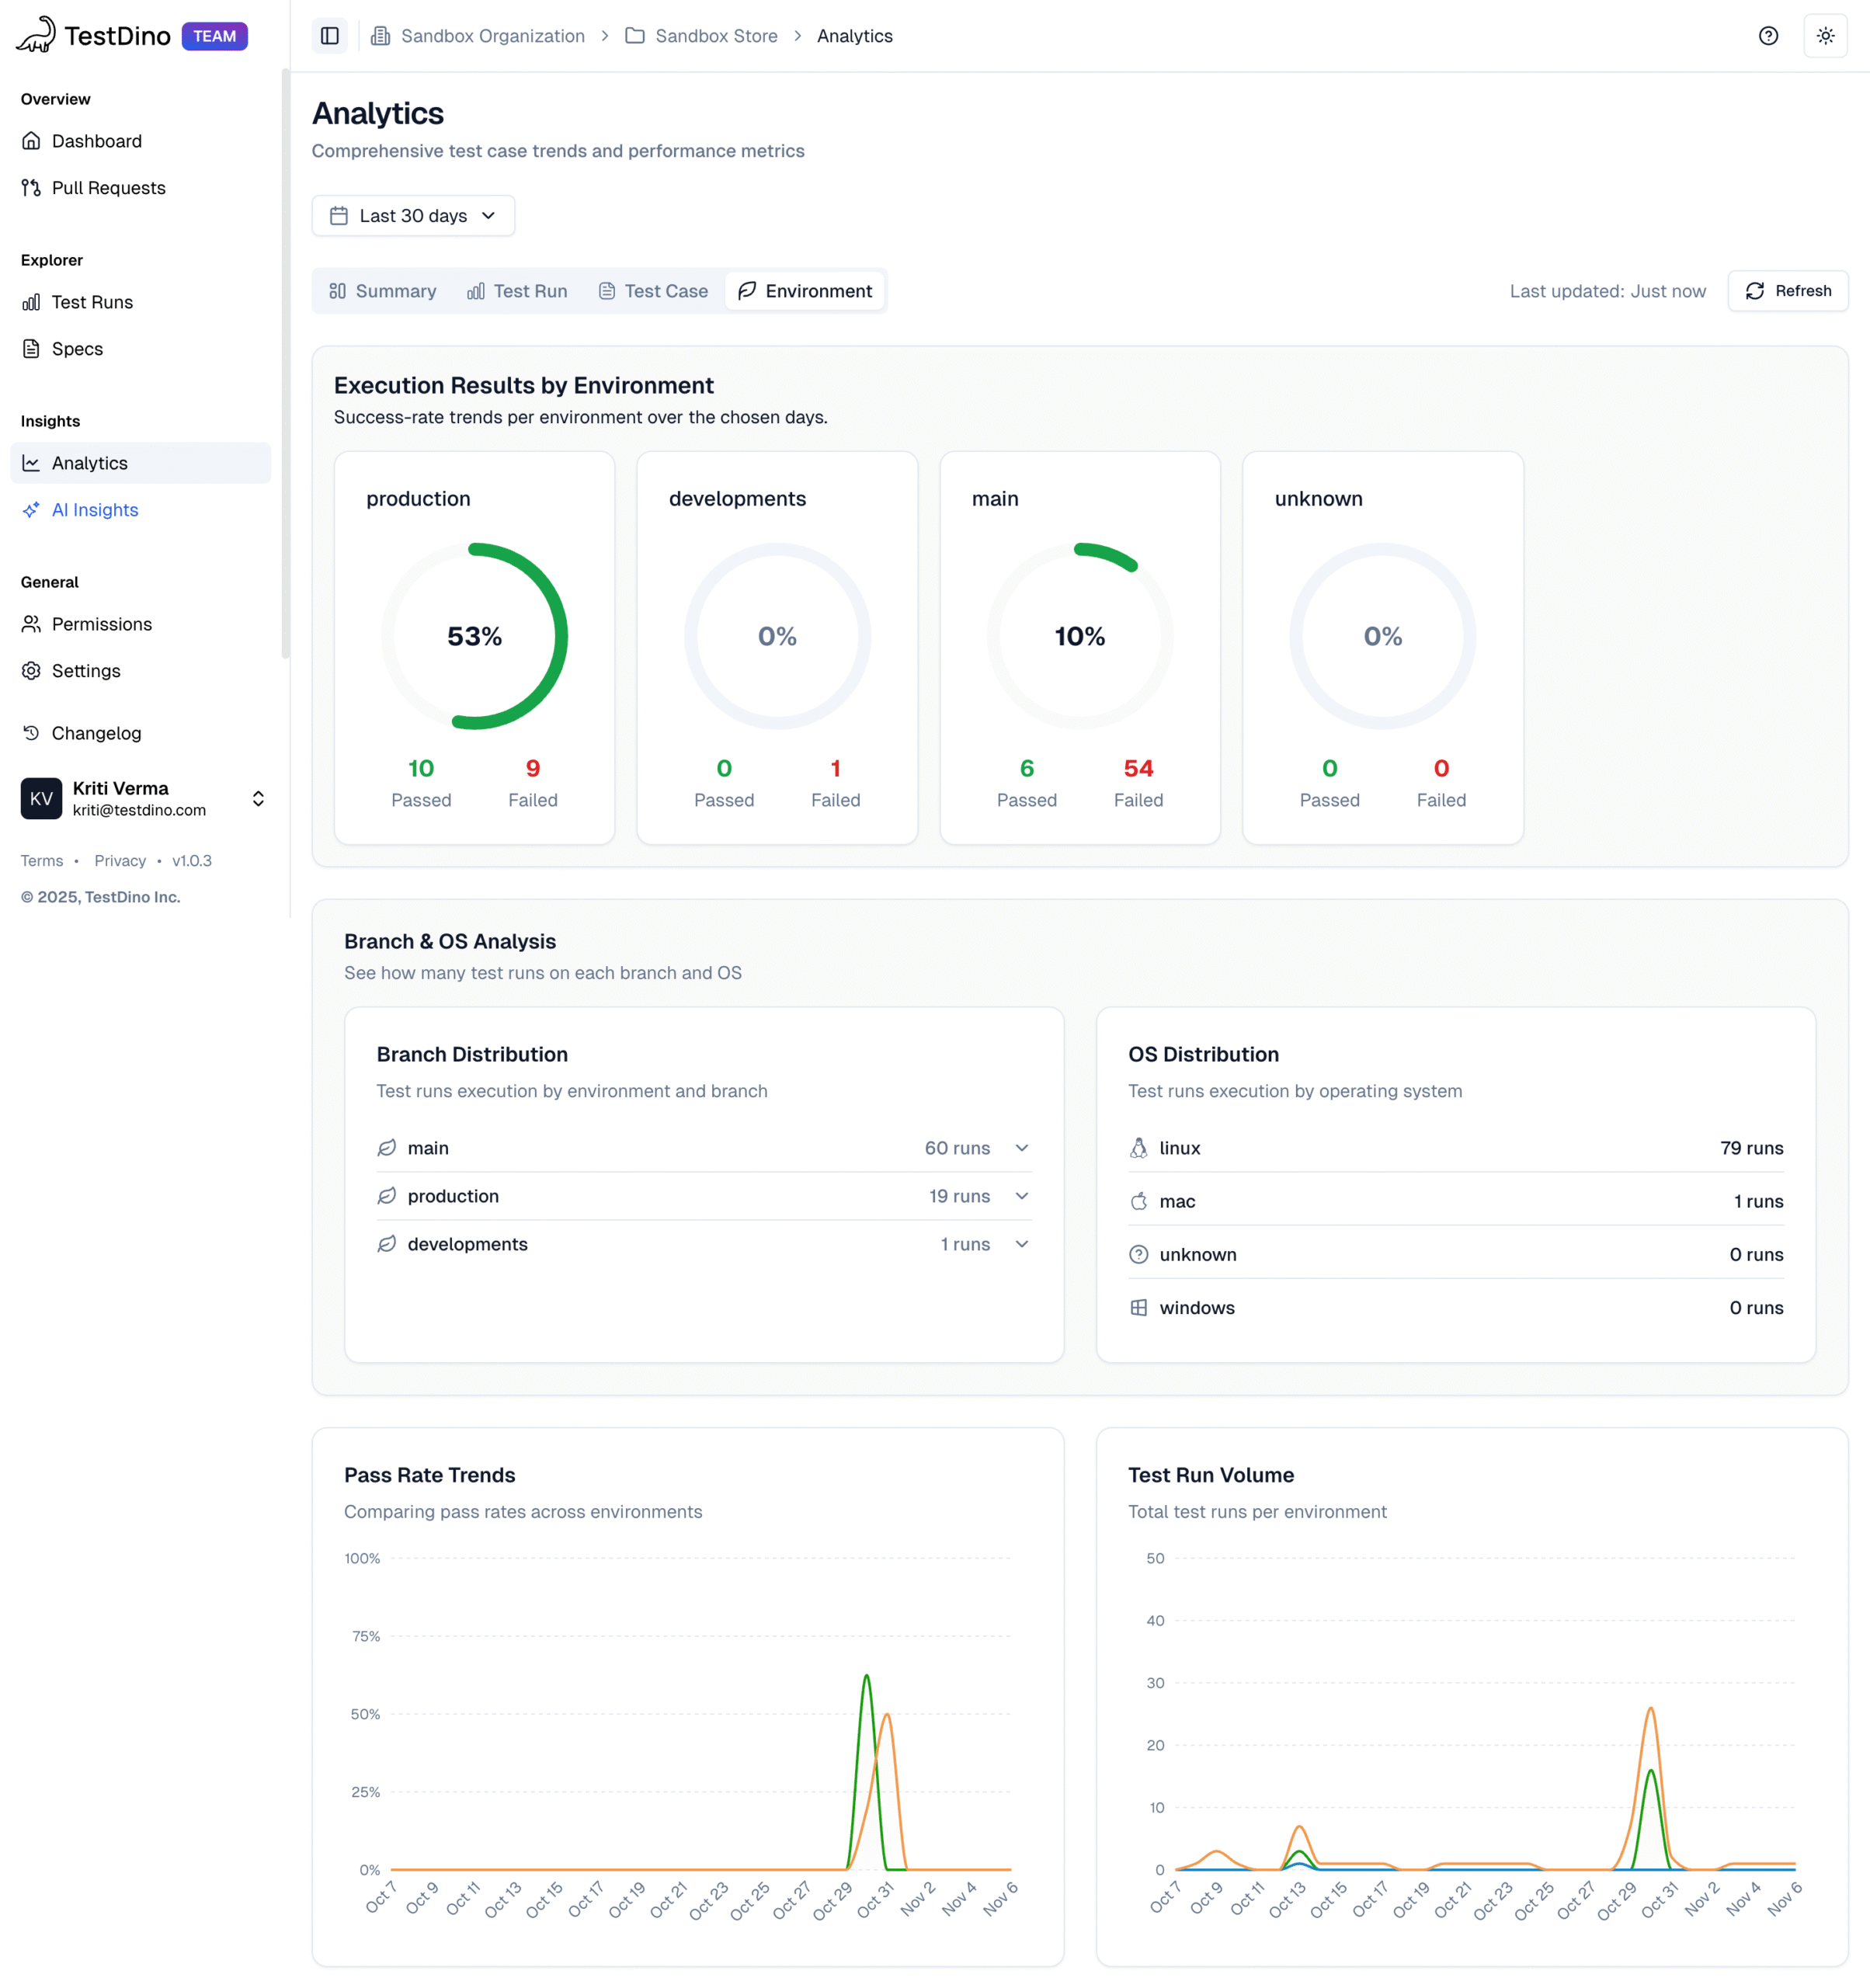
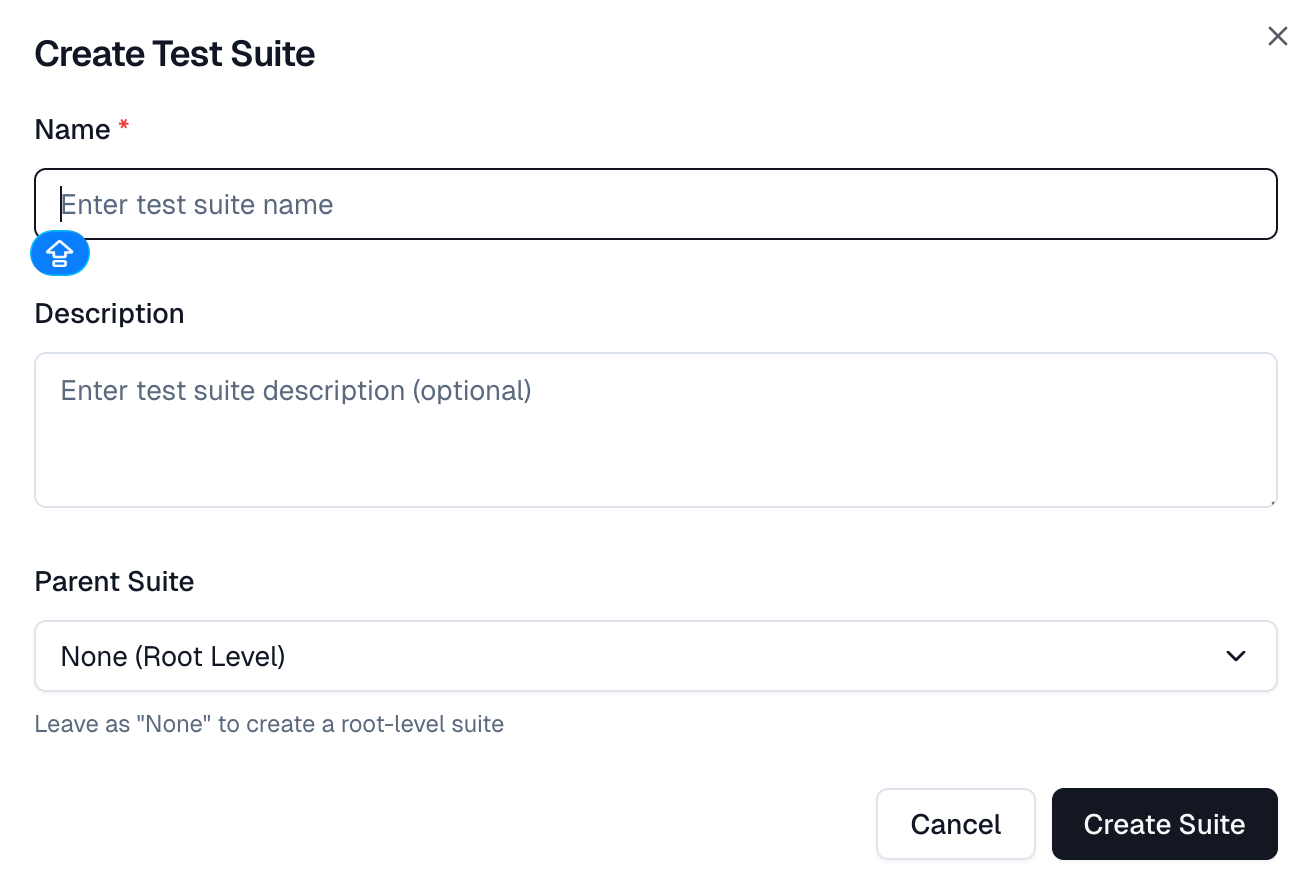
It goes beyond simple test reporting metrics, providing Playwright teams with a deep understanding of testing. Powered by AI failure categorization, role-based dashboards, PR-aware analytics, and detailed run evidence, it brings clarity to chaos.

It’s built for teams who care about clarity, not clutter, transforming Playwright test reporting into a source of actionable intelligence rather than noise.

What is TestDino?

TestDino is a Playwright test reporting and analytics platform that helps QA and development teams make sense of every test run. It becomes your single source of truth across branches, environments, and pull requests.

By combining AI insights, environmental mapping, branch health metrics, and detailed artifacts such as screenshots and logs, TestDino helps teams move beyond simple test outcomes to understand what’s truly happening beneath the surface.

It answers the real questions that teams care about:

  • Why did a test fail?
  • Was it a real bug, an UI change, or a flaky test?
  • Which environment or branch does it affect the most?

How does TestDino turn Playwright failures into clear next steps?

At its heart, TestDino converts raw Playwright test data into actionable intelligence. Each failure is automatically analysed, AI-classified, and paired with contextual run evidence screenshots, console output, and trace viewer logs.

When you open a failed test case, you’ll instantly see:

  • Visual comparison modes (Diff, Slider, and Side-by-Side) to review UI regressions
  • Replay traces that walk you through what really happened.
  • AI-driven failure labels include Actual Bug, UI Change Failure, Unstable Test, and Miscellaneous.
  • Confidence scores show how certain the AI model is about its classification.

This evidence-first workflow helps QA engineers triage flaky Playwright tests faster, separating environment noise from real defects in seconds, not hours.

Role-Based Dashboards: Data that Adapts to Every Role

QA Dashboard:

Every member of your team sees test data differently. TestDino respects that with role-based dashboards that speak each language: QA, Developer, and Manager.

  • Pass/fail counts and execution durations
  • Flaky test detection trends
  • AI-driven failure categorization
  • Insight panels for critical issues, trends, and optimization

QA leads can instantly see whether flaky test rates spiked on staging or if test speeds dipped last week

Cross-Environment performance

Modern Playwright teams often test across development, staging, and production. Subtle differences can create misleading results. TestDino surfaces:

  • Pass rate trends across environments
  • Flaky rate distributions
  • Average execution times per environment
  • Total executions per branch

This visibility helps teams pinpoint whether failures originate from code or infrastructure.

Developer Dashboard:

Developers get their own focused view centered on branches, pull requests, and branch health.

Here’s what awaits you:

  • Which PRs are “ready to ship”
  • Active blockers and regression alerts
  • Provides Flaky Tests Alert with its flaky rate
  • Branch health spotlight

No more switching between CI logs and GitHub. TestDino brings PR testing right into your daily workflow.

developer_dashboard

Flaky Test Detection (Stability Through Insight //optional)

Flaky tests are the silent CI killers. TestDino automatically detects and tracks flaky patterns using AI and retry analysis. It visualizes failure clustering and retry frequency so teams can systematically reduce noise and improve CI reliability.

By turning randomness into recognizable signals, teams can triage flaky Playwright tests faster and confidently maintain large test suites.

Developer_dashboard-2

Pull Requests View

The Pull Requests view brings testing insights directly into the code review workflow. Instead of switching between CI logs and GitHub, teams can see every PR’s testing health, evidence and risk indicators in one unified view.

Key benefits include:

  • Run context at a glance: See Latest Test Run ID, start time, duration, pass/fail/flaky/skipped metrics, with AI-generated insights and root cause analysis.
  • Open for proof: Expand rows to see full run evidence, including failure clusters, spec-level data, logs, screenshots, console output, and traces.
  • Verifiable history: Review the complete run history to check if retries or fixes stabilized flaky tests; see run-to-run patterns and recurring instability.
  • Fast handoff: Jump directly from a PR to failing runs or test cases without leaving the dashboard
  • Centralized PR context: Access Overview, Timeline, and Files Changed tabs for PR health, commit history, test runs, review comments, and code diffs in one place.
  • Code review in context: See each PR and its associated test runs to analyze patterns and identify recurring issues.

Layout and Key Components

Section What It Shows Purpose
Pull Request PR title, number, author, and a state badge (Open, Closed, Merged, Draft) Quickly identify review status and click to open the PR in your Git host.
Latest Test Run Most recent TestDino run linked to the PR, including run ID, start time, and duration Understand test freshness, execution time, and view AI-generated insights.
Test Results Compact counts for Passed, Failed, Flaky, and Skipped tests Instantly assess PR stability and review readiness.
Row Expander Expands a PR row to show full test run history with IDs, timestamps, durations, and badges Verify if recent commits improved stability or if flakiness persists.
Filters & Controls Search, Status, Author filters, sorting, and sync options Narrow down large PR lists and focus on active or risky ones.
Overview Tab At-a-glance PR status and KPIs (Test Runs, Pass Rate, Files Changed, Avg Duration) Make quick decisions about PR health.
Timeline Tab Chronological feed of commits, test runs, and comments Trace which commits caused failures or fixes; filter by author, type, or status.
Files Changed Tab Code diffs for all modified files Review additions, deletions, and comments alongside test context.

PR Status States:

  • Open: Active review; new commits trigger tests automatically
  • Draft: Work in progress; primarily internal validation
  • Merged: Integrated into base branch; full history preserved
  • Closed: Not merged or reverted; past data retained

Quick Start Steps

  • Set scope: Filter the PR list by Status (open, closed, merged) and Author.
  • Scan rows: Check the Latest Test Run and Test Results columns to quickly assess risk.
  • Open PR Detail View: Click any PR row to open the tabbed detailed view.
  • Analyze Context: Open any PR and check their Overview, Timeline, and Files Changed tabs to review test health, commit history, and code diffs.
TestDino Playwright Test Run Pull Requests

How TestDino Extends GitHub

  • Instant Triage Access: Open logs, videos, screenshots, traces, and detailed test run insights directly from a PR.
  • Flake & Regression Tracking: See if commits stabilized flaky tests or introduced regressions; view run-to-run patterns.
  • Environment Mapping: Map test results to dev, staging, or production for real release impact.
  • Cross-Tool Integration: Create Jira, Linear, or Asana tickets directly from PR test failures.
  • Historical Analysis: Use the Timeline tab to track commits, test runs, and comments chronologically.
  • Integrated Code Review: Files Changed tab shows code diffs alongside test results; no need to switch to GitHub.

Test Run

Playwright Test Runs

Summary Tab

The Summary tab is built for instant understanding. It automatically groups failed, flaky, and skipped tests by their root cause, allowing teams to diagnose issues within minutes.

Failed Tests: A test is marked Failed when execution completes but ends with an unmet condition or error. Common causes include:

  • Assertion Failures: expected vs actual mismatches.
  • Element Not Found: locator issues or missing elements.
  • Timeout Issues: actions or waits exceeding their limits.

Flaky Tests: When a test behaves inconsistently across runs without any code change, it’s flagged as Flaky. These often pass on retry. Causes include:

  • Timing-related issues like race conditions or wait sensitivity
  • Environment-Dependent Failures caused by unstable setups.
  • Network-Dependent Instability due to intermittent remote calls.
  • Intermittent Assertions triggered by unpredictable data or states.

Skipped Tests: Tests that don’t run at all are listed as Skipped. Reasons may include:

  • Manually Skipped tests (intentional exclusions).
  • Configuration Skipped due to CI settings.
  • Conditional Skipped triggered by runtime checks.

Detailed Analysis View:

By opening an individual test run, you can access the Detailed Analysis View for fast triage:

  • Single-table view for fast triage showing status, spec file, duration, retries, failure cluster, and AI category.
  • History preview shows current and up to 10 past executions.
  • Trace #” links open Playwright traces for actions, events, console output, and network calls.
  • Token-based filters (s: status, c: cluster, @tag, b: browser) and duration sorting surface slow or failing tests quickly.
Summary

History Tab

The History Tab lets teams visualize how stability evolves.

  • The Run History Chart shows stacked counts of Passed, Failed, Flaky, and Skipped tests for each run, helping you identify regressions or recurring issues.
  • The Test Execution Time Chart tracks total runtime per build and flags any deviations from recent averages.

Together, these charts help teams catch performance drifts or instability before they impact release quality.

Summary 2

Specs Tab

The Specs tab provides a file-centric view of a run. This is the quickest way to assess a feature area without leaving the run, allowing you to review results by file (e.g., cart.spec.js).

The left panel lists every spec file with its total tests, counts for pass/fail/flaky/skipped, and total duration. You can sort and filter the list to spot slow files and failing areas fast.

The right panel then lists all tests inside the selected file, including status tags and retry badges.

Playwright Specs Tab

Configuration Tab

The Configuration tab provides the complete execution context needed to reproduce a run and detect config drift. It meticulously details:

  • Source Control: Branch, commit hash, author, message, and links to the repo/PR.
  • CI Pipeline: CI provider, job, run URL, and target environment/sharding info.
  • System Info: OS, container image, CPU, memory, Node.js, and Playwright versions are critical for spotting environment mismatches.
  • Test Configuration: Projects, browsers, workers, retries, timeouts, and other settings like baseURL or headless mode.
Configuration

AI Insights Tab

The AI Insights Tab elevates test analytics by categorizing failures and revealing patterns that might otherwise stay hidden.

KPI Tiles display top-level summaries:

  • Error variants
  • AI failure categories
  • Pattern groups (New Failures, Regressions, Consistent Failures)

A row-level breakdown then shows the test case name, category, error variant, and duration all filterable by execution speed or category type.

You can interact with the dashboard by selecting tiles to automatically apply focused filters. Combine multiple filters (like category + variant) to narrow your search for recurring issues.

TestDino AI Insight Tab

Specs Explorer

The Specs Explorer offers a centralized, project-level perspective on all your test specification files, bringing together key performance and reliability information in one place. Instead of opening individual test runs, you can review every spec’s health in a single, organized table.

Who Benefits:

  • QA Engineers: Quickly spot the specs with the highest failure or flaky rates to focus stabilization efforts.
  • Developers: Identify the slowest-running spec files that could be slowing down CI/CD pipelines and optimize them.

Why Use This View

  • Complete Project Overview: Understand the status and performance of all spec files across the project.
  • Spot Bottlenecks: Easily detect specs that are taking longer than expected to run.
  • Pinpoint Unstable Specs: Highlight specs that frequently fail or contain flaky tests to reduce test noise.
  • Context-Aware Analysis: Apply filters by time range and environment to connect issues with specific branches or setups.

Key Table Metrics

The Specs Explorer table makes it easy to analyze specs with sortable columns:

  • Spec File: Shows the file name and path, linking metrics directly to the test suite or feature for faster debugging.
  • Executions: Counts how many times a spec has run in the chosen timeframe and environment. Frequent runs with failures indicate high-impact issues.
  • Failure Rate: Percentage of executions that failed at least one test, highlighting consistently problematic specs.
  • Flaky Rate: Percentage of executions with flaky tests, helping distinguish instability from consistent failures.
  • Average Duration: Shows how long the spec typically takes to run, making it easier to detect performance bottlenecks.
  • Last Run Duration: Execution time of the most recent run, allowing comparison with the average to find regressions.

Filters and Controls

  • Search: Quickly locate a spec file by name.
  • Time Range: Focus on recent activity with customizable windows (7, 14, 30, 60, 90 days).
  • Environment Filter: View specs executed in specific environments like production, staging, or QA.
  • Refresh: Update the table with the latest execution data.

Quick Workflow

  • Define Scope: Use time and environment filters to narrow your focus.
  • Prioritize Specs: Sort by Failure Rate, Flaky Rate, or Average Duration to identify slow or unstable specs.
  • Locate a Spec: Use the search bar to find a specific spec quickly without scrolling.

Test Case

By clicking on an individual test case from the Test Run Overview tab, you can see all the details that matter about that specific test in the current run:

  • Status: See whether the test passed, failed, skipped, or turned Flaky. If it didn’t pass, the primary technical cause is shown, giving immediate context for triage.
  • Primary Cause: Highlights the reason behind the outcome, from assertion failures to timeouts.
  • Runtime: Displays how long the test took to execute, helping identify slowdowns after code or configuration changes.
  • Attempts: Shows how many retries were made under your configured retry strategy. A pass after retry often signals underlying instability.
  • Evidence Links: By clicking into the individual test case, you get direct access to console logs, screenshots, videos, and Playwright traces everything needed for root cause analysis.

KPI Tiles

Instantly view key run metrics for quick triage and decision-making.

1. Why Failing:

  • AI classifies each failure or flake as Actual Bug, UI Change, Unstable, or Miscellaneous.
  • Confidence Score shows how sure the AI is about its classification.
  • Feedback Form lets you confirm or correct AI tagging, improving future predictions.

2. Total Runtime:

  • Tracks total execution time per test to highlight slowdowns or regressions instantly.

3. Attempts:

  • Shows how many retries occurred during the run.
  • A pass after retry signals possible instability or environment flakiness.

Visual Comparison

You can access Visual Comparison by opening an individual test case.

TestDino supports Playwright visual assertions (like toHaveScreenshot) and provides multiple modes for reviewing differences between expected and actual screenshots. This helps QA engineers quickly spot UI regressions or subtle layout changes.

Mode What It Shows
Diff Colored overlays highlighting changed regions
Actual Screenshot captured during the failing test run
Expected Stored baseline screenshot
Side-by-Side Actual and expected screenshots in two panes
Slider Interactive slider to sweep between Actual and Expected

Test Case History

Every test case in TestDino carries a complete execution record that tracks its reliability across all runs on the current branch. This allows QA teams to see not only what failed but also how often and why.

Note: The history view is scoped to the current active branch. Test runs from other branches are excluded to maintain context.

What You’ll See

1. Test Metrics:

A performance summary showing:

  • Stability: The reliability score of the test over time.
    ◦ Calculated as ( Passed Runs ÷ Total Runs) × 100.
    ◦ 100% means perfect stability the test passed in every tracked run.
  • Total Runs: The number of times the test has been executed on this branch.
  • Outcome Counts: Breakdown of Passed, Failed, Flaky, and Skipped runs.

2. Last Status Tiles

Each outcome (Passed, Failed, Flaky) appears as a tile showing:

  • The run number (e.g., #251)
  • Timestamp (e.g., “1 week 1 day ago”)
  • A Current label if it matches the ongoing view

Each tile links directly to that run’s detailed report for instant comparison.

3. Execution History Table:

A chronological record of every execution, with key details:

Features Description Purpose
Executed At Timestamp of test execution Correlate failures with deployments
Run # Unique test run identifier Identify the exact build
Status Passed / Failed / Flaky / Skipped (with badges) Visualize patterns over time
Duration Total runtime Detect performance regressions
Retries Retry count Indicate flakiness
Run Location Link to CI job Jump directly to logs
Actions “View Test” button Open the test run report

Evidence Panels

Evidence Panels are available when you open an individual test case from the Test Run Overview tab.

Each test attempt has its own set of detailed panels:

  • Error Details: Exact failure message and key line of code.
  • Test Steps: Step-by-step breakdown with per-step timing to pinpoint where the failure occurred.
  • Screenshots: Captured frames at the failure point for visual validation.
  • Console: Browser console output for correlating script or network errors with UI issues.
  • Video: Full recording of the test attempt, including retries, to replay the scenario.
  • Attachments / Trace: Interactive Playwright trace showing DOM snapshots, actions, events, and network calls. Jump directly to the failing step for precise diagnosis.
  • Feature Comparison (Visual Assertions): Compare actual and expected screenshots for UI or layout issues without leaving TestDino.

AI Insights for Test Cases

For every failed or flaky test, AI Insights in TestDino explains why it happened and what to do next.

Here’s what’s included:

  • Category & Confidence Score: The AI label (Actual Bug, UI Change, Unstable, Miscellaneous) with confidence level. You can edit it through the feedback form.
  • AI Recommendations: Shows the most probable cause and supporting evidence, often linked to recent code or configuration changes.
  • Historical Insight: Reveals whether this is a new issue or part of a recurring trend.
  • Quick Fixes: Suggests targeted actions to try first from adjusting locators to refining waits or retries.

Specs Explorer

specs

The Specs Explorer offers a centralized, project-level perspective on all your test specification files, bringing together key performance and reliability information in one place. Instead of opening individual test runs, you can review every spec’s health in a single, organized table.

Benefits for:

  • QA Engineers: Quickly spot the specs with the highest failure or flaky rates to focus stabilization efforts.
  • Developers: Identify the slowest-running spec files that could be slowing down CI/CD pipelines and optimize them.

Why Use This View

  • Complete Project Overview: Understand the status and performance of all spec files across the project.
  • Spot Bottlenecks: Easily detect specs that are taking longer than expected to run.
  • Pinpoint Unstable Specs: Highlight specs that frequently fail or contain flaky tests to reduce test noise.
  • Context-Aware Analysis: Apply filters by time range and environment to connect issues with specific branches or setups.
Key Table Metrics:

The Specs Explorer table makes it easy to analyze specs with sortable columns:

  • Spec File: Shows the file name and path, linking metrics directly to the test suite or feature for faster debugging.
  • Executions: Counts how many times a spec has run in the chosen timeframe and environment. Frequent runs with failures indicate high-impact issues.
  • Failure Rate: Percentage of executions that failed at least one test, highlighting consistently problematic specs.
  • Flaky Rate: Percentage of executions with flaky tests, helping distinguish instability from consistent failures.
  • Average Duration: Shows how long the spec typically takes to run, making it easier to detect performance bottlenecks.
  • Last Run Duration: Execution time of the most recent run, allowing comparison with the average to find regressions.
  • Last Execution: Timestamp of the latest run, giving insight into recency and branch context.
    Tip:Hover over the branch name to see the exact Branch and Environment for diagnosing environment-specific issues.

Filters and Controls:

  • Search: Quickly locate a spec file by name.
  • Time Range: Focus on recent activity with customizable windows (7, 14, 30, 60, 90 days).
  • Environment Filter: View specs executed in specific environments like production, staging, or QA.
  • Refresh: Update the table with the latest execution data.

Quick Workflow:

  • Set Scope: Use time and environment filters to narrow your focus.
  • Identify Specs: Sort by Failure Rate, Flaky Rate, or Average Duration to identify slow or unstable specs.
  • Search a specific Spec: Use the search bar to find a specific spec quickly without scrolling.

AI Insights

Most test reporting tools only count failures. TestDino explains them.

The AI Insights engine analyzes every Playwright run, groups similar failures, and identifies recurring patterns so you can prioritize real problems first.

AI Failure Categorization

Every failure is automatically labeled with AI confidence scores under one of four categories:

  • Actual Bug: A repeatable defect caused by a code issue.
  • UI Change Failure: DOM or selector mismatches from recent design updates.
  • Unstable/Flaky Test: Intermittent failures that pass on retry.
  • Miscellaneous: Environment or CI setup issues.

This saves hours of manual triage and helps QA teams triage flaky Playwright tests faster.

Overview

Root Cause Analysis

AI doesn’t stop at labeling; it explains why a test failed. Each failed test includes:

  • Root cause explanations with confidence score
  • Suggested next steps (fix selector, update timeout, stabilize data)
  • Historical patterns showing whether it’s a regression or a recurring issue

With this, teams stop guessing and start fixing with confidence.

Pattern Recognition & Error Variants

TestDino groups related errors, timeouts, network failures, or missing elements under Error Variants.

You can filter tests by variant or AI label to see where similar problems cluster.

It flags new failures, regressions, and consistent blockers, allowing teams to detect trends early and track fixes over time.

Error Categories

Analytics

TestDino’s Analytics module transforms raw Playwright test execution data into clear, visual trends that are actually meaningful.

Instead of sifting through endless logs, QA teams, developers, and engineering leads can finally see where failures concentrate, what’s slowing them down, and how quality evolves.

Analytics gives you four distinct lenses: Summary, Test Run, Test Case, and Environment, each designed to answer specific questions about your Playwright test health.

1. Summary:

The Summary view is your project’s heartbeat. It surfaces the key metrics that show how your Playwright tests are performing over time:

  • Total Test Runs: See how many test executions happened within the selected period and environment.
  • Average Runs per Day: Understand CI activity and testing cadence.
  • Passed vs. Failed Runs: Quickly gauge build stability and the load of failed runs that need triage.

You’ll also find three crucial trend lines:

1. Test Run Volume

This shows daily test runs, split by Passed tests (green) and Failed tests (red). Hover over any date to see exact counts. Key metrics include:

  • Total Runs: All test runs in the selected time range and environment, showing overall test throughput.
  • Average Runs per Day: Mean number of test runs per calendar day, helping check CI cadence and scheduling consistency.
  • Total Passed Test Runs: Runs with zero failing tests, useful to track build stability and confirm improvements.
  • Total Failed Test Runs: Runs with one or more failing tests, indicating triage load and trends in failure volume.
2. Flakiness and Test Issues

Displays the percentage of executions that gave inconsistent results for the same code. High flakiness signals instability or poor test isolation.

3. New Failures

Highlights tests failing for the first time within the selected time window. This helps spot regressions immediately as they appear.

4. Test Retry Trends

Tracks how often retries occur. A rising retry curve often indicates hidden instability in the suite that retries are masking rather than resolving.

In short, the Summary tab tells you whether your overall Playwright pipeline is healthy, stable, or trending toward trouble.

2. Test Run:

This lens focuses on pipeline performance and how quickly and efficiently your Playwright test runs complete.

You can track metrics such as:

  • Average Run Time: The mean duration of all Playwright runs in scope. It sets the baseline for pipeline speed.
  • Fastest Run: The quickest run ever recorded in your selected period, marked as a “Best Yet” performance indicator.
  • Speed Improvement: The percentage gain or drop in speed compared to the previous time period.

These metrics are paired with interactive visualizations:

  • Speed by Branch Performance:A bar chart comparing average test run time across different branches. You can instantly see which branches are slower or more stable.
  • Test Execution Efficiency Trends: An area chart showing daily average run duration to detect gradual drifts or sudden regressions.
  • Test Run Speed Distribution: Stacked bars that classify daily runs into Fast, Normal, and Slow groups, helping you pinpoint slowdowns early.

For teams running large-scale Playwright suites, this view answers the question: “Are our tests getting faster or slower?”

Playwright Test Run

3. Test Case:

The Test Case view is where you can zoom in on individual Playwright tests to understand their behavior over time.

It includes four major metrics:

  • Fastest Test: The quickest test case recorded during the selected period, establishing a baseline for lightweight checks.
  • Slowest Test: The single longest-running test is a clear target for optimization or splitting.
  • Average Test Duration: The mean runtime per test case, helping you estimate total suite duration.

Beyond raw numbers, the visual elements bring the data to life:

  • Slowest Test Cases: Lists the top optimization targets, showing average duration, frequency, and trend (whether getting slower or faster).
  • Pass/Fail History: A dynamic line chart that compares up to 10 tests side by side to visualize stability and confirm fixes.
  • Test Execution Performance: Groups tests into performance bands Excellent, Good, Average, Poor, and Critical so teams know which areas to prioritize.

This lens helps QA engineers and SDETs pinpoint problematic Playwright tests, verify progress, and track test performance trends over time.

Test Case

Test Case

Modern Playwright teams often run the same tests across development, staging, and production environments, but subtle configuration differences can create misleading results.

The Environment view removes that guesswork.

Here’s what it shows:

  • Execution Results by Environment: Tiles showing pass rates, total passed/failed counts, and success percentages per environment.
  • Pass Rate Trends: A time-series line chart that visualizes daily pass rates for each environment, helping you spot exactly when a specific setup started failing.
  • Test Run Volume: Shows how many runs occurred in each environment so you can judge signal confidence.
  • Branch Distribution: Lists how many test runs each branch contributed, so you can detect uneven CI activity.
  • OS Distribution: Highlights which operating systems your Playwright runs on, helping teams balance cross-platform coverage.
Environment

Test Cases Management

The Test Case Management tab in TestDino is a dedicated workspace where teams can create, organize, and maintain all manual and automated test cases within a project. It provides the foundation for structuring test coverage, grouping cases under suites and subsuites, and tracking classifications, automation status, and metadata.

The layout is optimized for clarity: a sidebar shows suite hierarchies, a top bar provides key actions, and the main panel displays test cases in grid or list format.

Key Features:

1. Suite Hierarchy & Management

Organize test cases in nested suites and subsuites to reflect modules, features, or components. This structure makes it easy to manage large repositories.

2. Viewing Modes

Switch between List View (high-density table for bulk actions) and Grid View (visual cards for quick scanning). Both allow inline editing and filtering.

3. Import & Export

Import or export test cases via CSV with mapping, enum alignment, duplicate handling, and validation.

4. Bulk Operations

Update multiple test cases at once—move, tag, reclassify, or modify statuses in batch.

5. Search & Filters

Quickly locate test cases using the search bar or multi-filters for status, automation, priority, type, or tags. Multiple filters can be combined for precise queries.

6. Automation Fields

Track the automation status of each case (Manual, Automated, To Be Automated) and mark cases as Flaky or Muted for stability review.

Workspace Overview

At the top of the workspace, KPI tiles provide a quick snapshot:

  • Total: Total test cases in the project.
  • Active: Cases ready for use.
  • Draft: Cases still in progress.
  • Deprecated: Retired or outdated cases kept for reference.
KPI Tiles

These metrics update dynamically as test cases are created, modified, or reclassified.

Viewing Test Cases

List View: A table layout showing Key, Title, Priority, Type, Tags, Status, Automation, and Severity. Checkboxes and action menus support individual or bulk operations.

List View

Grid View: Card-based layout displaying the same information in a visual format for easy scanning.

Grid View

Search & Filters: Filter by status, automation, priority, type, or tags. Combine filters to create custom queries, e.g., [Status: Active] + [Priority: High] + [Tags: Smoke] shows all high-priority smoke tests.

Suites

Suites structure test cases into logical groups. They can represent features, modules, or components, and support nested subsuites for deeper hierarchies.

  • Hierarchy Model: Suites act like folders. Create root-level suites or nested subsuites to mirror your application’s structure.
Root-Level Suite

Root-Level Suite

  • Edit: Rename or update description.
  • Delete: Remove a suite (test cases move to "Unassigned").
  • Expand/Collapse: Show or hide nested subsuites.
  • Reorder: Drag suites or subsuites within the same hierarchy.
  • Add Subsuite: Create nested suites within a parent.
Subsuite

Test Case Structure

A test case defines a single validation in your system. It includes:

  • Core Information:Title, Description, Key (ID).
  • Classification: Status, Priority, Severity, Type, Behavior, Layer.
  • Automation Fields: Manual/Automated, To Be Automated, Flaky, Muted.
  • Pre/Post-conditions: Required conditions before and after execution.
  • Test Steps: Classic or Gherkin/BDD format with Action, Test Data, and Expected Result.
  • Tags & Custom Fields: For cross-suite grouping and additional metadata.
  • Metadata: Author and timestamps.

Creating & Editing Test Cases

1. New Test Case: Full creation form with all fields.

2. Quick Test Creation in Suite: Add a title instantly in a suite and edit later.

3. From Suite Menu: Pre-selects the suite when adding a new test case.

4. Inline Editing: Open a test case in Sheet View (side panel) or Full-Screen View. Edit any field directly, confirm with a tick, and changes are saved instantly.

Organizing at Scale

Suite Assignment: Primary method for structured organization

Tags: Secondary method for cross-suite grouping (e.g., Smoke, Regression, P1). Use tags to track coverage or run types across suites

When to use what:

  • Suites: Long-term structure, feature/component grouping.
  • Tags: Temporary tracking, cross-release grouping, or test type grouping.

Bulk Operations

Select multiple test cases or suites to perform actions like:

  • Move to another suite
  • Update descriptions, pre/postconditions, classifications
  • Change automation status or flags
  • Add/remove tags
  • Delete (max 200 items at once)

Import & Export

Import CSV: Guided upload with column mapping, enum alignment, duplicate handling, and preview. Unassigned cases are automatically placed in the "Unassigned" suite.

Export CSV: Download selected or filtered test cases, entire suites, or the full project. Exported files match the visible data structure and can be reused for re-imports.

Scenarios:

  • No filters = export all test cases.
  • Filters applied = export only visible results.
  • Selected test cases = export selected.
  • Suite selected = export all test cases within that suite and subsuites.
Upload CSV

Integrations & Collaboration

In modern QA pipelines, testing isn’t just about running checks; it’s about keeping every stakeholder in sync. TestDino’s integrations connect directly with the tools your team already uses, so insights flow where decisions happen.

GitHub Integration:

Playwright runs live in CI, and TestDino works right alongside it. Once connected, TestDino automatically detects test runs from GitHub Actions and posts AI-generated summaries directly to commits and pull requests.

These summaries include:

  • A test results table showing passed, failed, flaky, and skipped counts
  • Total duration and pass rate
  • A detailed Test Failure Analysis grouped by test file and root cause

Teams can review test health instantly, without switching tabs or reviewing through logs. Branch Mapping lets you control exactly where comments appear per branch or environment, keeping noise low and context relevant.

Jira Integration

From any failed or flaky test, you can raise a Jira issue directly in TestDino.

The issue is automatically filled with:

  • Test name, branch, and environment
  • Failure message, duration, and attempt count
  • Error details with code frames and screenshots
  • Links to the TestDino run, Git commit, and CI job

Each Jira ticket contains a complete test context, allowing developers to reproduce failures without manual copy-pasting or log hunting.

Linear Integration:

For teams using Linear, TestDino’s integration makes issue creation just as seamless. From a flaky or failed test, you can instantly create a Linear bug report prefilled with:

  • Test name, file, branch, author, and environment
  • Failure cluster and key error line
  • Short failure history and console excerpts
  • Links to TestDino runs and Git commits

This keeps reports structured and uniform across your workspace, helping teams prioritize and act quickly.

Asana Integration:

For teams managing QA tasks in Asana, TestDino automatically fills task fields such as:

  • Title, test name, and failure details
  • Environment, run ID, duration, and attempts
  • Error type, message, and relevant console output
  • Linked evidence (screenshots, attachments, and CI jobs)

After creating the task, you get an instant confirmation with the Asana task ID and link so tracking fixes stays effortless.

Slack Integration:

TestDino’s Slack App and Slack Webhook bring run insights right into your channels.

  • Slack App (OAuth-based): Environment-aware notifications route test run summaries to specific channels (e.g., #prod-alerts, #staging-updates). Each message includes test results, duration, branch, author, and a link to the detailed run.
  • Slack Webhook: Sends all updates to a single configured channel, ideal for smaller teams or centralized reporting.

Each Slack summary includes:

  • ✅ Status (passed, failed, flaky, skipped)
  • ✅ Counts, duration, environment, and commit info
  • ✅ “View Test Run” button linking back to TestDino evidence

Conclusion

In 2025, test automation isn’t about running tests, but understanding them.

Pass or fail results don’t tell you whether a failure is a real bug, a UI change, or a flaky test. With AI insights, evidence-first triage, PR-aware workflows, and role-specific dashboards, TestDino transforms Playwright testing from noise into clarity.

Whether you’re a QA engineer fighting instability, a developer ensuring stable merges, or a manager tracking release health, TestDino turns Playwright chaos into confidence.

Try TestDino today and experience how AI-powered test intelligence can bring clarity to every Playwright run.

Stop wasting time on
flaky tests broken builds re-run roulette false failures

Get Staretd

Get started fast

Step-by-step guides, real-world examples, and proven strategies to maximize your test reporting success