Test reporting tools: must-have features for QA teams
Modern test reporting tools help QA teams debug failures faster, reduce flaky tests, and ship with confidence. Explore must-have features like AI insights, GitHub PR reporting, and test analytics dashboards.
You run thousands of automated tests a day. Running them is not the problem; assessing their test results is. If you cannot assess the test failures on time, releases slip, and costs escalate.
This guide outlines the essential features of a modern test reporting tool. Real-time results in your PRs, AI that explains failures, role-specific views, and analytics that drive decisions.
If you lead QA, manage multiple test suites, or just want to ship faster, this guide is for you.
Top 5 Must-Have Features in Modern Test Reporting Tools
Choosing the right tool can be a challenge. To help you decide, we've broken down the five most critical features that provide the highest ROI for engineering teams.
A centralized reporting platform solves four critical problems:
- Fragmented data
- Slow failure triage
- Limited visibility
- Poor traceability
The business impact is measurable. Teams with proper test reporting reduce mean time to resolution and ship more frequently.
1. AI Insights that actually explain failed/flaky tests
Your test fails. Is it a real bug or a flaky test? Traditional tools make you dig through logs for 20 minutes to find out. AI-powered reporting tools answer this question in seconds.
The problem isn't just speed. Without intelligent classification, teams waste hours debugging phantom issues.
A timing-sensitive test fails intermittently, triggering investigations into application code that's perfectly fine. Meanwhile, actual bugs hide in the noise of false positives.
Modern AI insights must do three things:
- Classify failures accurately (product bug/ test issue/ environment problem)
- Provide evidence for each classification
- Learn from corrections to improve future accuracy
TestDino's Solution
TestDino’s AI model works behind the scenes to help you understand why tests fail, prioritize issues, and suggest solutions. Instead of leaving you guessing, it breaks down failure patterns and gives you clear, actionable insights.
How AI Insights Work for Each Test Run
- Error Variants: Identifies issues like timeouts, missing elements, or network errors.
- AI Categorization: Labels failures as bugs, UI changes, or unstable tests.
- Failure Patterns: Tracks new failures, regressions, and consistent issues across runs.
Three Levels of Analysis in the AI Insights Tab
- Overview: Failure categories with counts, top affected tests, and a Failure Patterns table flagging persistent and emerging issues
- Analysis Insights: Error trends over time, category breakdowns by branch, and prioritized fix recommendations
TestDino's feedback loop ensures continuous improvement. Engineers can correct classifications with one click. The system learns from these corrections, improving accuracy for similar failures.
This turns 30-minute debugging sessions into 2-minute decisions.
2. Role-Specific Dashboards without information overload
Different stakeholders need different data slices. Executives want to release confidence metrics. Developers need failure details scoped to their code. QAs require comparison of environments and defect trends.
Effective dashboards must adapt to each role:
- QA Engineers: Pass/fail breakdowns, flaky test highlights, failure categories with counts
- Developers: PR-specific failures, commit-linked issues, environment consistency checks
- Managers: Release readiness scores, trend visualizations, team performance metrics
TestDino's dashboard aggregates data across your project and adapts to your role.
You see stability first. The view shows pass/fail totals, highlights flaky tests with retry signals, and groups failures by cause.
Two AI panels separate actual bugs from UI changes and unstable tests so you can send the work to the right owner. Typical workflow:
- Find and triage flaky tests fast.
- See failure categories with counts and recent change.
- Compare environments to locate setup issues.
- Track average duration to spot slow suites.
You get fast feedback tied to your code. The view lists active blockers and ready-to-ship PRs with commit, author, and check status.
Branch Health shows pass rate and totals over time. Flaky test alerts include failure rate and a link to the run history. Typical workflow:
- See which tests failed after your last commit.
- Confirm if a failure is a bug, a flaky test, or a UI change.
- Check environment consistency before merging.
- Watch the branch health to decide when to ship.
The outcome: QA triages faster and developers fix issues with PR-scoped context, and managers make informed ship decisions.
3. GitHub Integration that surfaces results where work happens
Developers live in GitHub. Making them switch to another tool to check test results breaks their flow and wastes time. Your test reporting tool must embed results directly in pull requests.
Essential GitHub integration features include:
- Test results are visible in PR checks.
- Links from failures to specific code lines.
- Real-time status updates as tests run.
- Clear feedback on failure type.
TestDino publishes test results directly in GitHub. Developers see test status without leaving the PR. Each failure links to the specific run with full context. The system automatically flags instability near the changed code.

This integration reduces context switching and accelerates the feedback loop from hours to minutes.
4. One-click issue creation with full context
Manual copy-paste from test results to Jira wastes hours and loses context. Your reporting tool should create tickets with full failure details in one click.
Critical integration capabilities:
- Single-click issue creation in Jira or Linear
- Two-way linking between test runs and tickets
- Configurable alerts based on failure patterns
- Complete failure context without manual data entry
TestDino automatically creates Jira, Linear, or Asana issues with full failure details. Two-way linking ensures updates sync between systems.
Slack integration posts run summaries to team channels with configurable alerts based on whether a test passed, failed, or was Flaky.
5. Analytics that drive decisions, not just display data
Pass/fail percentages tell you nothing about test health. You need deeper metrics to spot problems before they block releases.
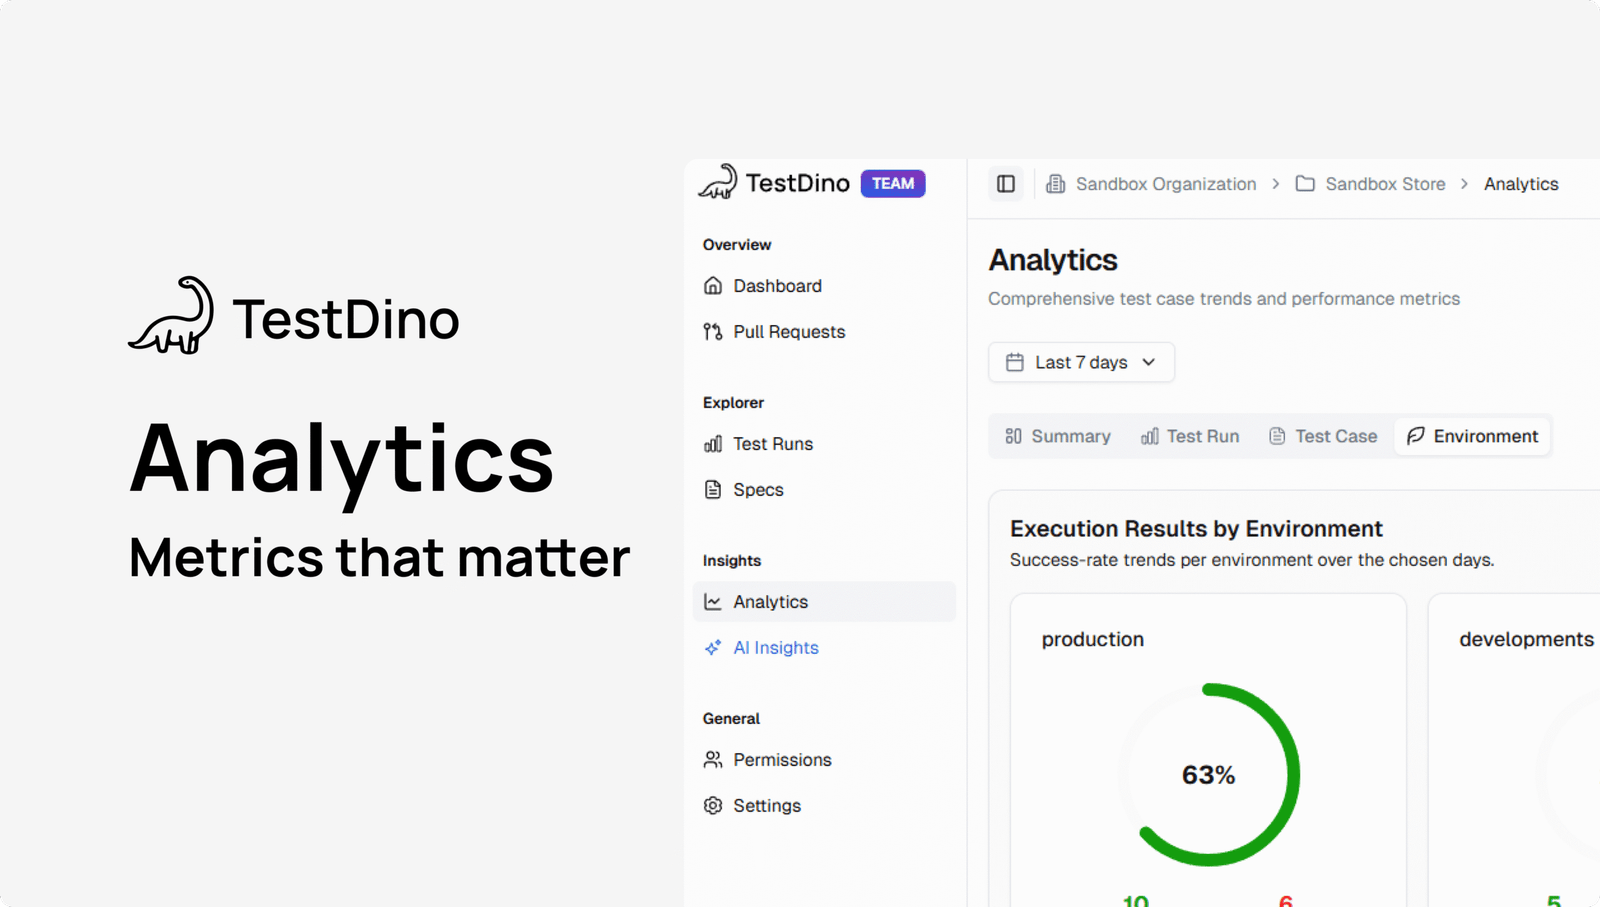
Analytics turns all your test activity into clear, simple trends. It shows what’s failing, what’s flaky, where time is going, and which environments slow you down.
This helps you spend less time guessing and more time fixing the right things:
- Spot real problems fast: See where failures concentrate and if they are new or repeating.
- Cut noise: Find and reduce flakiness so reviews are not blocked by random reds.
- Speed up feedback: Identify which files, tests, or environments are slow and trim the tail.
- Prove progress: Trends make it obvious when stability or speed actually improves.
Analytics Capabilities
TestDino's analytics are organized into key views:

- Summary: Shows total test runs, average runs per day, and how many passed or failed. It tracks flakiness and new failure rates to spot unstable tests.
- Test Run: Tracks average and fastest run times, letting you measure how quickly your tests complete. It highlights speed improvements and breaks down performance by branch.
- Test Case: Shows average, fastest, and slowest test durations to help you spot which tests need speed improvements. You can compare pass/fail trends for selected test cases to track reliability.
- Environment: Quickly shows which environments and branches have the most test failures. It helps you spot where problems cluster and track pass rates over time.
6. Complete Test history per Pull Request
Developers spend hours in GitHub's PR interface, but they're completely blind to the testing story behind their PRs.
A single PR often triggers 5, 10, or even 15 test runs as teams retry failed pipelines, yet this critical information remains scattered across CI logs and dashboards.
The problem compounds when developers can't answer basic questions:
- How many times has this PR been retried?
- Are the same tests failing consistently or different ones each time?
- Is this a real bug or just flaky tests blocking the merge?
- Why did the previous 4 attempts fail before this one passed?
Without this visibility, teams resort to blind retriggering, hoping the next run will pass. They waste CI resources, delay deployments, and frustrate reviewers who see the same PR cycling through test runs without understanding why.
The interface looks and feels like GitHub's PR page, so there's zero learning curve. Developers instantly recognize patterns like "same 3 tests failing across 5 retries" (a real bug) versus "different failures each time" (an infrastructure issue).
This transparency reduces blind retriggers by 30% and helps teams make informed decisions about whether to debug, retry, or escalate.
By bringing test visibility directly into the PR workflow developers already use, TestDino transforms guesswork into data-driven decisions.
How to Choose the Right Test Reporting Tool for Your Team
| Feature | Importance | What to Look For |
|---|---|---|
| AI insights | Critical |
|
| Confidence & feedback on labels | High |
|
| Role-specific dashboards | High |
|
| GitHub PR checks | Critical |
|
| Test runs per PR | High |
|
| Analytics & trends | Critical |
|
| Duration insights | High |
|
| Branch/env comparisons | High |
|
| Helpful artifacts | High |
|
| Defect workflow (Jira/Linear/Asana) | Critical |
|
| Collaboration alerts (Slack OAuth App) | High |
|
| Setup & CI fit | Critical |
|
Conclusion
Test reporting tools are mandatory for shipping quality software at speed.
The right platform integrates with CI/CD pipelines, provides AI-powered insights, offers role-specific dashboards, connects to existing tools, and delivers actionable analytics.
TestDino exemplifies these principles through Playwright-native reporting, AI classification, role-focused views, and PR-aware summaries. Teams using modern test reporting accelerate development cycles while maintaining quality.
The difference between chaos and clarity is choosing the right test reporting tool. Start a free trial of TestDino and get actionable insights from your test automation in minutes!
FAQs
A test reporting tool helps teams manage the results of automated tests by consolidating data into one dashboard. It shows which tests passed, which failed, and why, so developers and QA can debug faster.
TestDino’s AI automatically classifies failures as real bugs, flaky tests, or environment issues. It also provides supporting evidence like traces, logs, and screenshots, making it easy to see the root cause without hours of manual debugging.
Yes. TestDino integrates directly into GitHub pull requests to show test results in real time. It also creates Jira or Linear tickets with one click, including full context from the failing test.
Unlike traditional tools that only show pass/fail counts, TestDino provides AI-driven insights, role-specific dashboards, full PR test histories, and actionable analytics. This reduces wasted time on flaky tests and helps teams ship faster with confidence.
Table of content
Flaky tests killing your velocity?
TestDino auto-detects flakiness, categorizes root causes, tracks patterns over time.


