Top 5 Trunk Alternatives for Test Reporting
Trunk quarantines flaky tests to keep CI pipelines moving. For deeper failure intelligence, debugging, and test management, these alternatives start with TestDino.


Trunk is a CI reliability platform. Its flaky test detection identifies unstable tests through statistical analysis, quarantines them to prevent them from blocking pipelines, and integrates with Jira and Linear for ticket tracking. AI-powered failure clustering groups similar errors and tracks stability trends over time.
What Trunk does not do is provide test reporting. There are no test run dashboards, no failure analytics views, no debugging evidence panels, no trace viewers, and no test case management. When teams search for Trunk alternatives, they are usually looking for the test reporting platform and intelligence layer that sits on top of what Trunk provides.
The good news is that Trunk and reporting platforms are complementary. Trunk handles CI/CD pipeline reliability. A reporting platform handles test intelligence. Some teams use both.
Here are the 5 best Trunk alternatives for teams that need test reporting and test execution analytics in 2026.
Best 5 Trunk Alternatives
We have researched and evaluated several tools to compile this list of the best Trunk alternatives. The key considerations we examined are ease of setup, test reporting depth, CI/CD integration, AI failure analysis, scalability cost, Playwright support, and pricing model.
The list is carefully selected to help QA teams, test leaders, and engineering managers in identifying the right solution for their testing and automation needs.
How to Compare Trunk Alternatives
Here is a quick comparison of the top alternatives to Trunk that can help you identify your preferred test reporting tool:

TestDino
|

Trunk
|

Allure TestOps
|

Datadog
|

ReportPortal
|
|
|---|---|---|---|---|---|
| Pricing (starts at) | $49/month | Free (up to 5 committers) | $30/user/month | Per-committer (usage-based) | $599/month (SaaS) |
| Best for | Playwright test intelligence & management | CI reliability and flaky quarantine | QA teams with structured test workflows | Teams monitoring CI inside Datadog | Self-hosted open-source reporting |
| Framework support | Playwright | Framework-agnostic (via JUnit XML) | Multi-framework (via adapters) | Playwright & More | Playwright & More |
| Ease of use |  |
 |
 |
|
|
Getting Started  |
|||||
| Reporting & Dashboards |
|||||
| Debugging & Evidence |
|||||
| AI Test Intelligence |
|||||
| CI/CD Optimization |
|||||
| Test Management & Integrations |
|||||
| Pricing |
|||||
| Try for free | |||||


Best Trunk Competitors for Test Reporting and Analytics
Here are the 5 best alternatives to Trunk for teams that need test reporting alongside CI reliability:
1. TestDino
$49 /month
Best for:
Playwright-first teams that need test reporting, test management, and CI/CD optimization in one platform, without stitching multiple tools together.
Platform type:
Test reporting, dashboards, test management, and CI observability platform for Playwright
Integrations with:
GitHub Actions, GitLab CI, Azure DevOps, TeamCity, Jira, Linear, Asana, monday, Slack
Key Features:
-
Test management and automated reporting in one place
-
AI failure classification into 4 categories
-
Built-in trace viewer with DOM snapshots and network logs
-
Error grouping by message and stack trace
-
GitHub CI Checks as merge quality gates
-
Rerun only failed tests to cut CI pipeline time
-
MCP Server for AI agent queries from your IDE
-
Flaky test detection across run history
-
AI summaries posted to GitHub commits
-
Real-time results streaming via WebSocket
-
Code coverage per file breakdown
Pros
-
Playwright-native with under 10-minute setup
-
Test management and automated reporting on the same platform
-
Broad CI/CD support: GitHub Actions, GitLab CI, Azure DevOps, TeamCity
-
AI summaries posted to GitHub commits, GitLab MRs, and Slack
-
1-click bug filing into Jira, Linear, Asana, or monday
-
Affordable at $39/month billed annually
Cons
-
Purpose-built for Playwright (multi-framework support on the roadmap)
First Hand Experience
Trunk tells you which tests are flaky and prevents them from blocking your pipeline. That solves the CI reliability problem. But it does not answer what comes next: which of the non-flaky failures are actual defects? What changed between yesterday's passing run and today's failures? Which tests are getting slower over time?
TestDino provides the test failure root-cause analysis and reporting layer that Trunk leaves out. AI Insights classifies every failure into Actual Bug, UI Change, Unstable Test, or Miscellaneous. Error grouping clusters related failures by message and stack trace, reducing the list of failures to a short list of root causes.
Test management and automated reporting live on the same platform. Manual test cases sit in suites up to 6 levels deep with ownership, custom fields, and version history. The Test Explorer shows both manual and automated tests side by side, sortable by flaky rate, tags, and coverage status.
Debugging That Saves You from Re-running Locally
Each failed test in TestDino comes with screenshots, video, browser console logs, and a trace you can step through action by action. Available right after the CI run finishes.
Bug filing is 1-click into Jira, Linear, Asana, or monday, pre-filled with error details, stack trace, failure history, and links to the run and CI job.
CI/CD Speed and Merge Safety.
Rerun failed tests re-executes only failures, not the full suite. Works across sharded runs and different CI runners.
GitHub CI Checks adds quality gates to your PRs. Set a minimum pass rate, mark critical tags as mandatory, and configure different rules per environment. AI-generated summaries are posted to GitHub commits and GitLab merge requests with pass/fail/flaky counts.
Flaky Test Detection That Tells You Why
Flaky test detection classifies unstable tests by root cause: timing-related, environment-dependent, network-dependent, or assertion-intermittent. Each test gets a stability percentage, and you can compare flaky rates across environments to spot infrastructure problems.
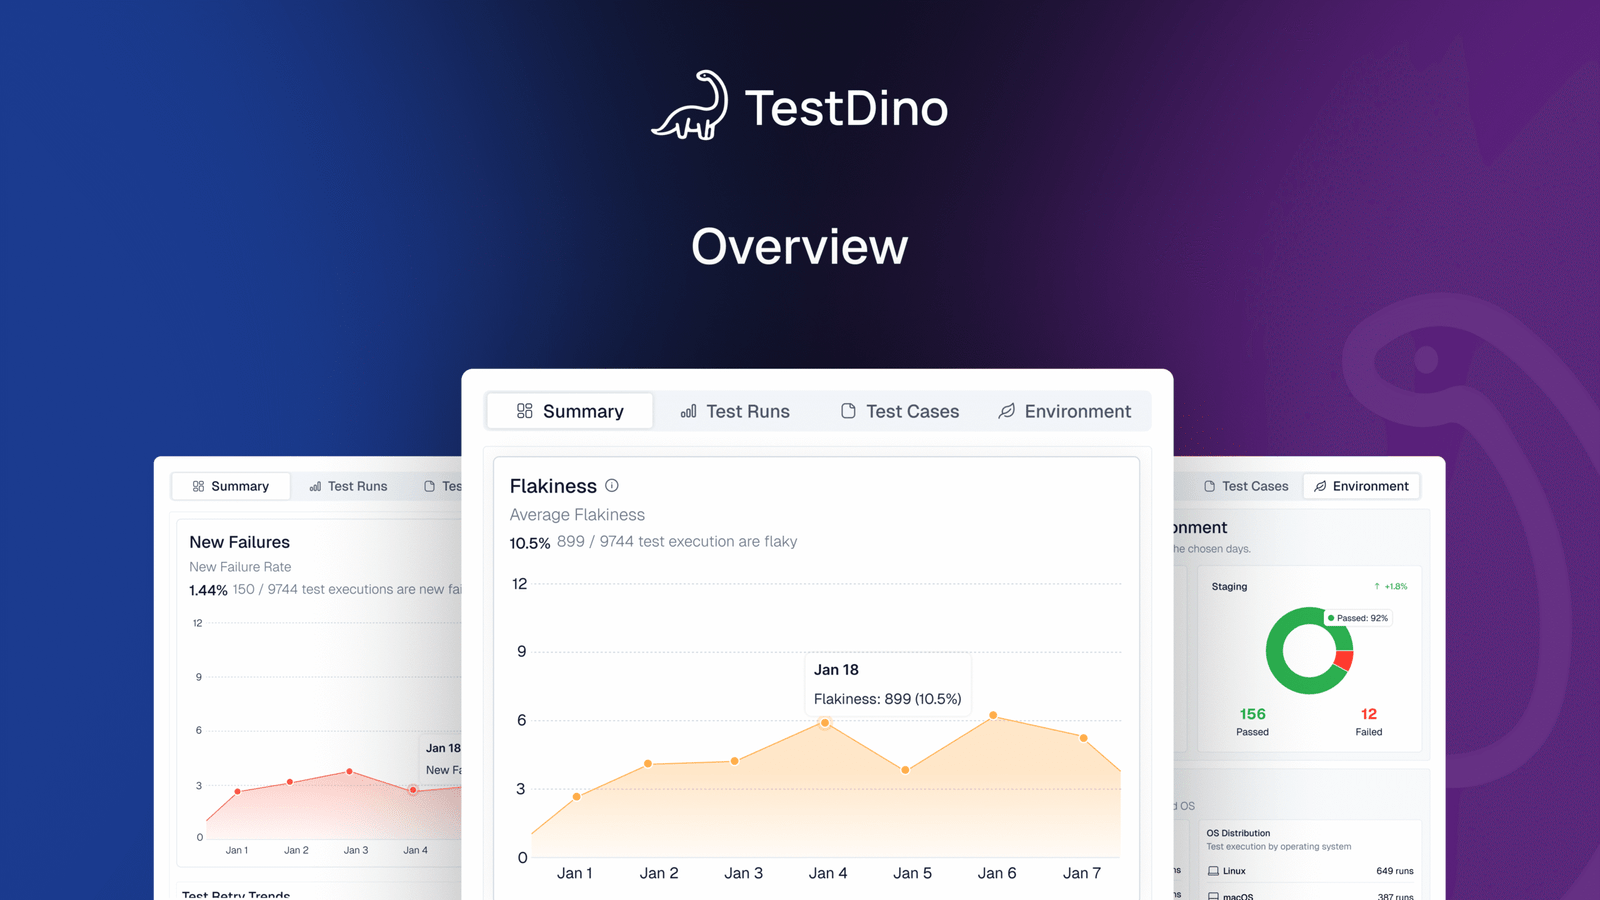
Real-Time Streaming and Scheduled Reports
Results appear on the dashboard as each test completes via real-time streaming, not after the full suite finishes. Automated PDF reports deliver test health summaries on daily, weekly, or monthly schedules. Slack notifications send run summaries filtered by environment and branch.
MCP Server for AI-Assisted Workflows
The MCP Server connects your AI assistant (Cursor, Claude Code, Copilot) to your test data. List test runs, pull debugging context, perform root cause analysis, and manage manual test cases through natural language. It covers both automated debugging and test management without switching tools.
Pricing & Value
| Community | Pro Plan | Team Plan | Enterprise |
|---|---|---|---|
| Free | $39 /month (billed annually) |
$79 /month (billed annually) |
Custom |
Pricing may vary. Check the pricing page for the latest details.
Final Verdict
For Playwright teams evaluating tools like Trunk, the question is rarely "which tool replaces Trunk?" It is "what fills the gap Trunk leaves open?"
Trunk handles flaky test quarantine and CI pipeline reliability well. But it stops at detection. It does not classify failures, provide trace-level debugging, or manage test cases. TestDino fills that gap with AI failure classification, an embedded trace viewer, error grouping, and test management on the same platform.
The two tools solve adjacent problems. Teams can use Trunk alongside TestDino, or use TestDino alone since it includes flaky detection with root cause categories alongside the full reporting and CI analytics stack. At $39/month billed annually, the reporting layer costs less than the engineering time your team spends manually triaging failures that Trunk flags but cannot explain.
2. Allure TestOps

Allure TestOps Alternatives, Allure TestOps Review, Allure TestOps Comparison, Allure TestOps vs TestDino
Best for:
QA teams with formal test management processes that need structured reporting workflows.
Platform type:
Test management and reporting platform
Integrations with:
Jira, GitHub, GitLab, Jenkins
Key Features:
-
Test case organization with launch history
-
CI/CD adapter integrations
-
Configurable dashboards via AQL queries
-
Access control and permissions
-
Report exports and sharing
Pros
-
Established feature set for structured QA
-
Works across multiple test frameworks
-
Configurable dashboards and reports
Cons
-
Setup and adapter configuration require effort
-
Smaller teams may find the overhead heavy
-
Reporting requires manual dashboard building
First Hand Experience
Allure TestOps provides a structured workspace for organizing test cases and viewing launch results. The platform works best when teams have defined QA processes and the bandwidth to set up adapters and configure dashboards. Teams looking for faster onboarding and built-in failure intelligence may find the configuration effort slows time-to-value compared to lighter Trunk alternatives.
Pricing & Value
Custom pricing. Targets teams that need formalized test management with governance.
Final Verdict
Allure TestOps fits teams that follow structured QA processes and need a management layer alongside reporting. For teams prioritizing fast setup and focused Playwright test analytics, lighter platforms get to value faster.
3. Datadog Test Optimization

DataDog Alternative, DataDog Review, DataDog Comparison, DataDog vs TestDino
Best for:
Teams already using Datadog for system monitoring who want test run visibility in the same dashboard.
Platform type:
CI pipeline monitoring with test analytics add-on
Integrations with:
CI/CD, Slack, Jira, PagerDuty
Key Features:
-
Test run visibility inside CI pipeline views
-
Flaky test detection and tracking
-
Custom dashboards and alert rules
-
Test execution tracing with flame graphs
-
CI pipeline performance metrics
Pros
-
Fits well if Datadog is already your monitoring tool
-
Flaky test detection is mature
-
Good CI pipeline-level visibility
Cons
-
Built for system monitoring, not test reporting
-
QA teams find the interface complex and broad
-
Costs grow with data ingestion and retention
First Hand Experience
Datadog Test Optimization adds test analytics to an existing continuous integration monitoring stack. It works best when your team already uses Datadog for infrastructure and wants test data in the same place. QA engineers navigate through system monitoring interfaces to reach test-specific insights. Teams looking for focused test reporting or test management will need to pair it with a separate tool.
Pricing & Value
Per-committer, usage-based pricing. Test spans are retained for 3 months.
Final Verdict
Datadog fits teams already using it for system monitoring. For QA-led teams that need focused test reporting and management alongside CI reliability, purpose-built platforms offer a more direct path.
4. ReportPortal

ReportPortal Alternatives, ReportPortal Review, ReportPortal Comparison, ReportPortal vs TestDino
Best for:
Teams that want self-hosted, open-source test reporting with ML-based failure pattern matching.
Platform type:
Open-source test reporting platform (self-hosted or SaaS)
Integrations with:
Jenkins, GitHub, GitLab, Jira, Rally
Key Features:
-
ML-based pattern matching for failure clustering
-
Custom dashboard widgets for run data
-
Multi-framework result aggregation
-
Self-hosted with full data control
-
Launch-level run history
Pros
-
Open source with self-hosting option
-
Supports many test frameworks
-
Persistent history across launches
Cons
-
Setup requires Docker Compose and maintenance
-
SaaS starts at $599/month
-
Limited Playwright-specific debugging features
First Hand Experience
ReportPortal aggregates test results from multiple frameworks and uses ML-based pattern matching to identify recurring failure clusters. The self-hosted option gives full data control. Setup requires Docker Compose, database configuration, and ongoing infrastructure maintenance. Teams looking for managed platforms with quick onboarding may find the operational overhead significant compared to the reporting value for Playwright teams.
Pricing & Value
Free (open source, self-hosted). SaaS starts at $599/month for the Startup tier.
Final Verdict
ReportPortal is a solid open-source Trunk alternative for teams that want self-hosted reporting with ML-based failure analysis. For teams that prefer managed Playwright-specific intelligence with faster setup, simpler options exist without the infrastructure burden.
5. BrowserStack Test Reporting & Analytics

BrowserStack Test Reporting Alternative, BrowserStack Test Reporting Comparison, BrowserStack Test Reporting Review, BrowserStack Test Reporting vs TestDino
Best for:
Teams that want multi-framework test analytics with AI failure tagging.
Platform type:
Test analytics platform with AI failure categorization
Integrations with:
Jira, CI/CD tools, Slack
Key Features:
-
AI-based failure reason categorization
-
Flaky test detection with smart tags
-
Timeline debugging with consolidated logs
-
Custom dashboards with widgets (Pro)
-
Build verification rules for CI gates
Pros
-
AI failure tagging across test frameworks
-
Flaky detection with smart tags
-
Works standalone or with BrowserStack execution
Cons
-
Pro tier starts at $299/month
-
No test case management built in
-
SDK integration required per framework
First Hand Experience
BrowserStack Test Reporting provides failure categorization, flaky detection, and timeline debugging across test frameworks. It works with or without BrowserStack execution infrastructure. The Pro tier at $299/month adds custom dashboards and quality gates. Teams that need test management or Playwright-specific trace viewing may find the analytics focused on broad multi-framework coverage rather than Playwright depth.
Pricing & Value
Free tier with 30-day retention. Pro starts at $299/month billed annually.
Final Verdict
BrowserStack Test Reporting is a capable multi-framework analytics tool for teams that need broad coverage. For Playwright-focused teams evaluating Trunk alternatives at a lower price point, purpose-built Playwright platforms offer more depth per dollar.
What to look for in a Trunk alternative for test reporting
Trunk solves CI reliability. These Trunk competitors solve test intelligence. If you are looking for the best trunk replacement that covers both, here is what to prioritize when adding a reporting layer to your pipeline.
Failure intelligence beyond flaky quarantine
Trunk identifies flaky tests and quarantines them. That keeps your CI pipeline stable. But not every failure is a flake. Some are real defects, some come from UI refactors, and some are environment-specific problems that only surface in certain CI runners.
A test reporting platform should classify failures by type automatically, so your team knows what requires a code fix, what needs investigation, and what is safe to skip. Without that classification, someone on the team still has to open each failure and decide manually. That is the gap between CI reliability tools and test intelligence platforms.
Test management alongside CI reliability
When a test fails in CI, you need more than a stack trace and a failure reason. Screenshots, video recordings, console logs, and Playwright traces let you step through each action the test performed before failing.
Trunk provides failure reasons and stack traces. A reporting platform that includes a built-in trace viewer eliminates the need to reproduce failures on your local machine. For Playwright teams specifically, trace-level debugging with DOM snapshots and network logs reduces the time between "this test failed" and "here is why."
Analytics that cover test health, not just pipeline health
If your test cases live in a spreadsheet and your automated results sit in Trunk's flaky test dashboard, the two are disconnected. You cannot easily answer "what percentage of our test cases are automated?" or "which suites have the most failures this sprint?"
Platforms that integrate test management with automated reporting give you a single view of test suite health, automation progress, and coverage. For small teams, especially, maintaining separate tools for management and reporting creates overhead that a single platform eliminates.
Playwright-specific debugging and trace viewing
Trunk shows which tests are currently flaky or broken. That is useful for today's decision. Test analytics should also track how things change over time: failure trend progression, flaky rate per test case, changes in run duration, and code coverage movement across releases.
Historical context turns reactive debugging into proactive quality improvement. If your analytics tool only shows the current snapshot, you lose the ability to catch regressions early or measure whether your stability efforts are working.
Predictable pricing and transparent plans
Trunk's free tier covers up to 5 committers with the Team plan at $0/committer/month. Most reporting tools charge per user, per committer, or per usage tier. For small engineering teams evaluating trunk alternatives, predictable cost matters.
Flat monthly pricing for the reporting layer lets you add it to your existing CI stack without worrying about cost overlap or unpredictable scaling as your team grows. Compare the per-committer model against flat-rate plans to see which fits your budget and team size.
Wrapping Up
Trunk detects and quarantines flaky tests, keeping your pipeline stable. It does not provide test reporting, failure debugging, or analytics dashboards, which is why teams search for Trunk alternatives that fill those gaps.
Allure TestOps offers structured test management with configurable dashboards. Datadog adds test visibility to system monitoring. ReportPortal provides self-hosted ML-based reporting. BrowserStack delivers multi-framework analytics with AI failure tagging.
For Playwright-first teams that need the reporting and intelligence layer Trunk does not provide, including AI failure classification, test management, flaky detection with root cause categories, and CI/CD optimization, TestDino combines test intelligence, management, and reporting at $39/month billed annually.
FAQs
Table of content
Flaky tests killing your velocity?
TestDino auto-detects flakiness, categorizes root causes, tracks patterns over time.
Follow Us