Choosing the right Playwright reporting and analytics tool can be challenging. Many teams start with the default Playwright HTML reporter, but it often falls short for cross-run analytics, debugging at scale, and team-wide visibility. Teams report limited customization, integration support, analytical depth, and no shared view of test quality.
The gap has led CTOs, project managers, QA leads, and DevOps managers to seek tools that provide faster debugging, in-depth analytics, and simpler adoption.
This guide walks through TestDino, a Playwright test intelligence platform built to debug, manage, and ship Playwright tests in CI at scale for efficient test analytics and streamlined debugging. Teams save 6–8 hours per engineer every week.
A Single Solution for Every Role on Your Team
A single UI enables test suite management for everyone, but the pain feels different depending on your role.
For QA Engineers
You spend hours trying to gather enough evidence for a reproducible bug report, only to have it sent back as "cannot reproduce". You can see a test failing intermittently, but lack the historical data to prove it's a chronic issue that needs priority.
For Developers
You push a commit, and then you wait. The CI pipeline takes forever 🕐, and when it finally fails, the error message is cryptic. You can't easily access the screenshots, videos, or traces you need to debug effectively. The slow, unclear feedback loop is killing your productivity.
For Managers
You're responsible for delivery, but you lack true visibility. Is the team's testing effort actually improving product quality? Is the pass rate going up because the product is more stable, or because flaky tests are being silenced?
You need a clear, data-driven picture of test suite health to ensure releases are safe to ship, but you're operating in the dark.
This is where we bring the solution. TestDino strengthens your Playwright reporting and acts as a central Playwright dashboard that unifies your team around a single, clear view of test quality, giving everyone the exact insights they need, fast.
Setup in Minutes, Not Hours
Adopting a new testing tool often becomes a heavy project with complex code changes, custom frameworks, and weeks of engineering effort before you see value.
TestDino removes the friction by working within the default Playwright reporter setup, so your team can adopt it without rewriting test utilities or framework code.
It is designed for a fast and minimal setup. You can upload your first report within minutes because it integrates cleanly with your existing Playwright configuration.
Fast and Playwright-Native
TestDino utilizes the default built-in Playwright reporter system, so you can begin collecting structured test data instantly. You do not need a custom framework or any code refactoring. Adding the standard reporter to your Playwright config file is enough, and a simple command in your CI workflow uploads the report directory after each run.
This lightweight setup keeps your Playwright test reporting fast and transparent across all environments, without rewriting any tests or pipelines.
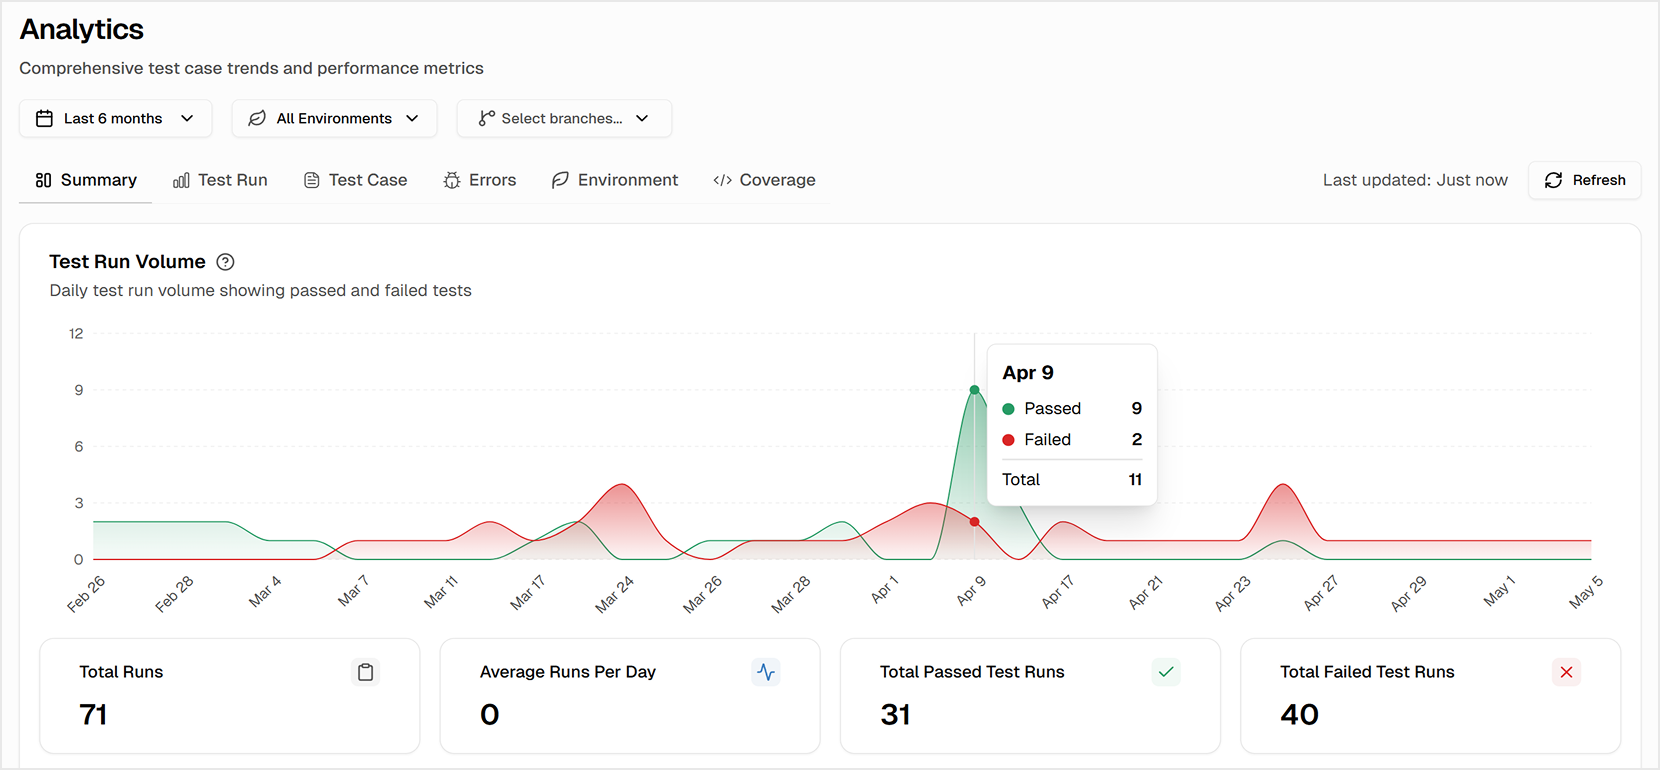
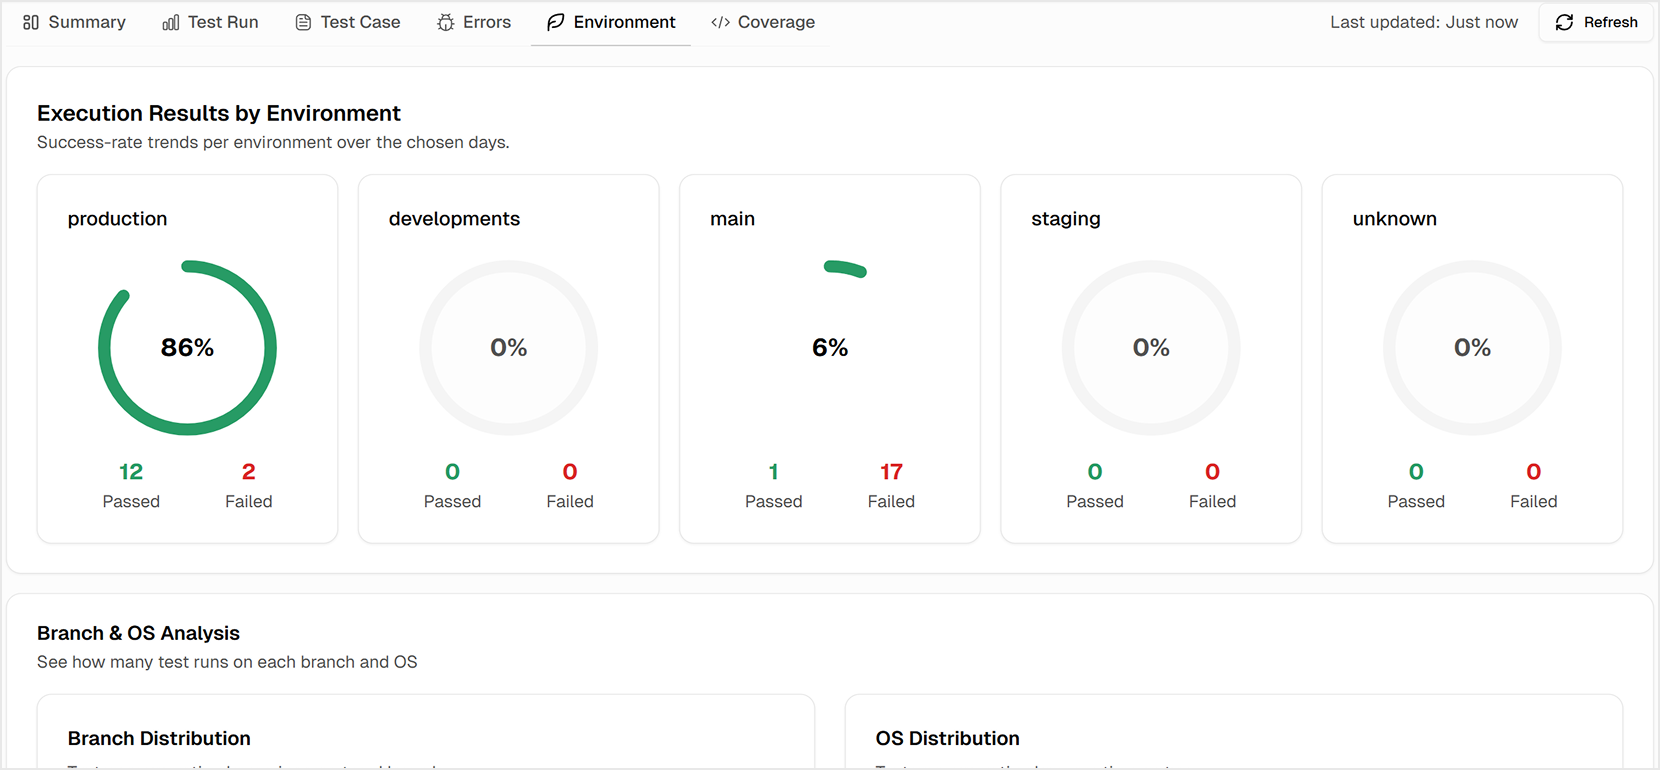
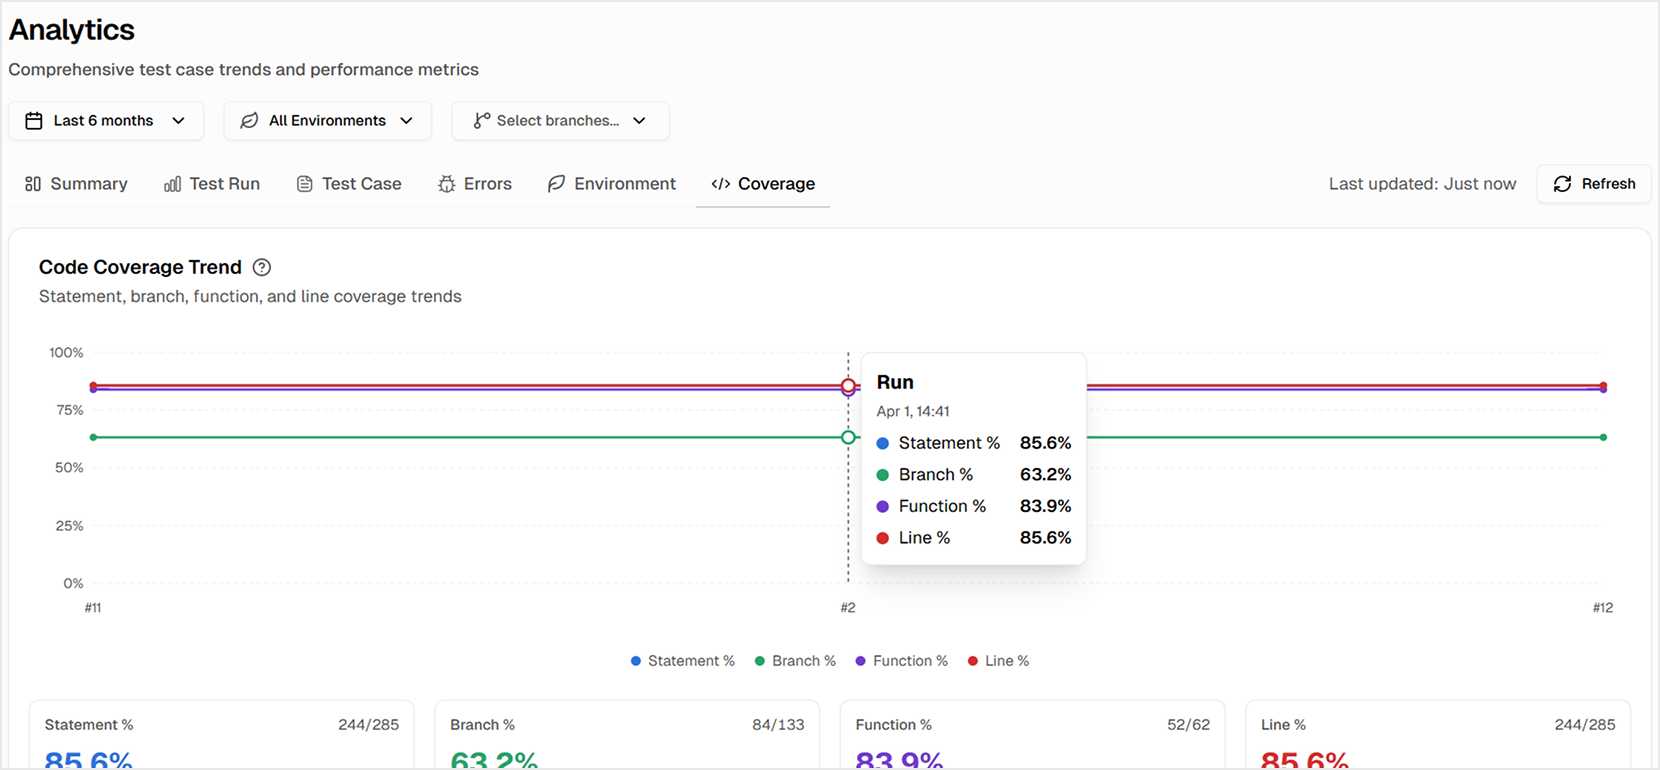
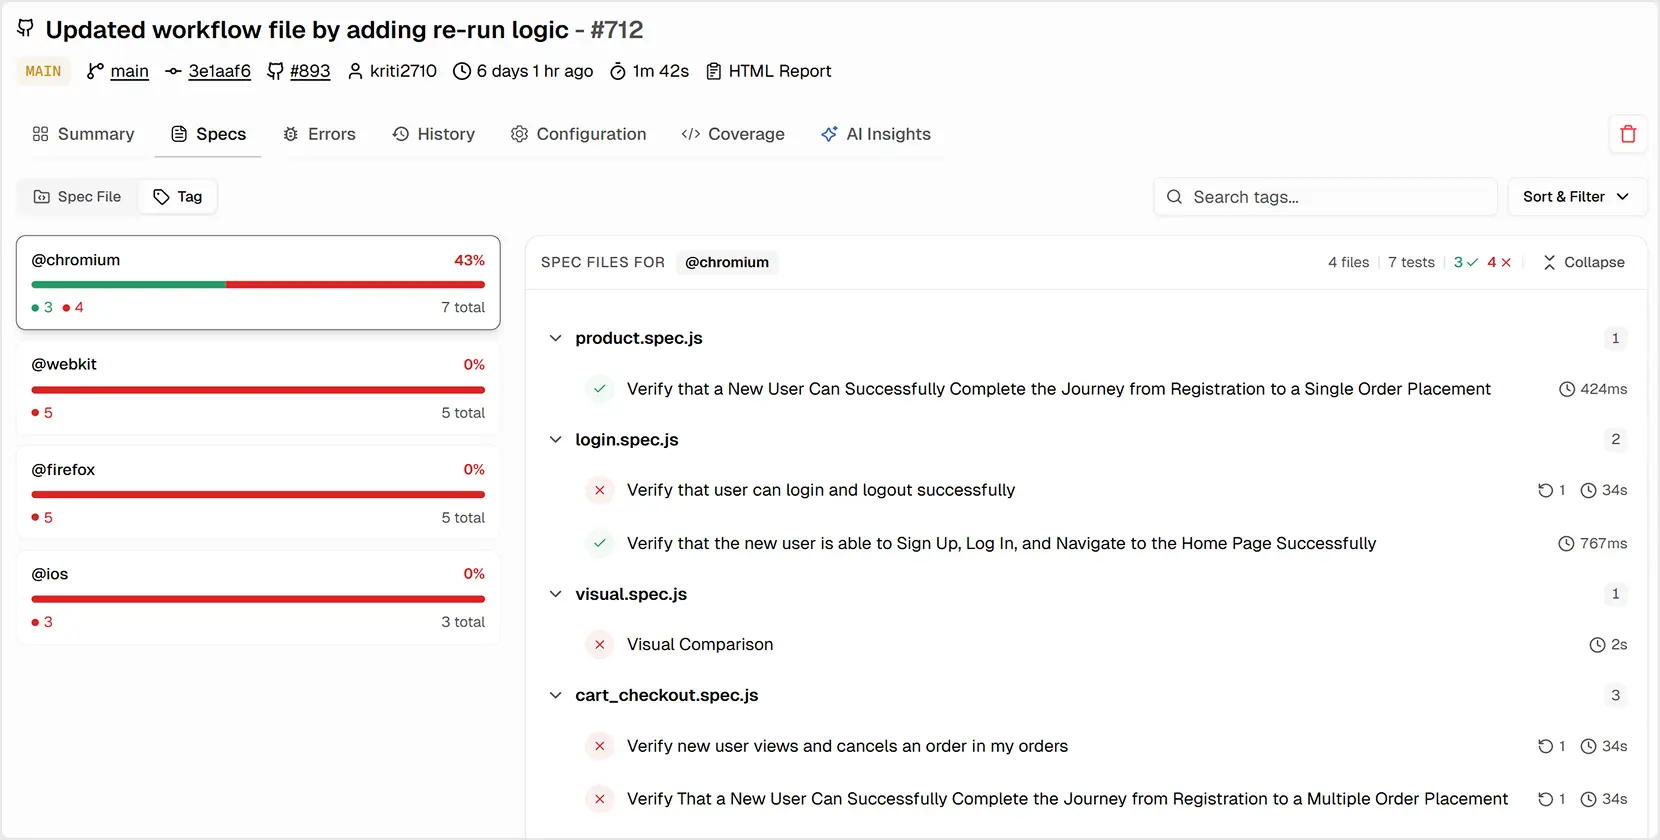
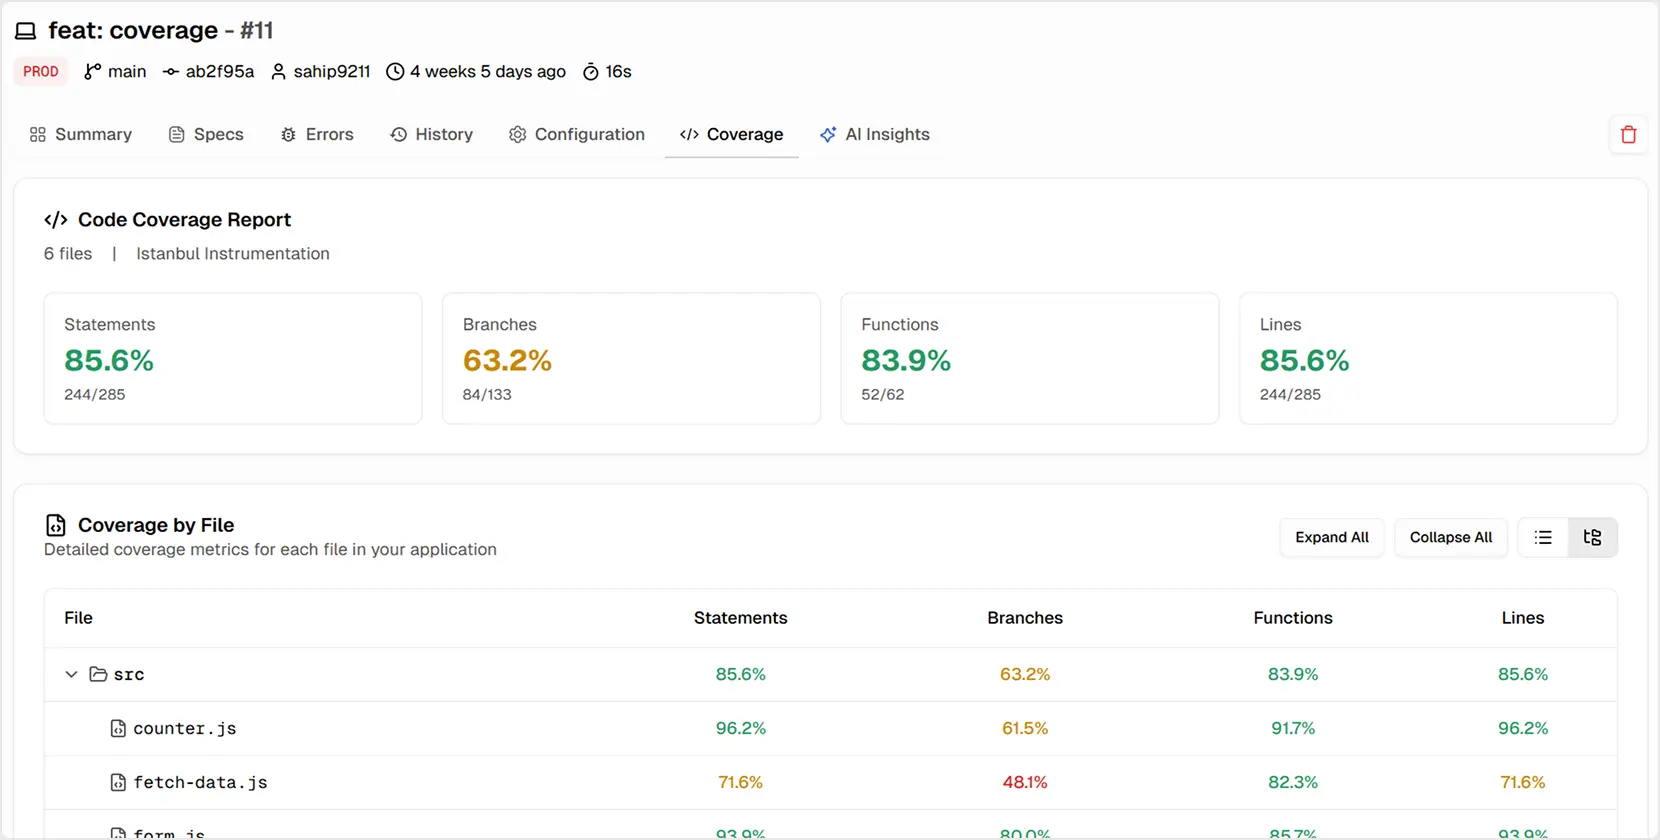
The 7 Tabs of a Test Run
This lightweight setup keeps your Playwright test reporting fast and transparent across all environments, without rewriting any tests or pipelines.
Together, these tabs form a complete Playwright Dashboard experience that covers both technical debugging and historical analysis.
Full Playwright Videos
TestDino captures and stores full video recordings of your Playwright test executions. Watch exactly what happened during a test failure - every click, navigation, and assertion - without needing to reproduce the issue locally.
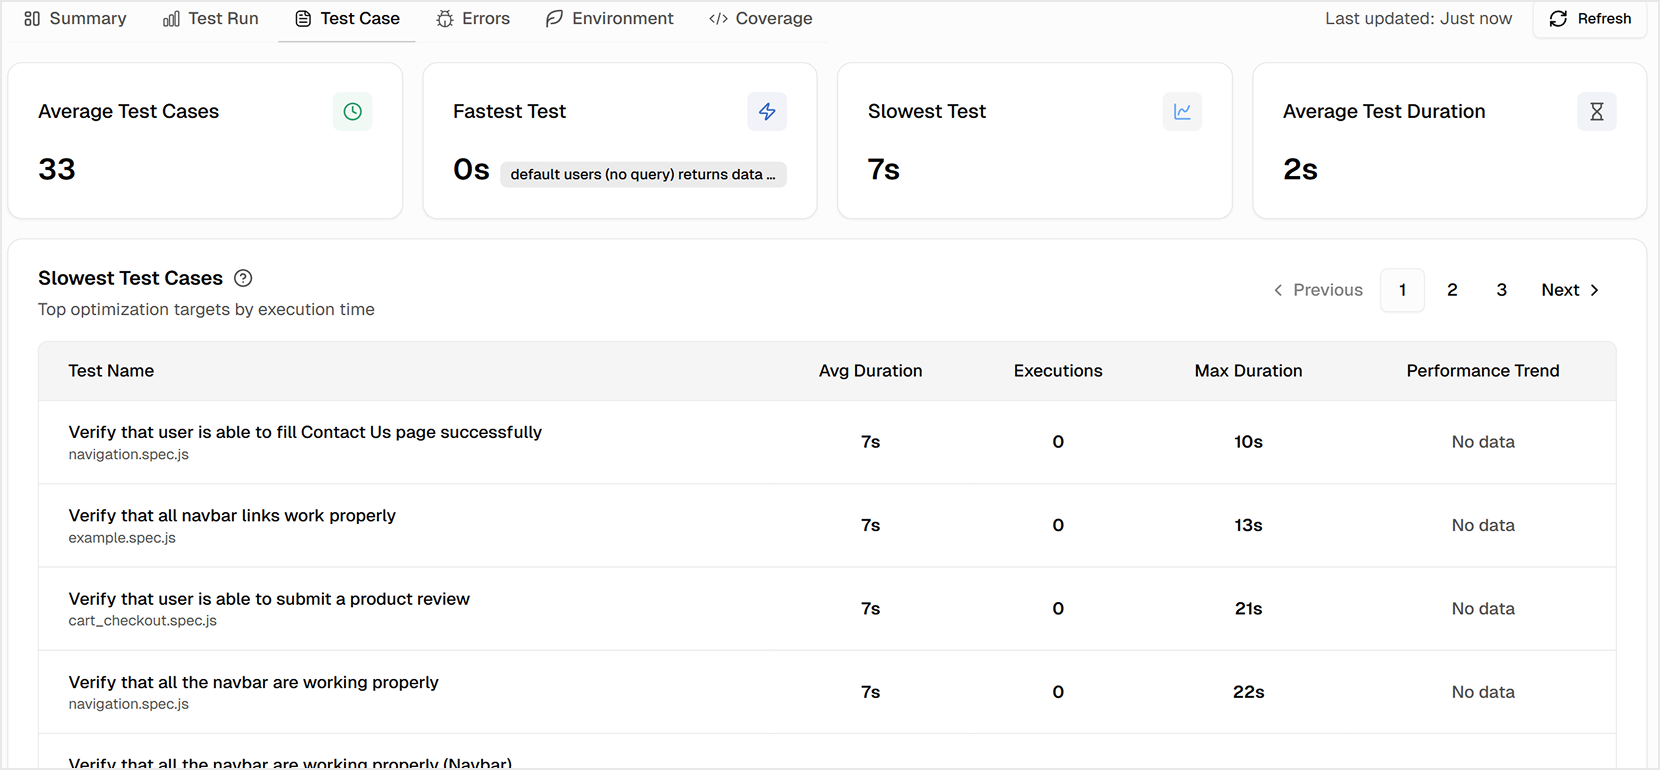
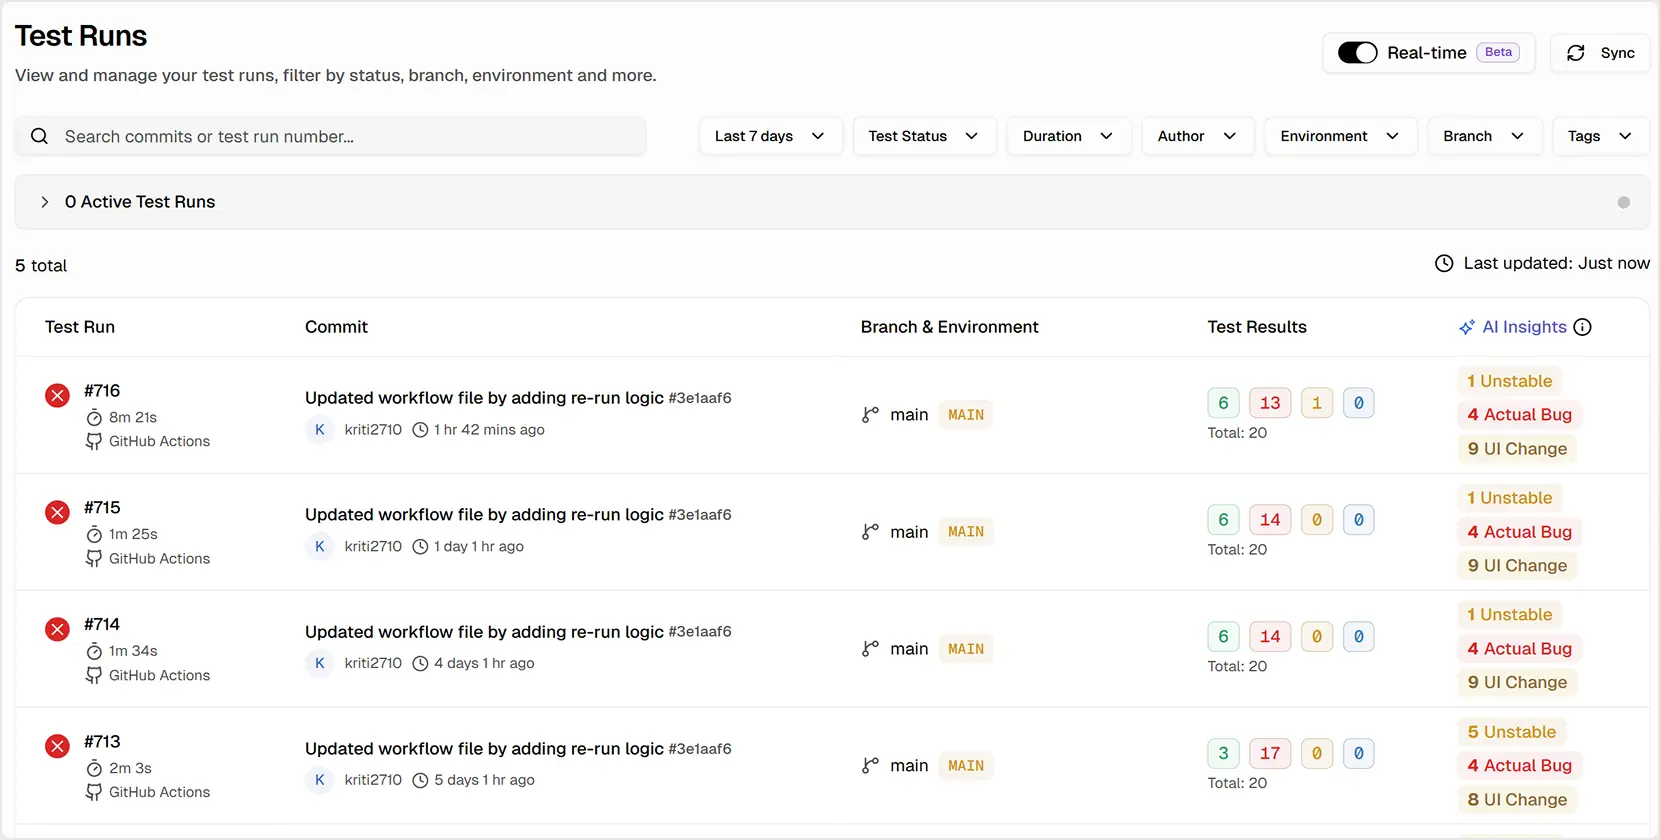
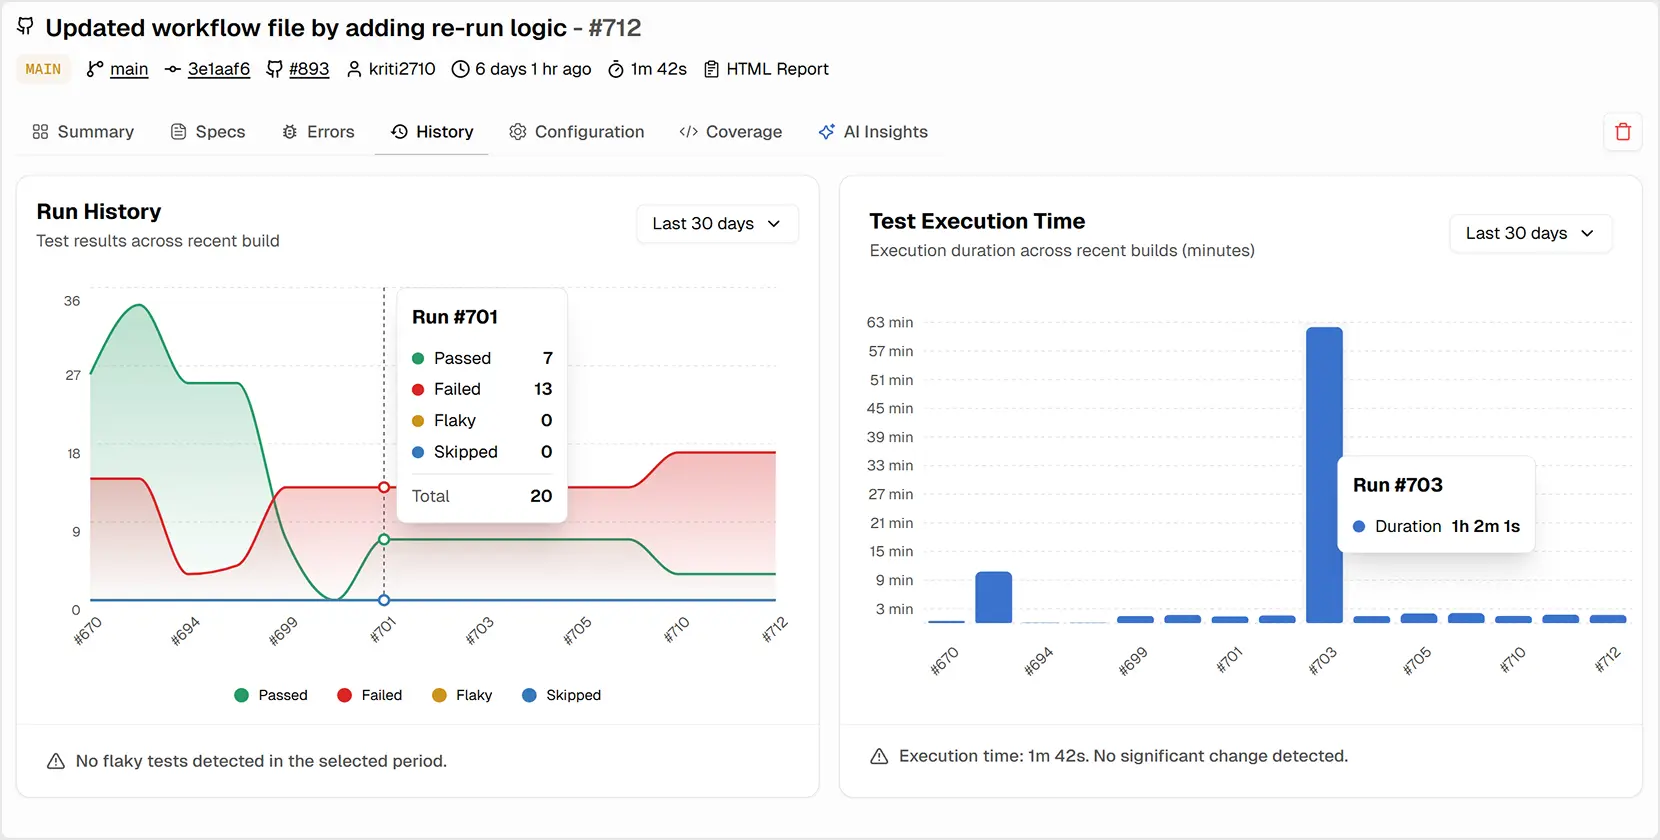
Test History
Track the complete history of every test case across all your CI runs. See pass/fail patterns, identify flaky tests, and understand how test stability changes over time with detailed trend data.
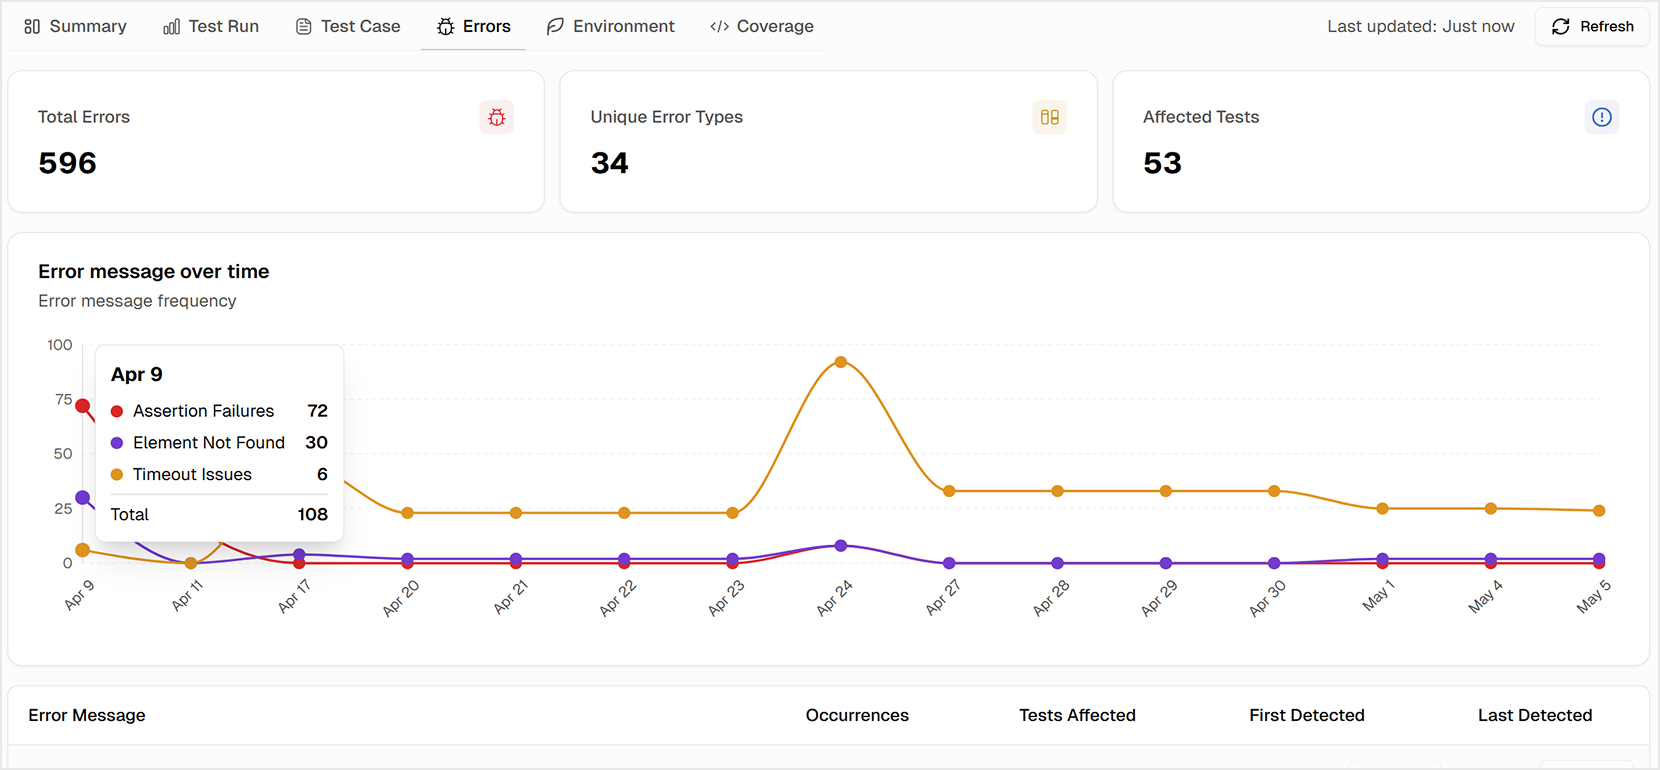
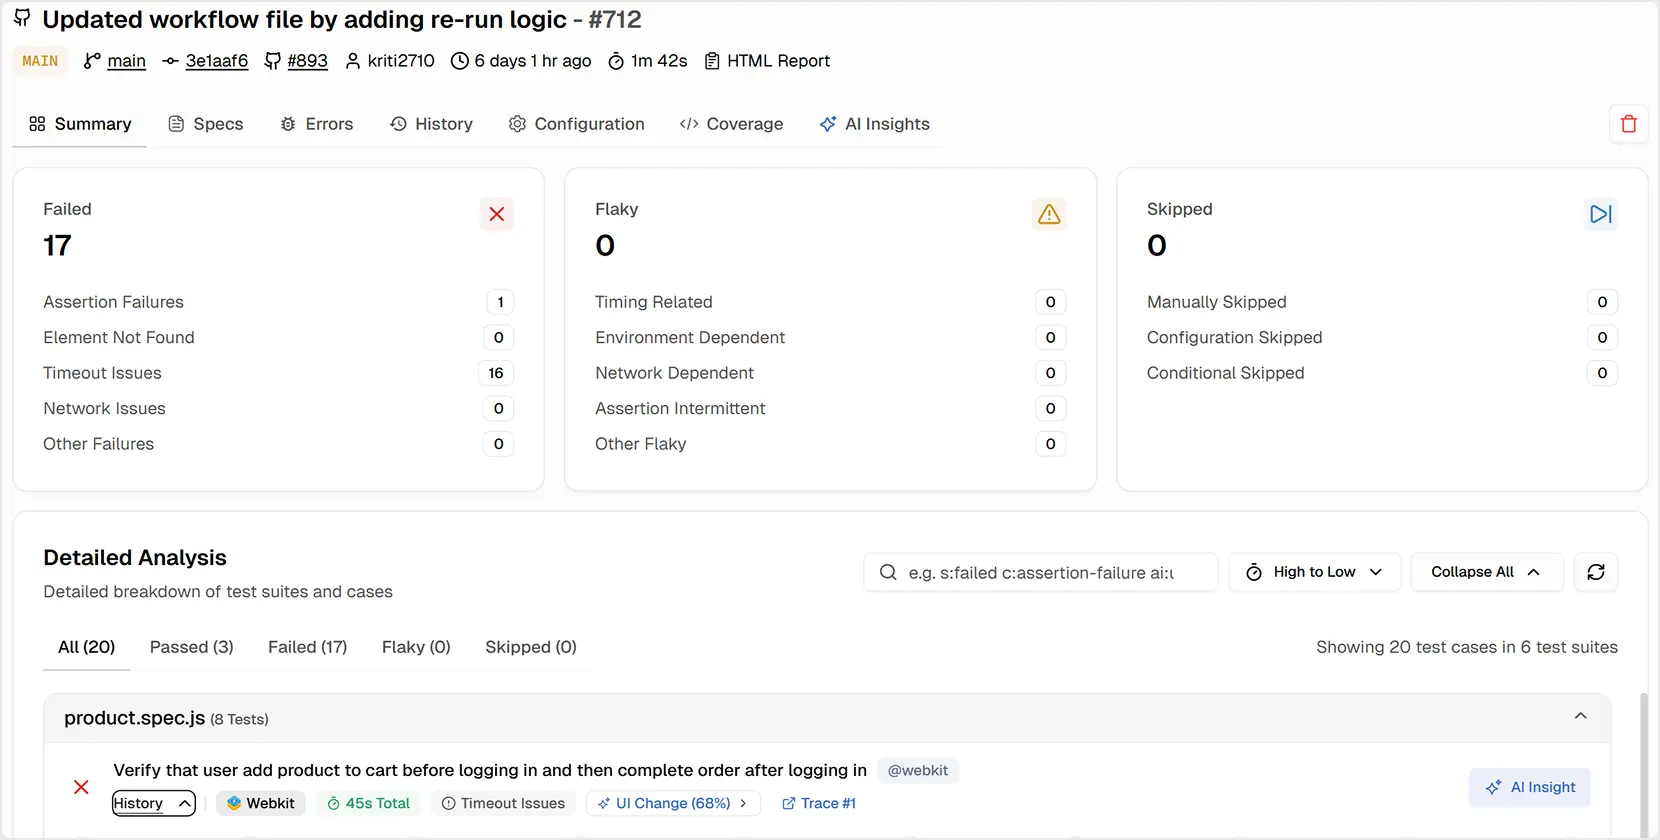
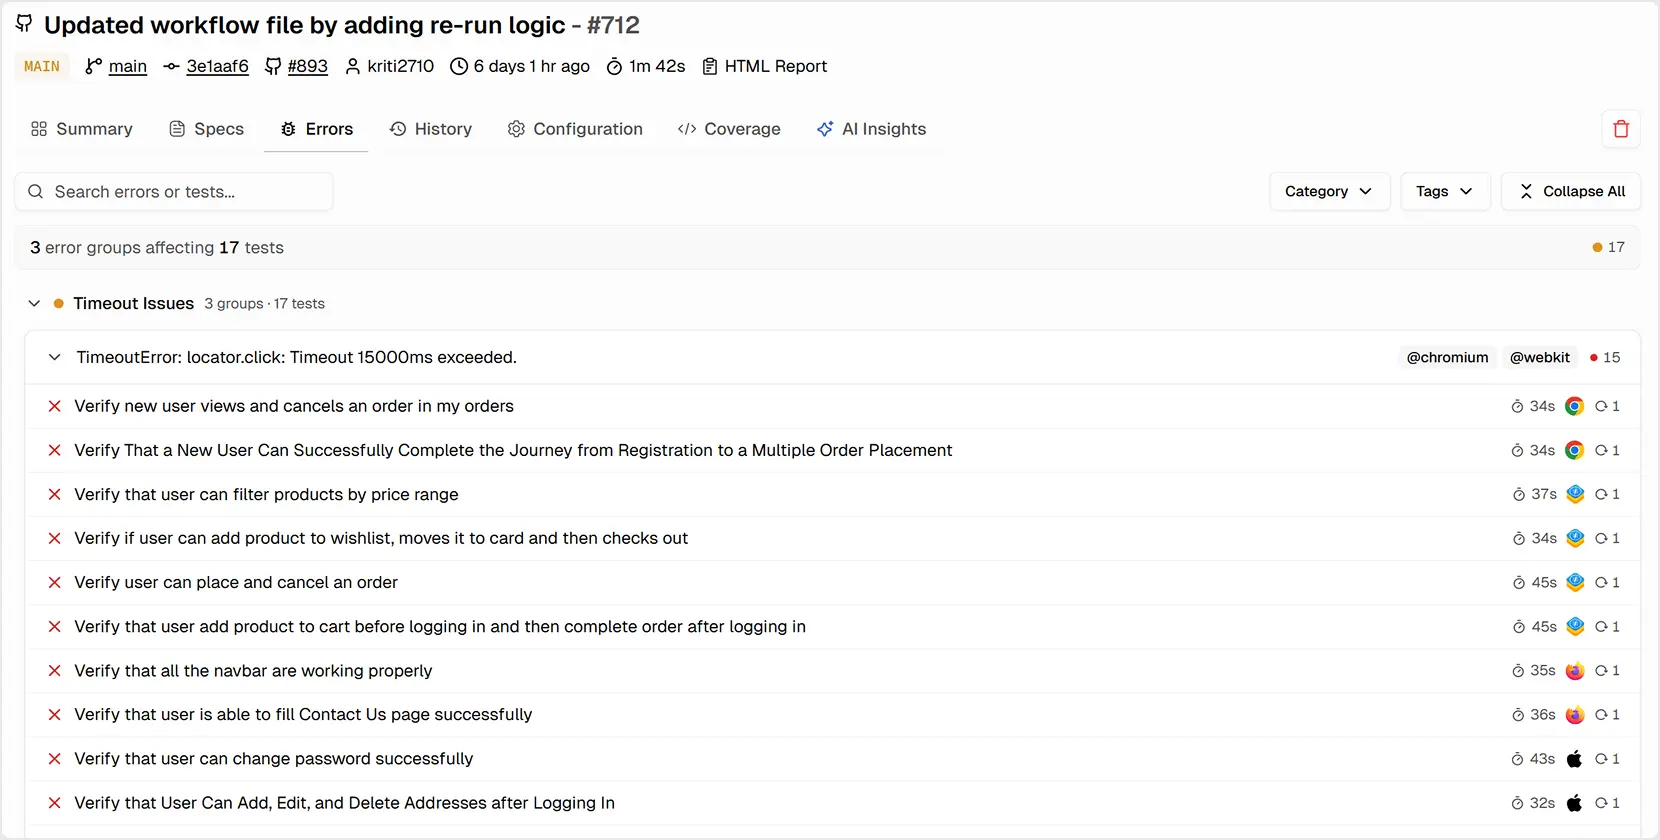
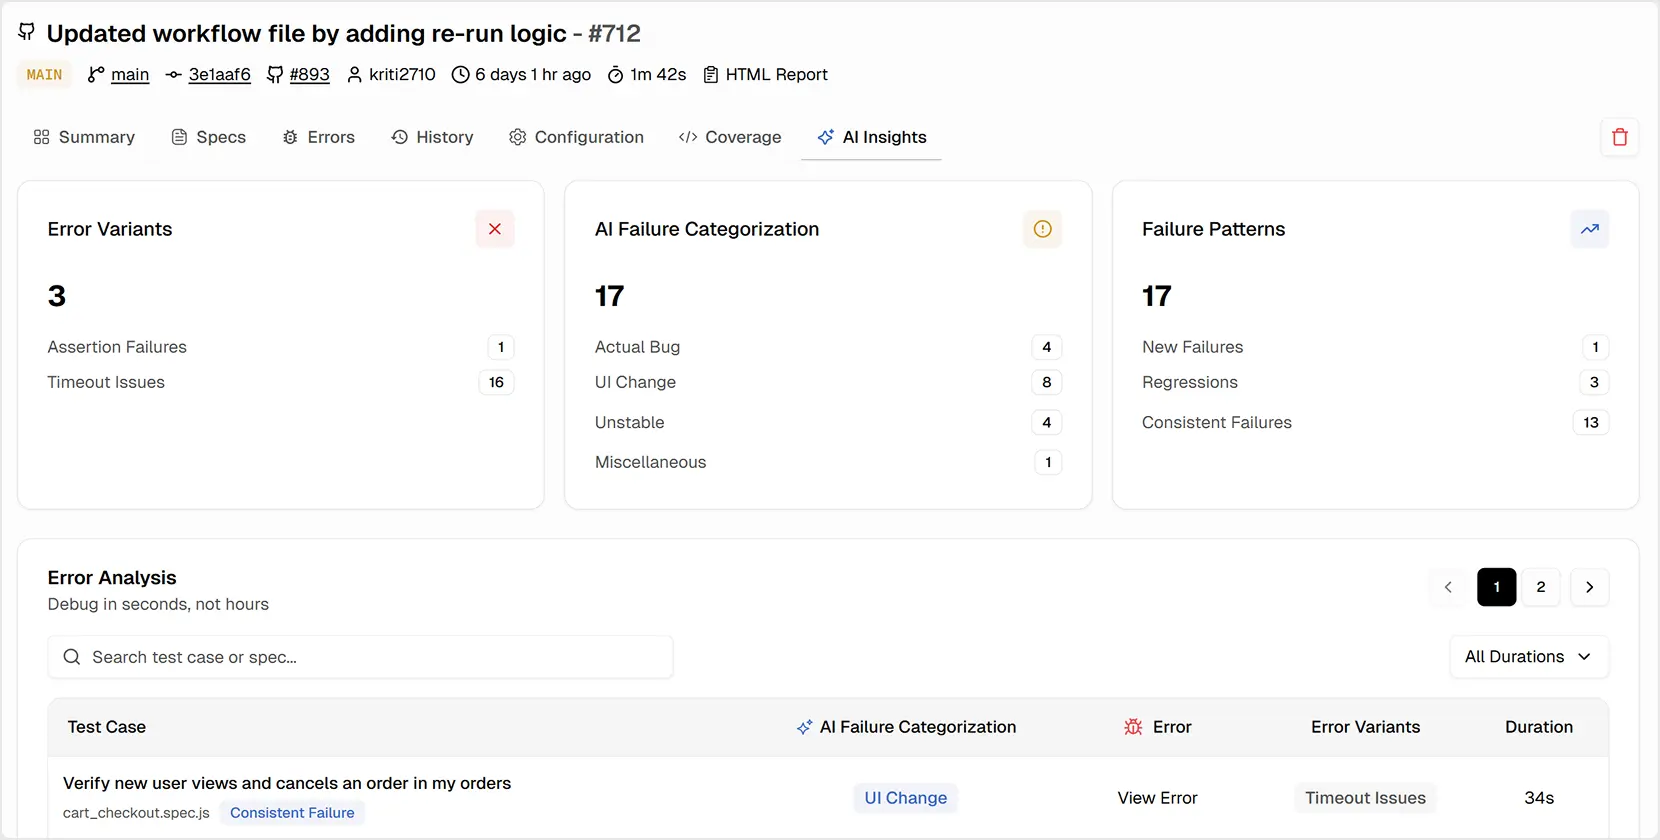
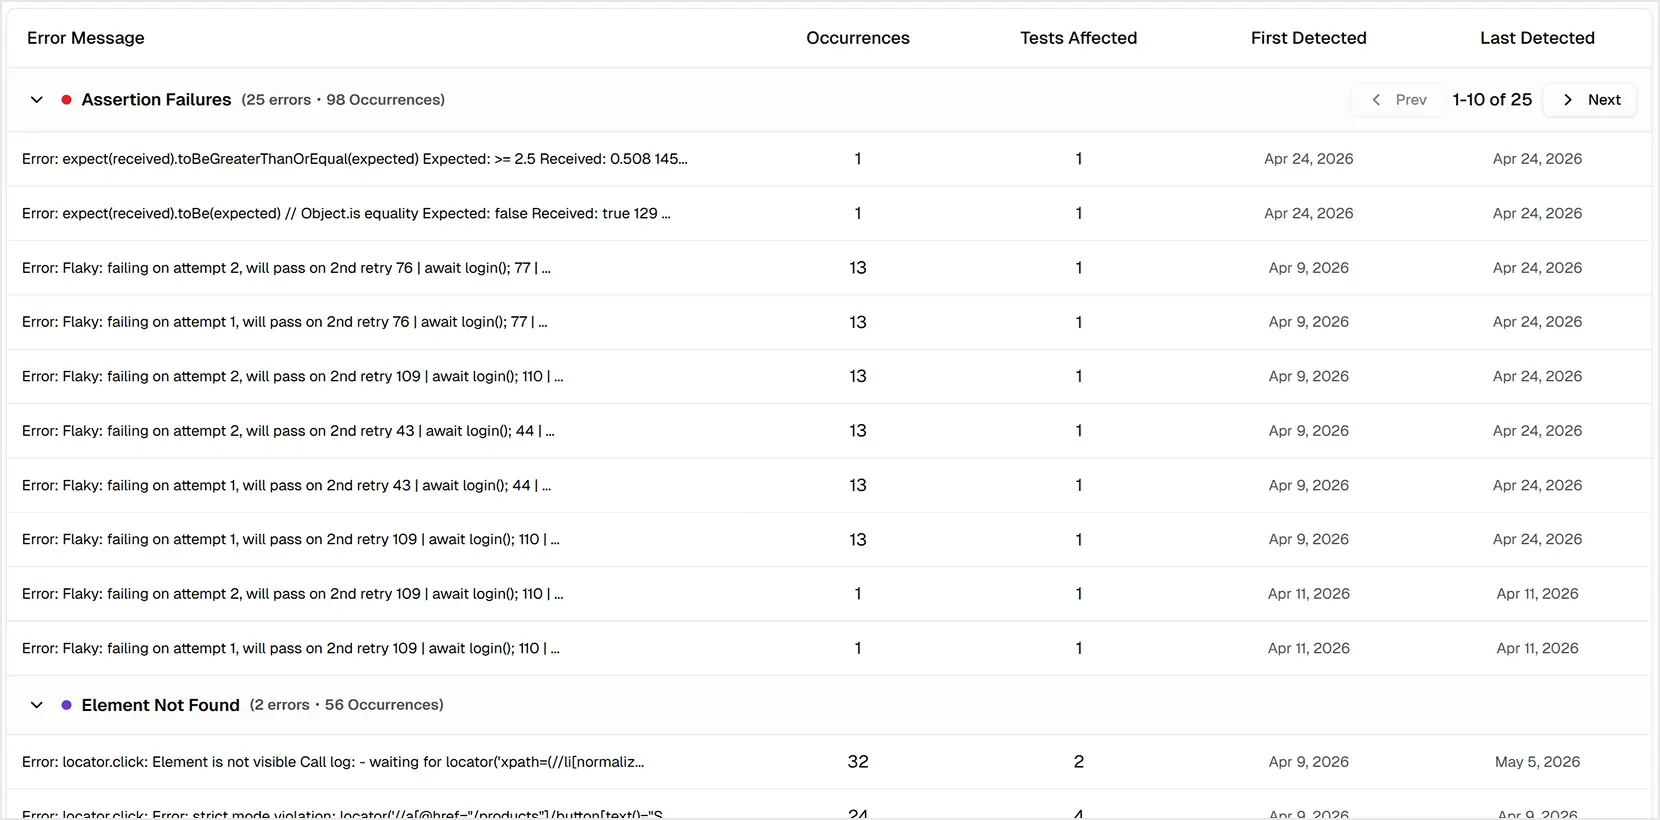
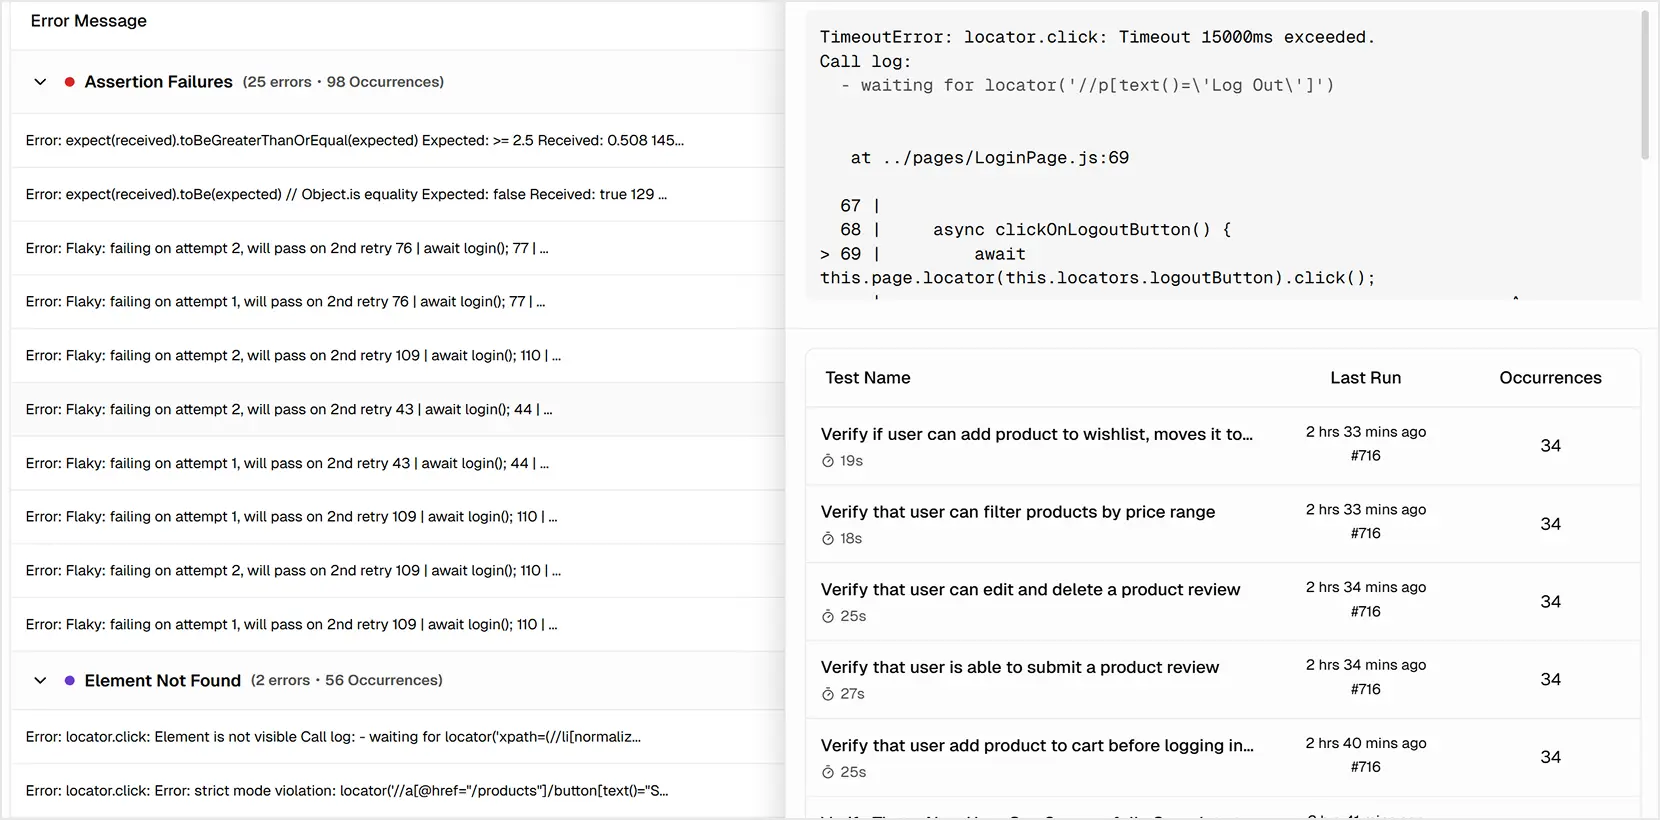
Drill into Error Categories and Their Impact
The Errors tab lets you explore failure data interactively. You can see a timeline of different error types to correlate spikes with deployments and view a table of the most common Error Variants, prioritized by their impact on your test suite.
This lightweight setup keeps your Playwright test reporting fast and transparent across all environments, without rewriting any tests or pipelines.
Integrations that Streamline Your Workflow
To keep your team moving fast, you need to eliminate manual, error-prone tasks such as copying & pasting bug reports. Your testing tool should work seamlessly with your existing workflow.
We offer one-click integrations with the tools you already use, creating a frictionless path from test failure to resolution.
Communication
For CI/CD - integration with GitHub for automated PR comments and status checks. You can also upload reports from any CI platform, including GitLab, CircleCI, Azure DevOps, and Jenkins.
These integrations ensure frictionless flow from TestDino to your Playwright test reporting workflow and ensure failures move more quickly across the team.
Continue learning
More resources from the TestDino team for Playwright engineers.
Shard calculator, trace configurator, locator playground, regex tester, and more. Run in your browser, no signup.
Explore toolsQuick-reference API snippets covering browsers, contexts, locators, assertions, and CI config.
Open cheatsheet79 practical Q&As across fundamentals, locators, fixtures, debugging, CI, and the AI ecosystem.
Read interview prepReady to Take Control of Your Playwright Tests?
Stop guessing and start measuring. TestDino gives your entire team the clarity and confidence to ship better software, faster.
With a clear Playwright Dashboard and reliable Playwright test reporting in one place, teams can stop accidentally ignoring every flake.