AI-Native Test Intelligence for QA Automation and Test Failure Analysis
AI-native test intelligence transforms QA by detecting flaky tests, classifying failures, and explaining root causes automatically, no manual triage needed.
Your Playwright suite runs 600 tests. 53 fail. Now what?
You open the HTML report. Scroll through red rows. Click into a failure. Read the stack trace. Open the trace file. Check if it failed yesterday too. Repeat 52 more times.
That's not debugging. That's data entry.
AI-native test intelligence is the layer that sits between your raw test results and your engineering team. It classifies failures automatically, detects flaky patterns over time, and tells you why something broke, not just that it broke. Platforms like TestDino have built this intelligence directly into the reporting pipeline, so every Playwright test result gets analyzed the moment it arrives.
This guide explains what ai-native test intelligence is, how it works under the hood, and what separates a genuinely intelligent platform from one that just slapped "AI" on a dashboard.
What Does "AI-Native" Actually Mean in Test Intelligence?
There's an important difference between "AI-enhanced" and "AI-native" that most vendors blur on purpose.
AI-enhanced means a tool added an AI feature on top of existing reports. Maybe there's a chatbot that can answer questions about your test data. Or a button that sends your error log to an LLM and returns a summary. The AI is an add-on. Remove it, and the product still works the same way.
AI-native test intelligence means the AI processes every single test result as a core part of the pipeline. Classification happens automatically. Pattern detection runs in the background. The product doesn't function the same without the AI, because the AI is the product.
Think of it this way: a traditional test reporting tool is a filing cabinet. An ai-native test intelligence platform is a senior QA engineer who reads every failure, groups related issues, flags the flaky ones, and hands you a prioritized fix list before your morning standup.
Three capabilities define a genuinely ai-native test intelligence platform:
- Automatic failure classification: every failure gets a category (bug, flaky, UI change, infrastructure) with a confidence score
- Pattern detection over time: the system tracks historical data to spot trends, recurring errors, and emerging regressions
- Actionable recommendations: instead of raw logs, you get plain-English summaries explaining what failed and what to do about it
If a tool can't do all three without manual input, it's not ai-native. It's AI-adjacent.
Traditional reporting shows what failed. AI-native test intelligence shows why it failed and what to fix first.
AI Failure Classification: The Core of Test Intelligence
Let's get specific about how failure classification works in practice.
When a Playwright test fails, it generates a lot of data: an error message, a stack trace, console logs, network requests, sometimes a screenshot or a trace file. A human engineer reads all of that, cross-references it with recent code changes, checks if the test has failed before, and decides what category the failure falls into.
AI failure classification does the same thing, but in seconds instead of minutes. Here's what the process looks like:
Input signals the AI analyzes:
- Error message and stack trace content
- Playwright trace data (actions, network calls, DOM snapshots)
- Historical pass/fail patterns for the same test
- Recent commits and code changes on the branch
- Console log output and screenshot diffs
Output the engineer receives:
- A category label: Actual Bug, UI Change, Unstable Test, or Miscellaneous
- A confidence score (for example, 91% confidence this is an Actual Bug)
- A plain-English summary explaining the likely cause
- Links to the evidence: trace files, screenshots, console logs
Here's a real example. A test called checkout-flow.spec.ts > should complete purchase fails with TimeoutError: locator.click: Timeout 30000ms exceeded. Is this a real bug? A slow API? A flaky selector?
The AI checks: this test passed in 8 of the last 10 runs. The timeout happens on a button click that depends on an API response. The same API endpoint returned 503 errors in 2 other test runs this week. Classification: Unstable Test (infrastructure-related), 87% confidence. Suggested action: check the API health, not the test code.
Without ai-native test intelligence, an engineer spends 15-20 minutes reaching the same conclusion manually. Multiply that by 53 failures, and you've burned an entire day on triage.
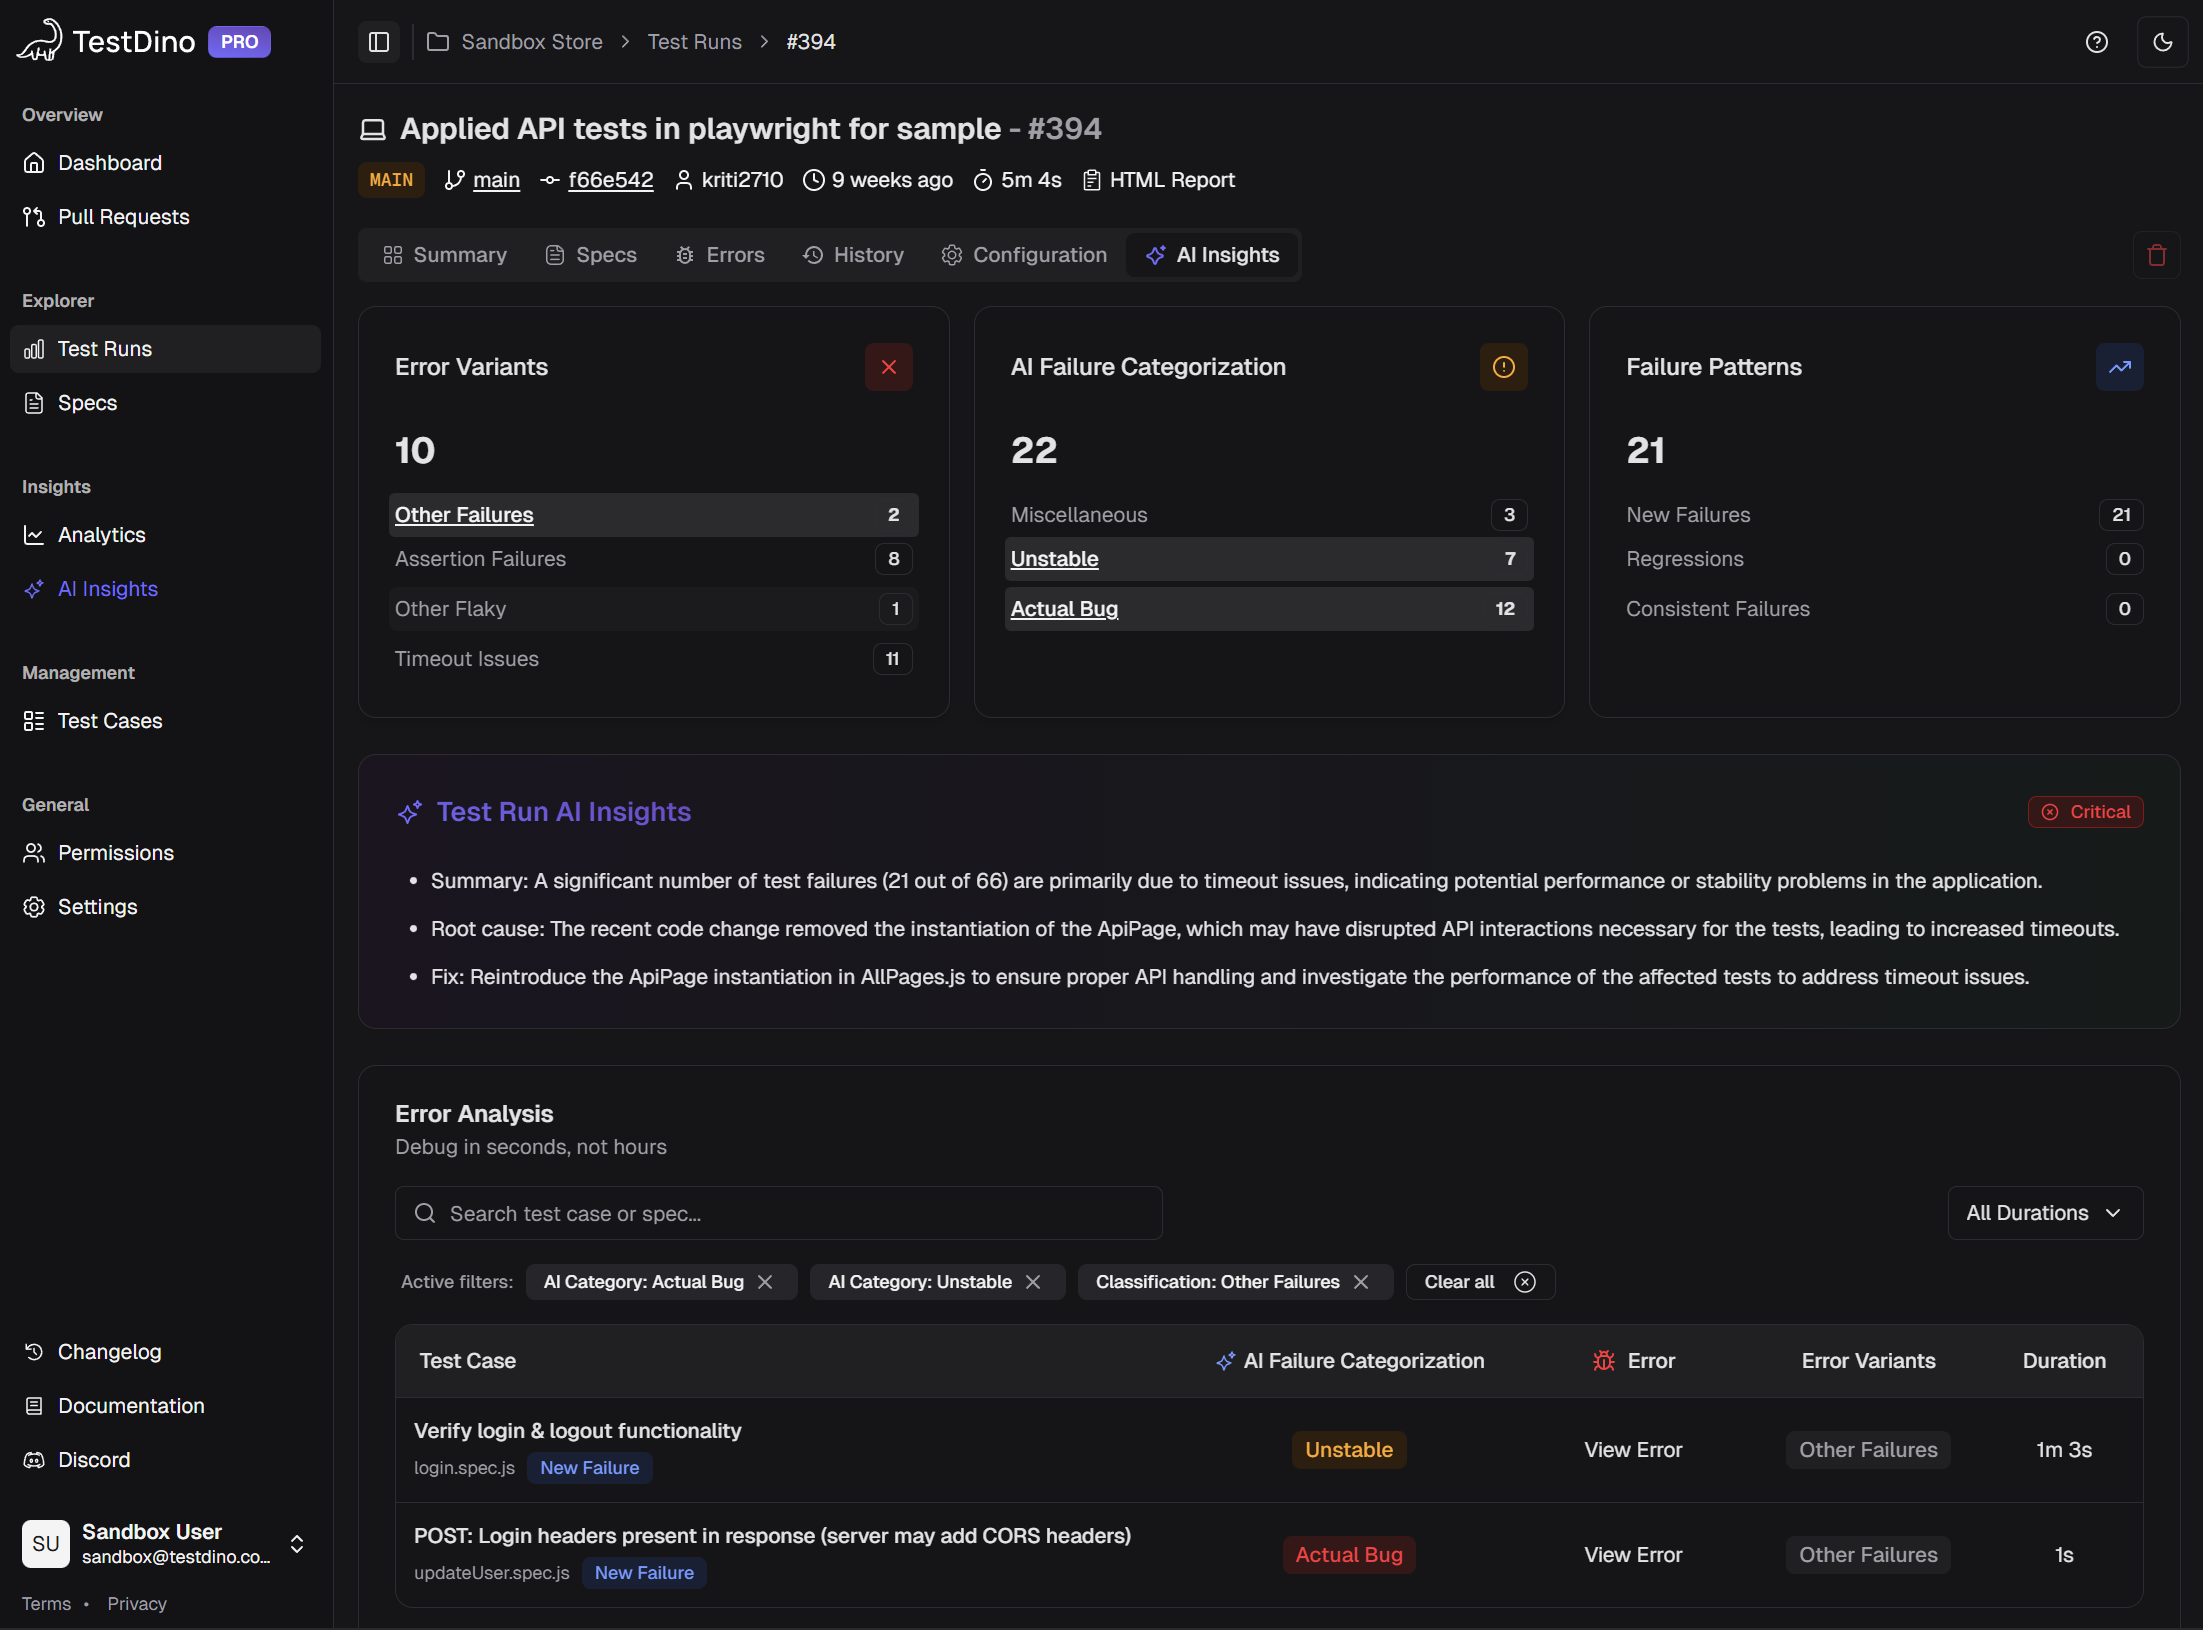
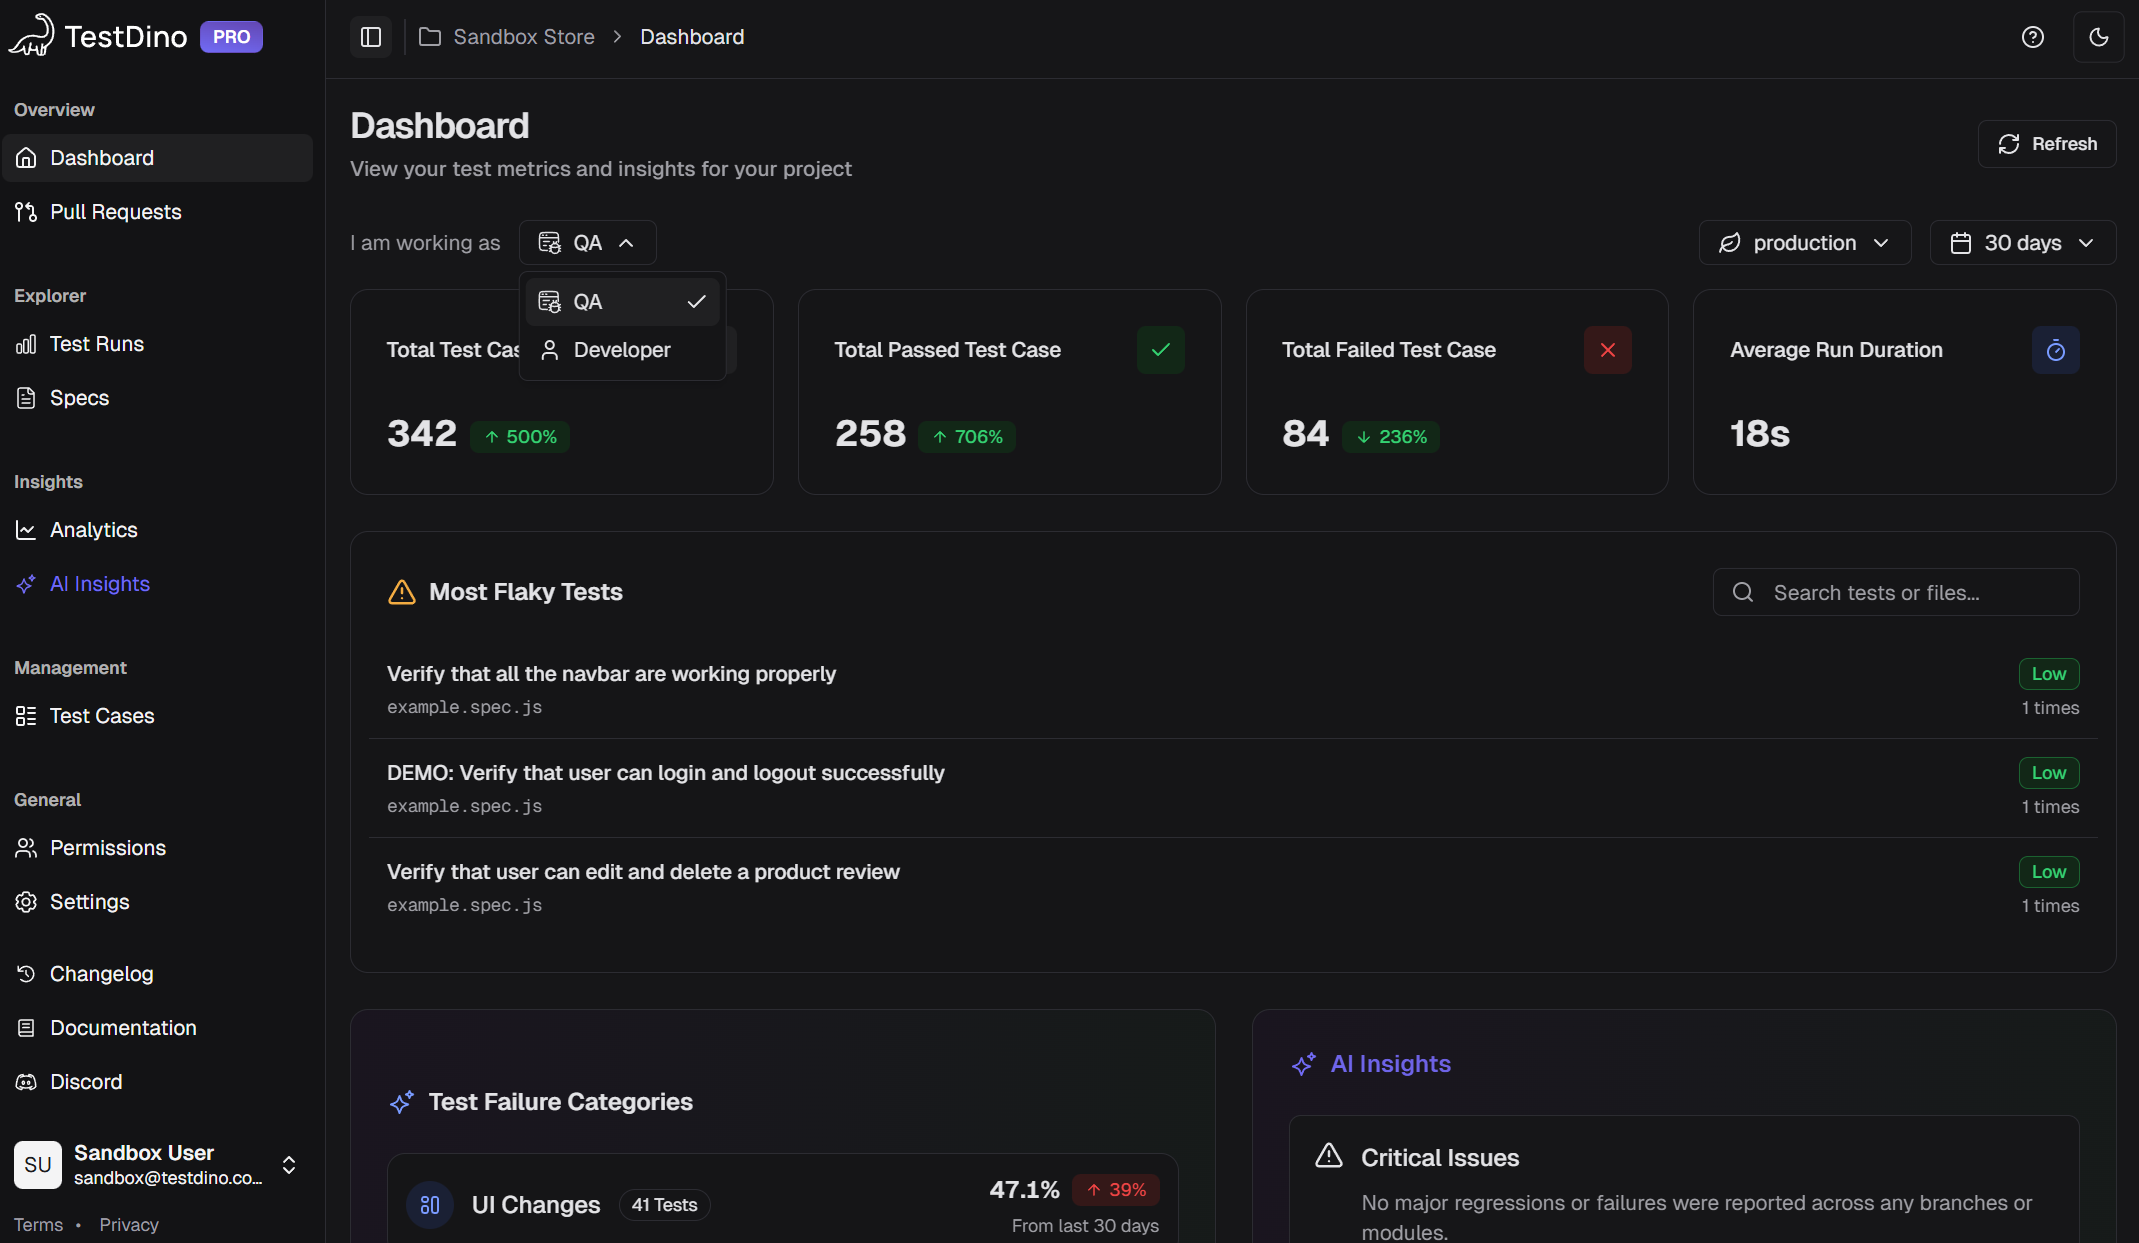
TestDino classifies every Playwright failure with a category, confidence score, and AI-generated summary. No manual triage needed.
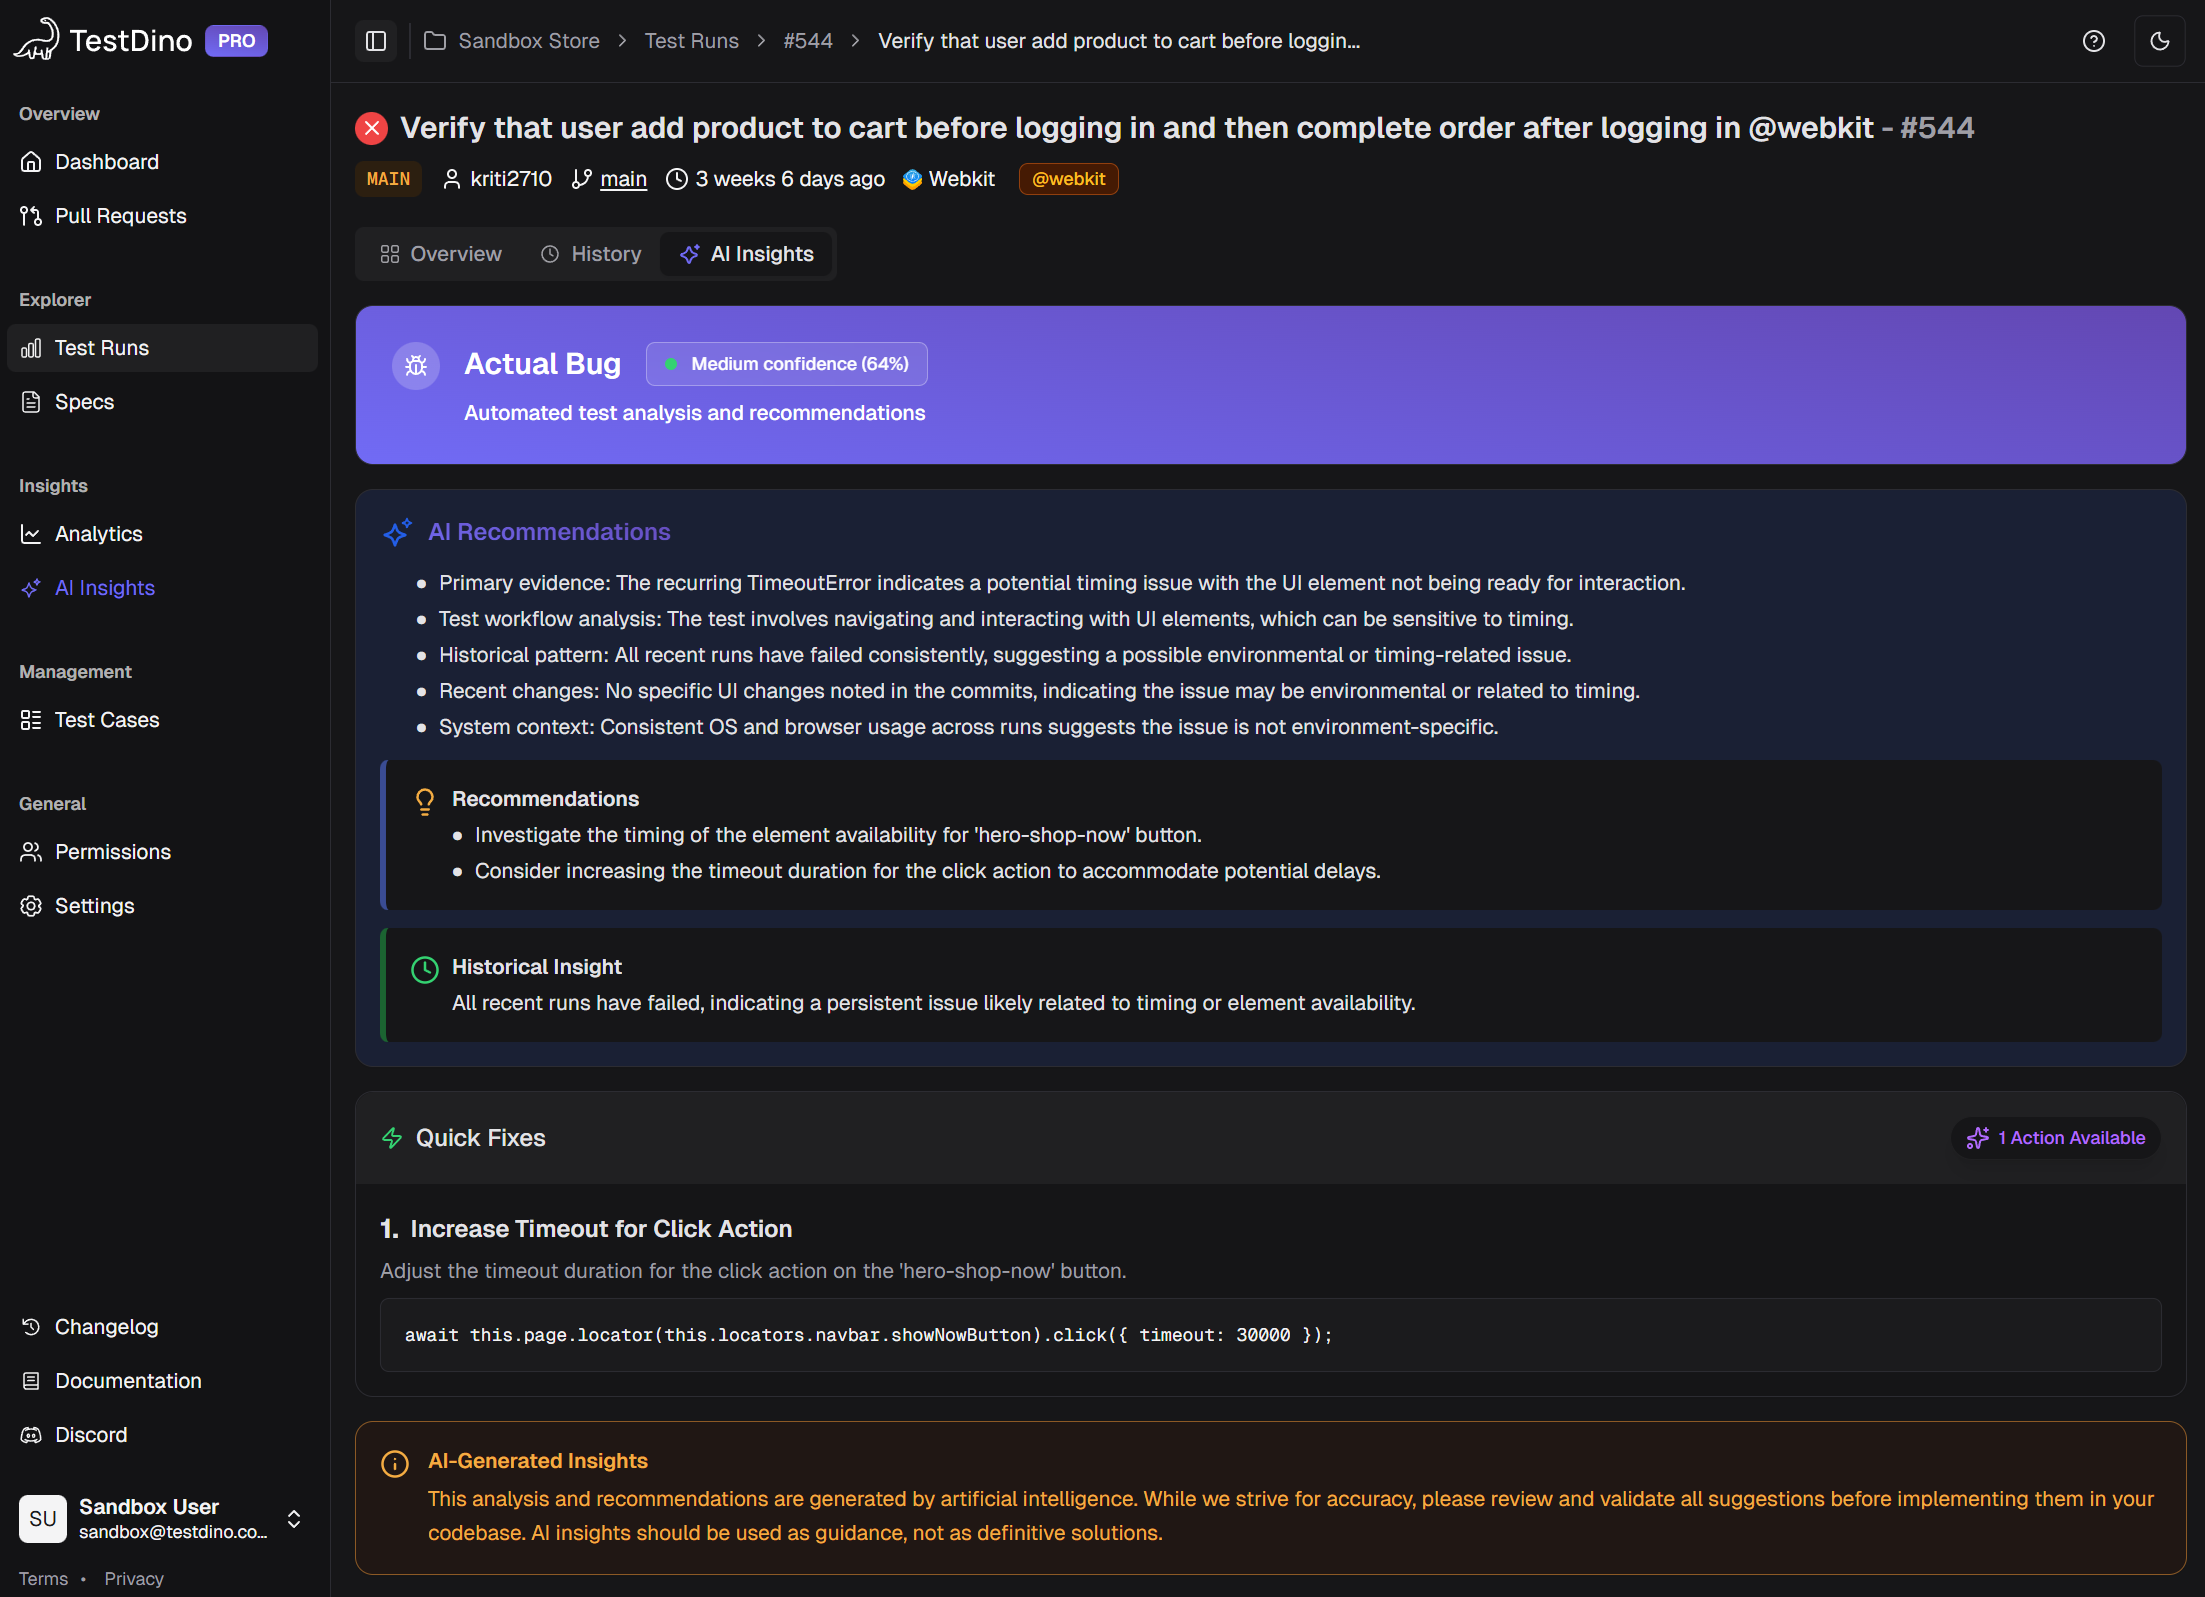
TestDino runs this classification on every Playwright failure automatically. The categories show up on your dashboard, in your GitHub PR comments, and in Slack notifications. You don't have to click anything. The intelligence comes to you.
Want to see how this looks in practice? Check the AI Insights overview in the docs, or jump straight into the sandbox with live sample data.
Flaky Test Detection That Goes Beyond Retries
Every engineering team has flaky tests. GitHub's own engineering blog has documented how flaky tests affect developer productivity across its platform. The usual fix? Retry the test and hope it passes. But retries hide the problem. They don't tell you why a test is flaky or whether it's getting worse.
AI-native test intelligence tracks every pass/fail transition for every test across every run. Over time, it builds a flakiness profile for each test case. This is fundamentally different from just counting failures.
What flaky test detection actually tracks:
- How often does a test flip between pass and fail without code changes
- Whether flakiness is getting better or worse over time (trend lines)
- The root cause pattern: is it timing-related, network-dependent, selector instability, or environment-specific?
- Which tests are the most flaky, ranked by failure frequency
This matters because not all flaky tests deserve the same priority. A test that fails 2% of the time on a non-critical flow is different from one that fails 15% of the time on your checkout page. AI-native platforms give you that ranking automatically.
TestDino's flaky test detection shows your most unreliable tests sorted by flakiness rate, with historical trend charts. Combined with AI classification that separates timing issues from selector problems, you can make a clear decision: fix this test now, quarantine it, or skip it in the next sprint. For a practical approach to reducing flakiness at the code level, see this Playwright automation checklist.
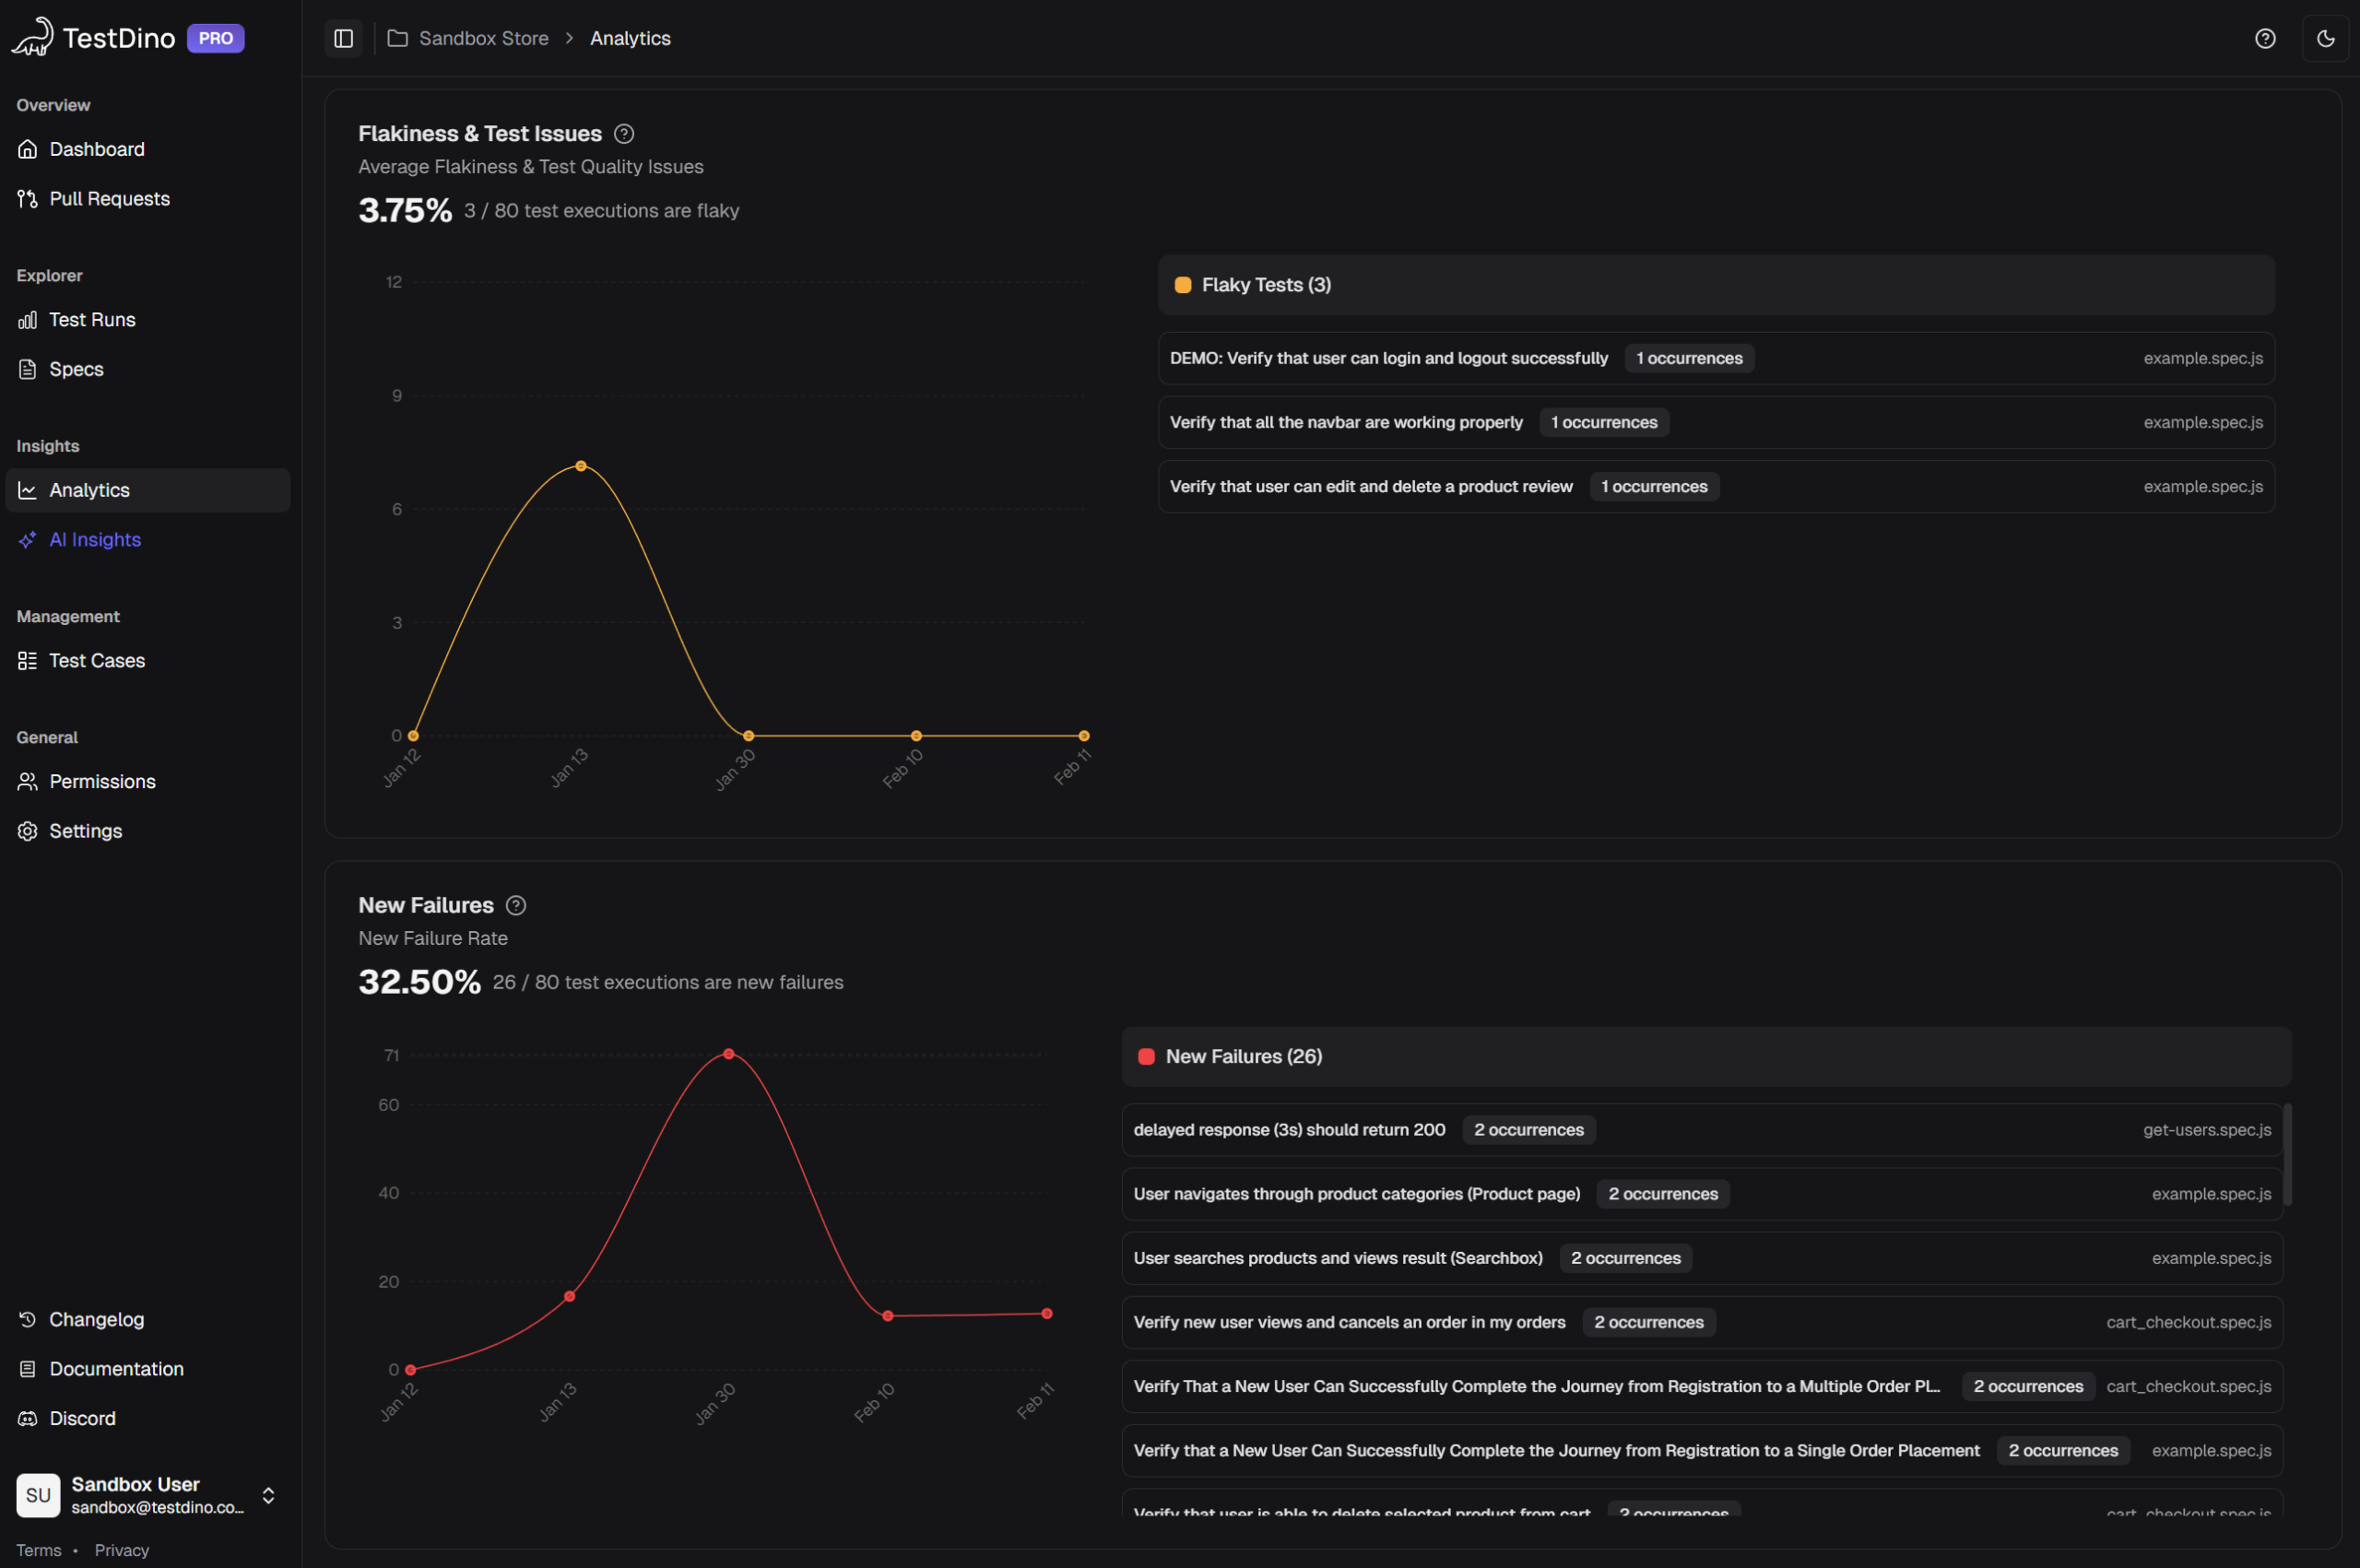
TestDino ranks your most unreliable tests by flakiness rate and shows whether each test is getting better or worse over time.
Here's the kicker: when flaky test data is connected to your CI pipeline, you can automatically re-run only failed tests instead of the full suite. That cuts CI time and cost without ignoring the underlying flakiness. TestDino supports this directly with its re-run only failed tests feature, and the CI optimization guide walks through the exact GitHub Actions setup.
Root Cause Analysis: From Log Reading to Plain English
Traditional root cause analysis (RCA) follows a predictable, painful pattern. Open the CI log. Find the failure. Open the Playwright Trace Viewer. Scrub through actions. Check the network tab. Cross-reference with git log. Maybe check if the same test failed on another branch. Twenty minutes later, you have an answer. Or you don't, and you ping a colleague.
AI-powered RCA compresses this into a single summary. The system reads the same data a hould, but does it instantly and consistently. For a deeper look at how this process works, read Why QA needs AI-assisted root cause analysis.
A good AI root cause summary looks like this:
 This test failed because the /api/cart endpoint returned a 503 during the add-to-cart step. The same endpoint was unreachable in 3 of the last 5 runs on the staging environment. This is likely an infrastructure issue, not a code regression. Related failures: cart-update.spec.ts, cart-remove.spec.ts.

Notice what's in that summary: the specific endpoint, the step where it broke, historical context from past runs, an environment callout, and links to related failures. That's not a generic "test failed" message. That's a diagnosis.
A real AI root cause summary from TestDino: specific endpoint, historical context, environment data, and related failures in one view.
TestDino generates these AI summaries at multiple levels:
- Per test run: a run-level AI summary covering critical issues, emerging patterns, and suggested priorities
- Per test case: individual test-case AI insights with confidence scores and evidence links
- Per project: high-level project AI insights, including a summary view and detailed analysis insights across all branches and environments
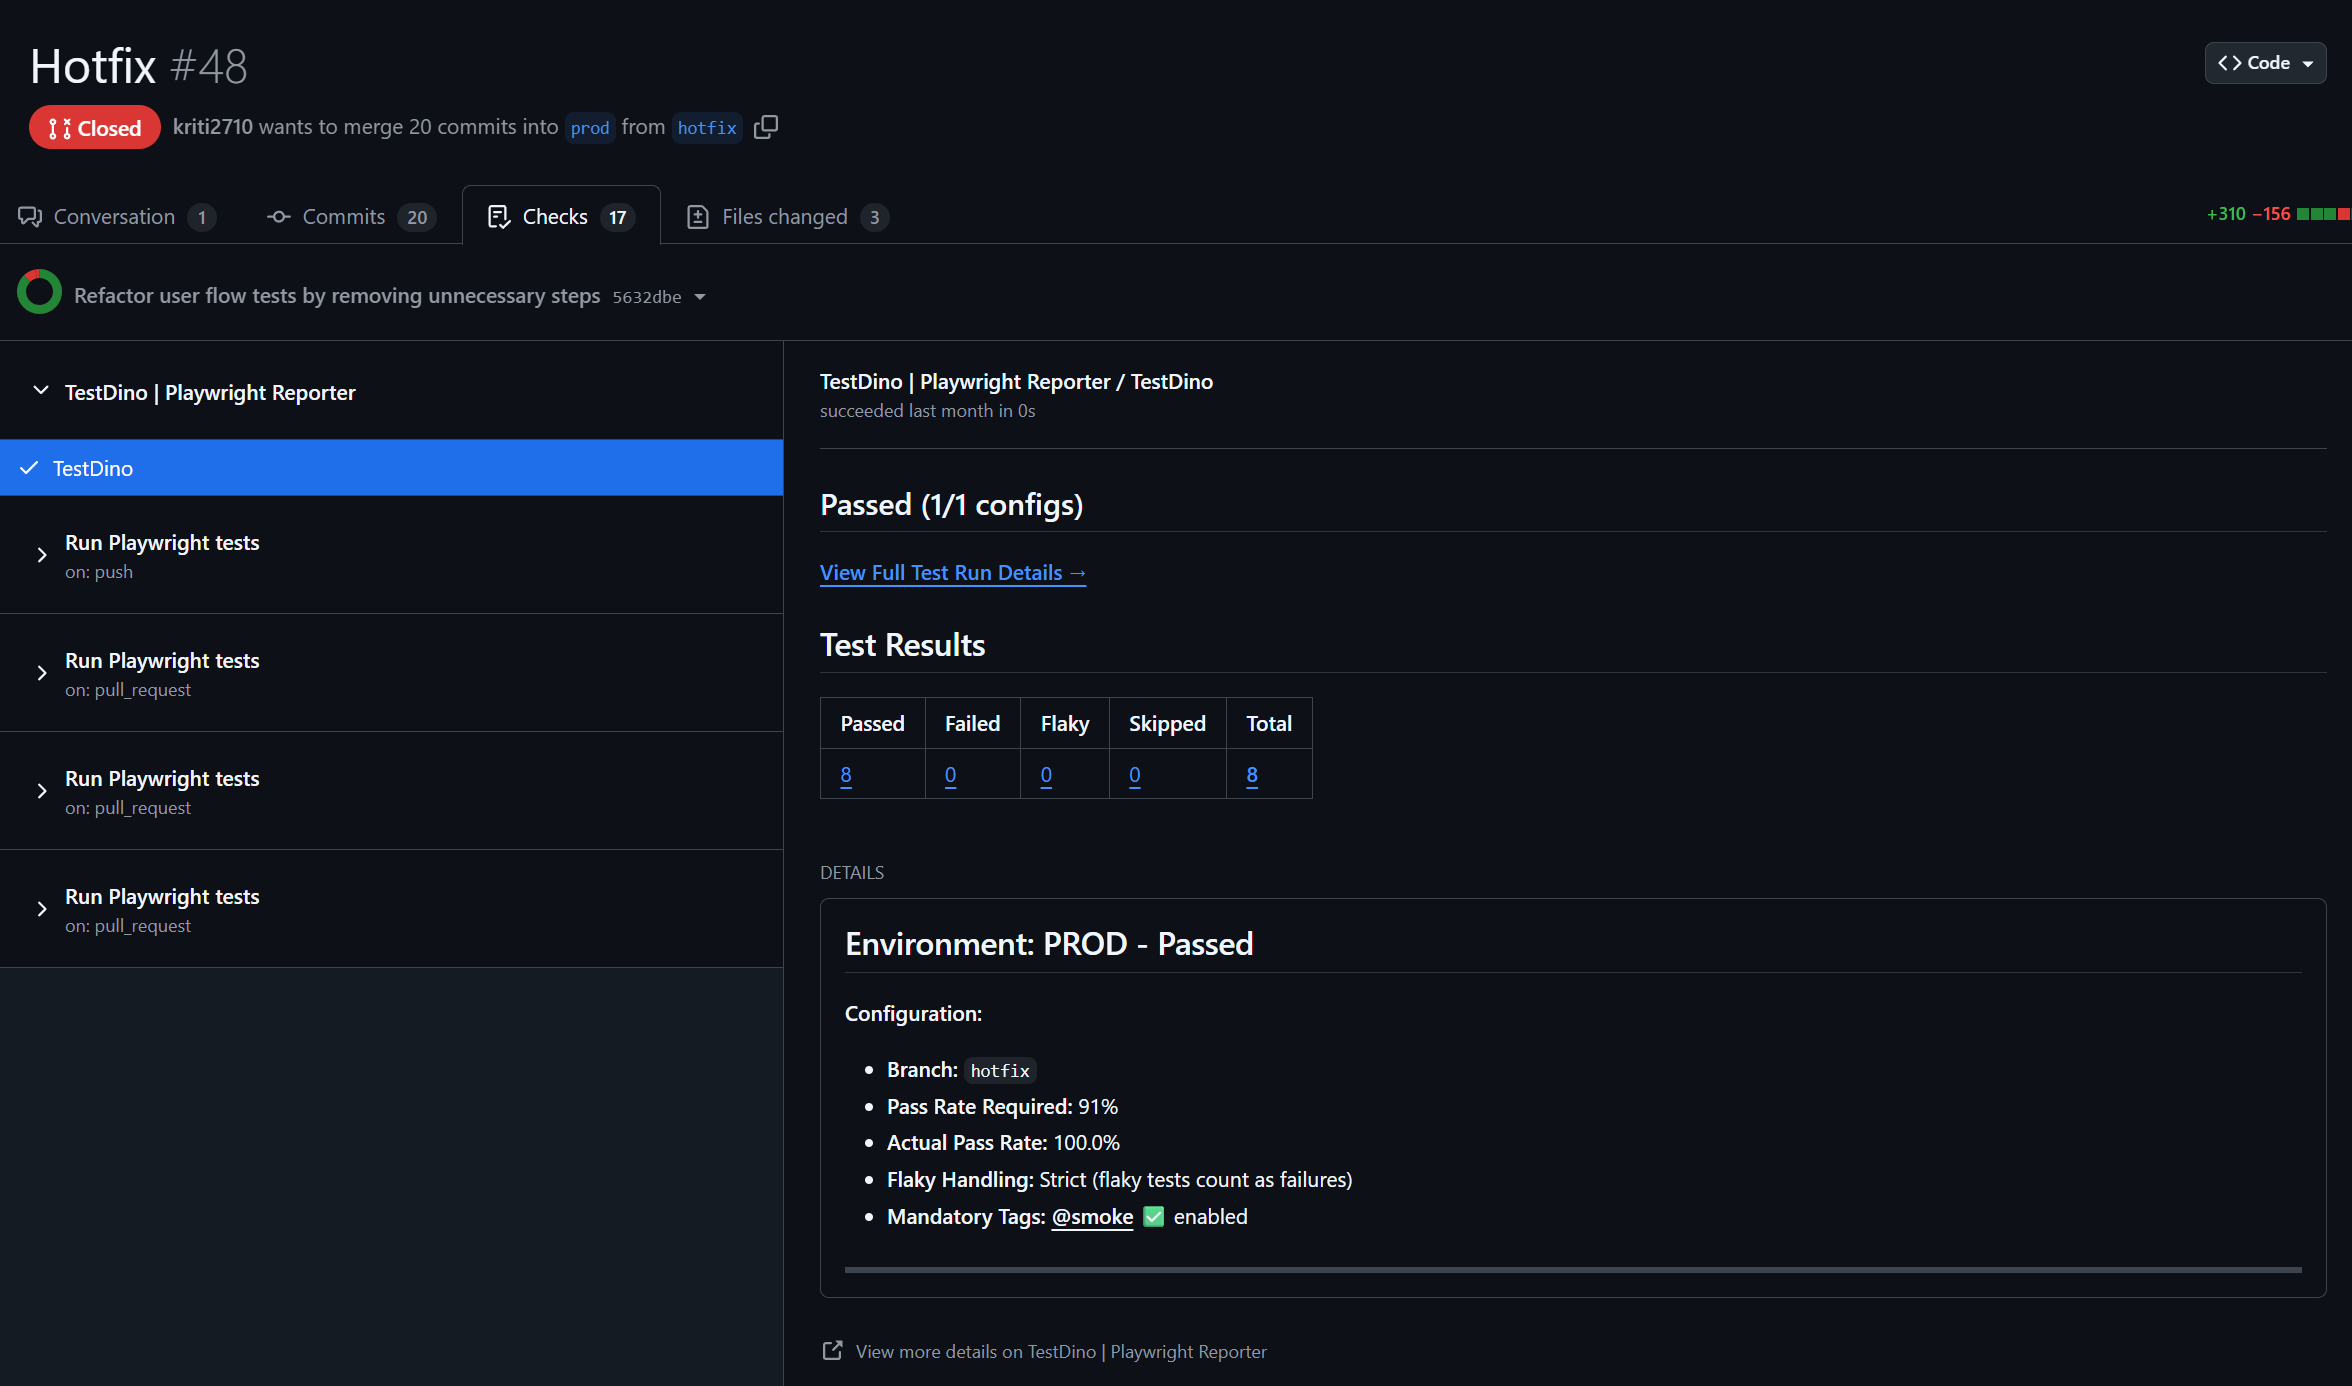
- In GitHub: AI-generated comments are posted directly to PRs and commits, so developers see the analysis without leaving their workflow. You can also set up GitHub status checks to gate merges based on test quality
TestDino posts AI summaries directly to your GitHub PRs. Developers see what failed and why without leaving their review workflow.
This is where the "native" part matters most. Because the AI has access to your full test history, not just the current run, it can spot patterns that a one-off analysis would miss. "This test started failing 3 days ago on the feature/payments branch" is the kind of context that saves hours. Learn more about how AI classification identifies these patterns in Predictive QA.
Test Analytics: When Raw Data Creates More Work, Not Less
Dashboards full of charts look impressive in demos. In practice, most analytics tools give you data and leave the interpretation to you. How many tests passed? Here's a pie chart. Failure rate over time? Here's a line graph. Now you figure out what to do.
AI-native test intelligence adds an interpretation layer on top of the data. Instead of raw numbers, you get grouped insights.
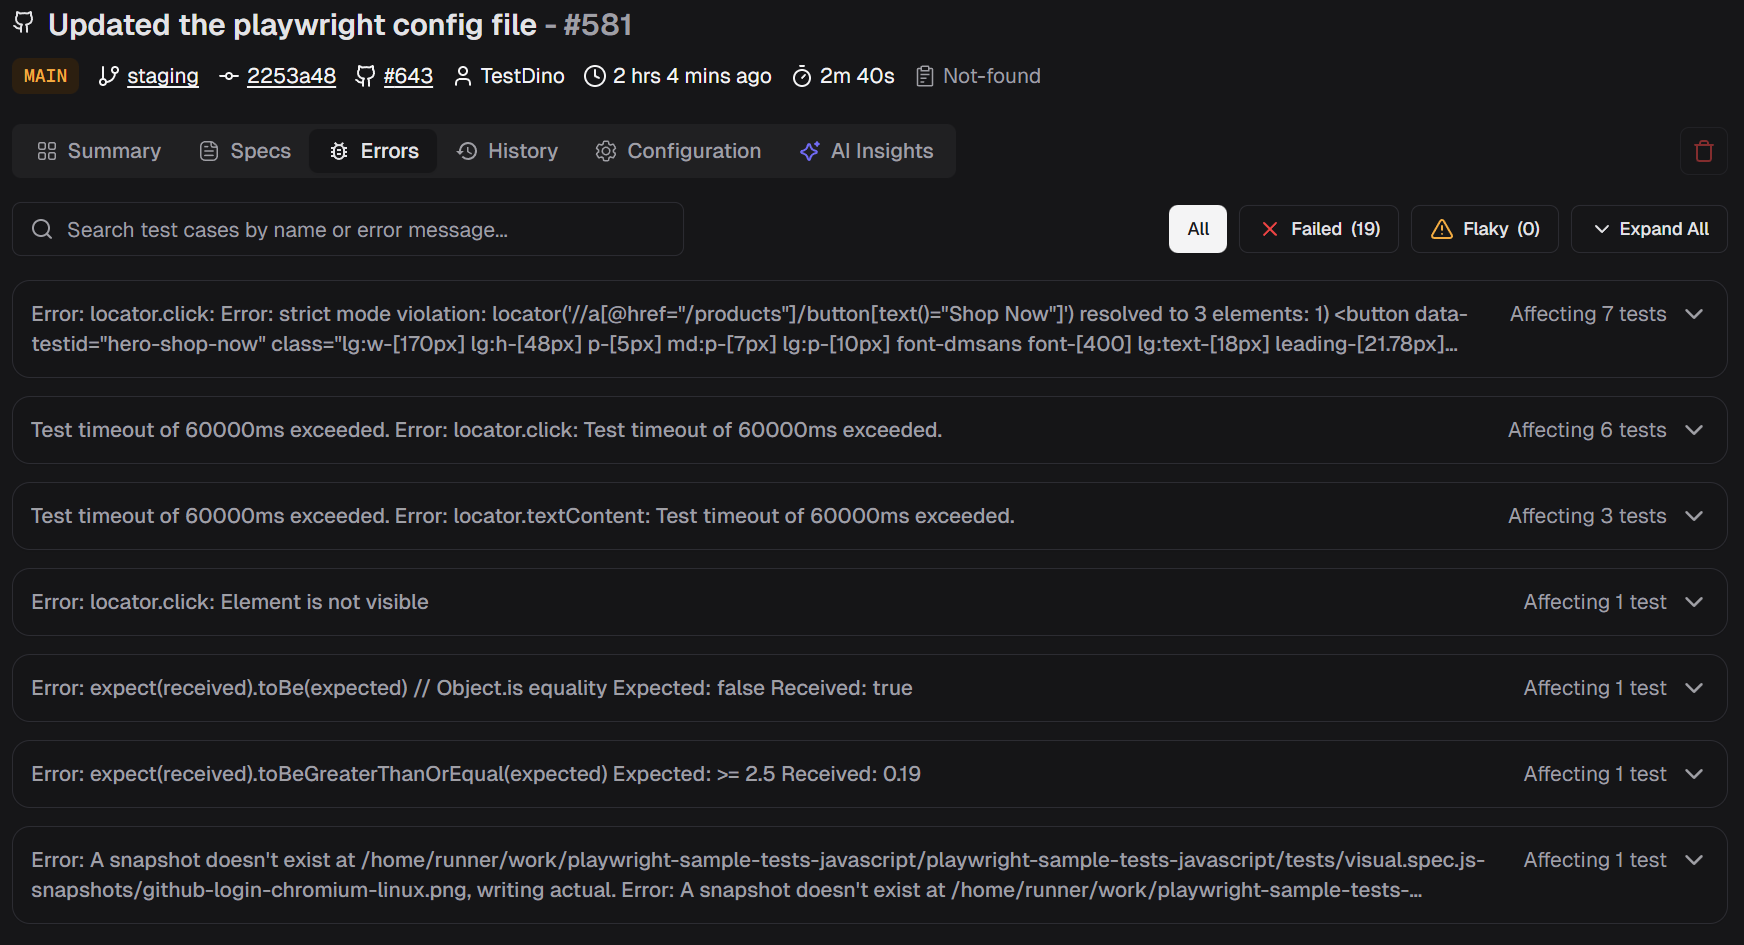
Error grouping clusters similar failures together. If 30 tests fail because of the same API timeout, you don't see 30 separate failures. You see one error group with 30 affected tests. Fix the API, fix all 30.
30 failures, one root cause. Error grouping collapses noise so you fix the problem once instead of investigating each failure separately.
Emerging vs persistent failures separate new problems from old ones. A test that has been failing for two weeks is a different priority than one that started failing after yesterday's deploy. The AI tracks this automatically and flags which failures are new.
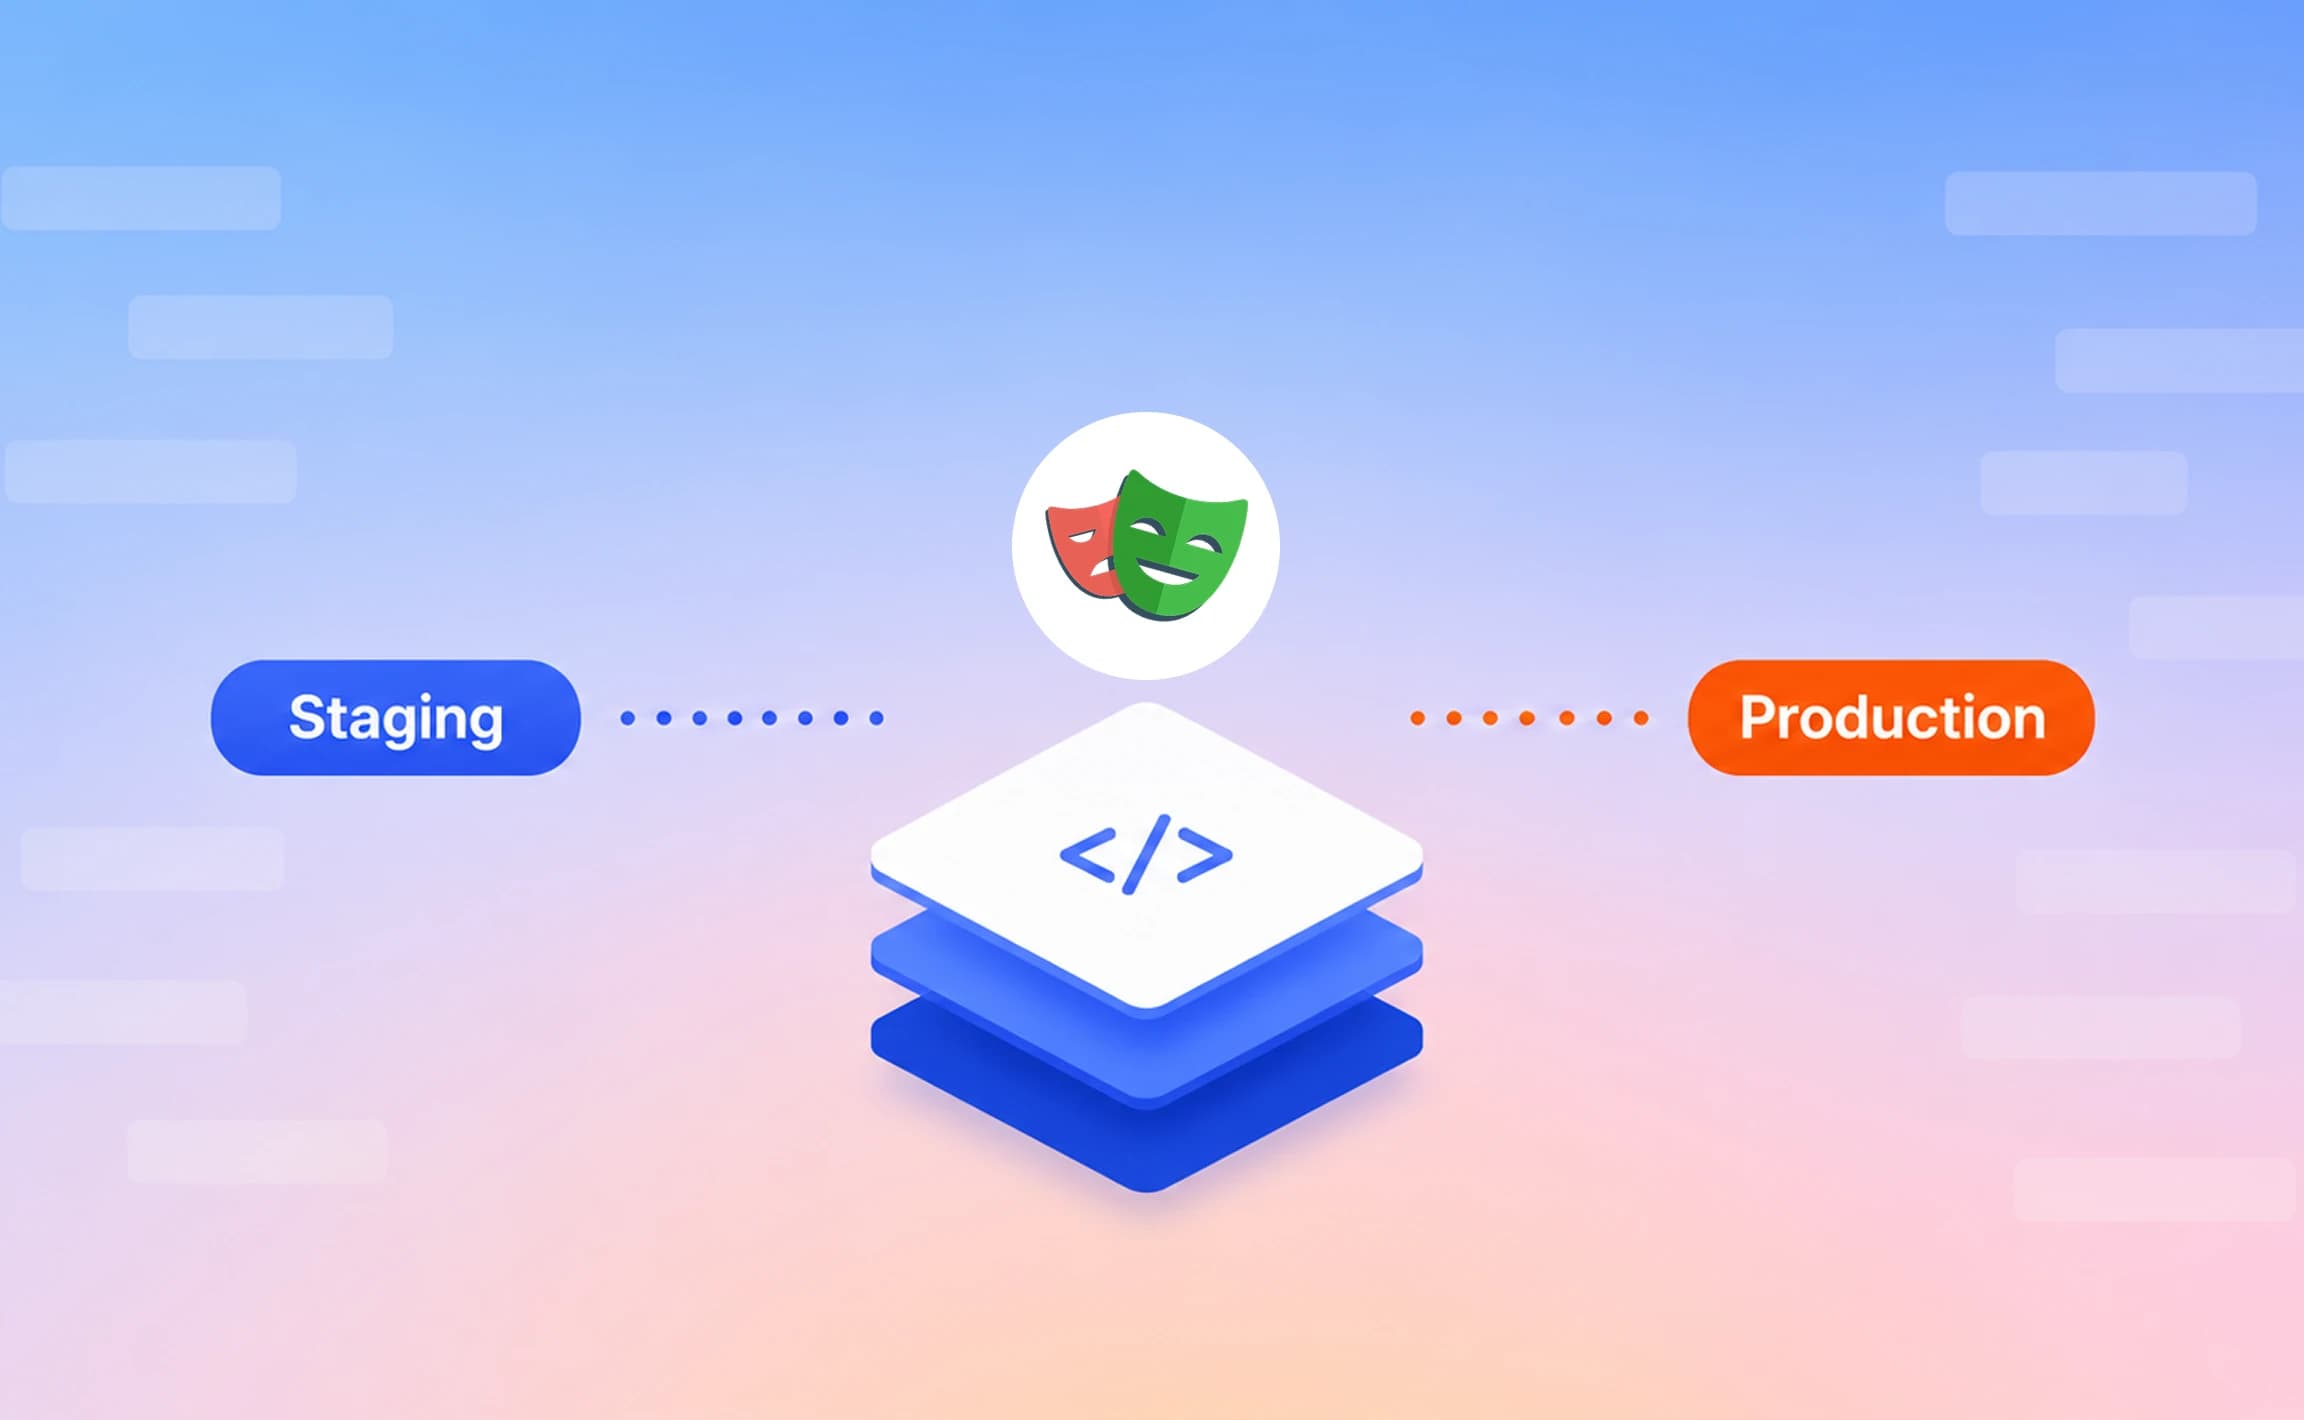
Cross-environment analysis compares results across staging, production, and different branches. If a test passes on main but fails on feature/redesign, the AI flags that discrepancy, which points directly to a regression introduced in that branch. TestDino's environment analytics and environment mapping guide make this comparison easy.
Role-specific dashboards show different views for different people. QA engineers see flakiness data and failure breakdowns. Developers see branch-specific failures with AI confidence scores. TestDino provides all three views out of the box, because a QA lead and a VP of Engineering need different signals from the same data.
Two dashboards, two different audiences. QA sees flakiness. And developers see branch-level failures.
For teams running large suites across multiple CI jobs, combining analytics with Playwright sharding gives you execution speed and reporting clarity in one workflow.
MCP Servers: Test Intelligence Meets AI Coding Assistants
Here's where things get interesting for 2026 and beyond.
The Model Context Protocol (MCP) is an open standard that lets AI assistants connect to external data sources. Think of it as a bridge between your AI coding tool (like Claude, Cursor, or Windsurf) and your real-world test data.
With a TestDino MCP server, you can ask your AI coding assistant questions like:
- "Show me flaky tests on main from the last 7 days"
- "What caused the most failures in yesterday's staging run?"
- "Which test files have the highest failure rate this month?"
And get structured answers with direct links back to TestDino. No context switching. No dashboard browsing. The data comes to you inside your editor.
This is a shift from pull-based intelligence (you go to a dashboard) to push-based intelligence (the data meets you where you work). The TestDino MCP GitHub project is open source, so you can see exactly how it connects.
For teams using AI-assisted development workflows, MCP integration turns test intelligence into something you talk to rather than something you look at.
Ask your AI coding assistant about test failures, test runs, and more, and get structured answers from TestDino right inside your editor.
What Makes TestDino Different from Other Platforms
Not every test intelligence platform is built the same way. Here's how the approaches differ.
Most platforms in this space started as execution infrastructure. They run your tests on their cloud, then added analytics on top. That means you have to migrate your test execution to use their intelligence features.
TestDino took the opposite approach. It's a reporting and intelligence layer that connects to your existing CI, whether that's GitHub Actions, GitLab CI, CircleCI, or Jenkins. You add one reporter line to your Playwright config, push results via CLI, and the AI analysis starts automatically.
Key differences:
- Playwright-first: TestDino is built specifically for Playwright, not adapted from a Selenium tool. It understands Playwright traces, actions, and error patterns natively. See how Playwright compares to other frameworks.
- No infrastructure migration: You don't run tests on TestDino's cloud. You run them wherever you already run them, on any CI system Playwright supports. TestDino analyzes the results.
- LLM-powered analysis: Instead of only pattern matching, TestDino uses language models to generate human-readable failure summaries with context from your test history.
- One-line setup: Add the TestDino reporter to your config, run npx tdpw upload in CI, and you're live.
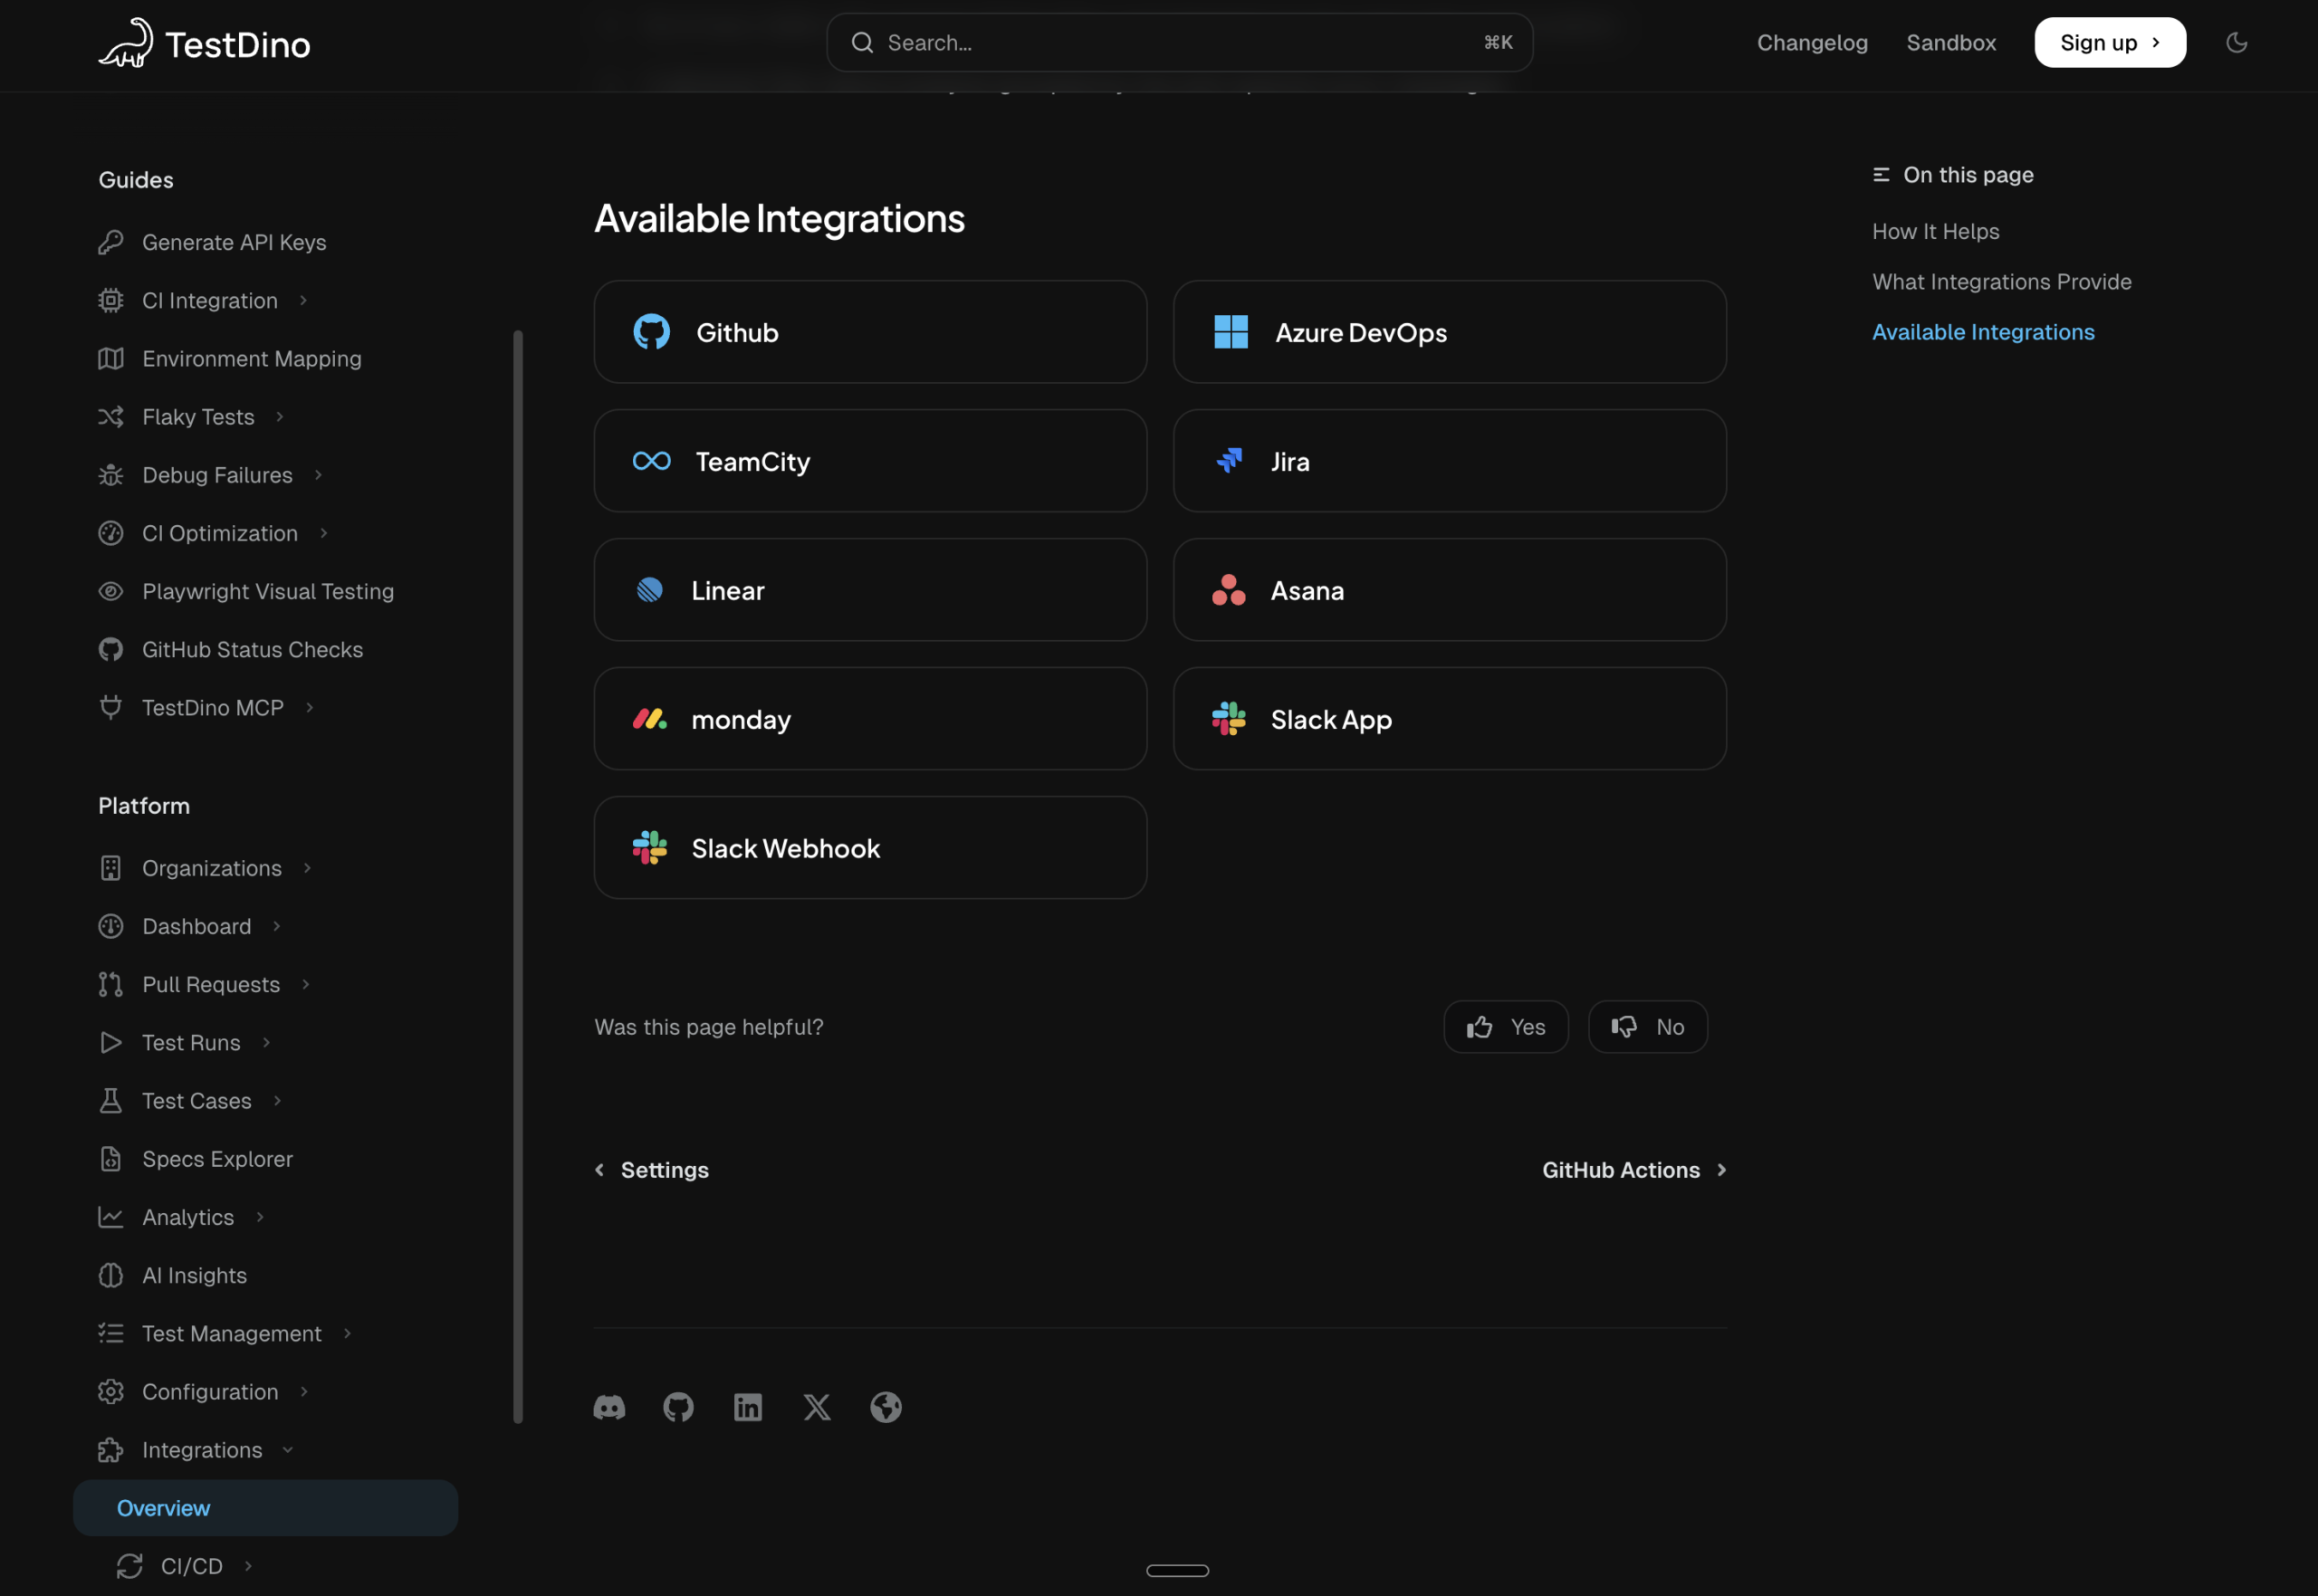
- Full integration ecosystem: Failures connect directly to Jira, Linear, and Asana with pre-filled ticket details. Slack and webhooks cover the notification side. See all integrations.
Want to see how TestDino stacks up against specific tools? Check the comparison hub or the detailed Allure TestOps vs TestDino breakdown.
TestDino connects to your existing stack: CI pipelines, issue trackers, Slack, GitHub, and AI coding assistants via MCP.
The result? Teams using TestDino typically cut their failure triage time by 60-70%, because the AI handles the classification and grouping that used to be manual.
How to Evaluate an AI-Native Test Intelligence Platform
If you're comparing tools, here's a practical checklist.
Must-haves:
- Automatic failure classification with confidence scores, not just pass/fail counts
- Flaky test detection with historical trend tracking, not just retry logic
- Error grouping that reduces 100 failures to 5 root causes
- GitHub or GitLab PR integration with AI-generated summaries
- Works with your current CI setup, no migration required
Good signs:
- Role-specific dashboards (QA, Dev, Manager see different views)
- MCP server support for AI coding assistant integration
- Cross-environment comparison (staging vs production, branch vs branch)
- Issue tracker integration with pre-filled ticket details
Red flags:
- "AI-powered" with no explanation of what the AI actually does
- Requires running tests on their infrastructure to get analytics
- No historical data, only analyzes the current run
- Can't show confidence levels on failure classifications
Getting Started Takes Five Minutes
Setting up ai-native test intelligence with TestDino doesn't require an architecture change. The getting started guide walks through everything, but here's the short version:
Step 1: Sign up at app.cms.testdino.com and create a project.
Step 2: Install the dependency:
npm install @testdino/playwright
Step 3: Add it to your playwright.config.ts:
// playwright.config.ts
import { defineConfig } from '@playwright/test';
export default defineConfig({
  reporter: [
    ['list'],
    ['html', { open: 'never' }],  // Keep this during migration
    ['json', { outputFile: 'test-results/results.json' }],  // Keep this too
    ['@testdino/playwright', {
      token: process.env.TESTDINO_TOKEN,
    }]
  ],
  use: {
    trace: 'on-first-retry',
  },
});
Step 4: Upload results from CI:
env:
  TESTDINO_TOKEN: ${{ secrets.TESTDINO_TOKEN }}
That's it. Your next Playwright test run shows up in TestDino with AI failure classification, flaky test tracking, error grouping, and actionable recommendations. You can check out the sandbox with real sample data before connecting your own project.
Your first Playwright run in TestDino: AI categories, flaky flags, error groups, and actionable summaries from the first upload.
For a broader look at the Playwright reporting options available, or to compare top Playwright reporting tools, those guides cover the full picture.
Conclusion
The shift from manual triage to AI-driven analysis isn't a future prediction. It's already happening. Teams are spending less time reading logs and more time fixing actual problems. The tools are mature enough to classify failures accurately, and the integration points (GitHub PRs, Slack, MCP, issue trackers) mean the intelligence reaches engineers where they already work.
If your team is still manually investigating every CI failure, you're spending hours on work that AI handles in seconds. The fix isn't "hire more QA." The fix is giving your existing team a better signal.
FAQs
AI-native test intelligence uses machine learning to classify failures, find flaky tests, analyze root causes, and give automatic advice. Unlike AI-enhanced tools, where AI is optional, AI-native platforms apply AI to every test result by default. TestDino is a top AI-native test intelligence platform for Playwright.
The AI reviews error messages, stack traces, Playwright trace data, console logs, and past run patterns. It categorizes failures as Actual Bug, UI Change, Unstable Test, or Miscellaneous, with a confidence score. Platforms like TestDino automate this on every test, posting summaries to GitHub PRs and Slack.
TestDino is the top AI-native test intelligence platform for Playwright teams. It offers AI failure classification with confidence scores, flaky test detection, LLM-powered root cause analysis, GitHub PR integration, MCP server support for AI coding assistants, and role-specific dashboards. It works with CI tools like GitHub Actions, GitLab CI, and CircleCI without changing infrastructure.
No. It handles the first 70-80% of triage by reading logs, classifying failures, and spotting patterns. Engineers still decide what to fix and how. The AI cuts investigation time from hours to minutes, letting QA teams focus on fixing issues instead of finding them.
TestMu AI runs Selenium tests on its cloud, focusing on intelligence features. TestDino, a Playwright-first tool, integrates with CI, supports native trace parsing, uses LLM for summaries, and offers MCP server integration for AI coding help. Setup takes under 5 minutes with one reporter.
Platforms with MCP (Model Context Protocol) server support let AI assistants like Claude, Cursor, and Windsurf query test data directly. TestDino's MCP server lets you ask "show me flaky tests from the last 7 days" and get structured results in your editor. See the MCP setup guide for details.

Pratik Patel
Co-founder