Top 6 Playwright reporting tools for faster CI debugging
Top 6 Playwright reporting tools that speed up CI debugging with clear logs and actionable insights. Reduce failure analysis time and keep pipelines reliable.

When Playwright tests fail in CI, the problem is rarely the failure itself.
The real challenge is understanding why the failure happened - fast enough to avoid blocking releases.
As Playwright test suites scale, teams often spend hours digging through raw logs, rerunning pipelines, and manually correlating screenshots or traces. Without proper reporting, debugging becomes slow, error-prone, and reactive.
This is exactly where a Playwright Reporting Tool becomes essential.
Smart Playwright Reporting Tools transform raw execution data into structured insights using dashboards, traces, screenshots, videos, and historical trends. Instead of guessing, engineers can quickly identify root causes, reduce CI noise, and restore confidence in test results.
In this guide, we'll review the top Playwright reporting tools used by QA teams in 2026 and explain how each one helps accelerate CI debugging and improve test reliability.
Feature Comparison: Playwright Reporting & Analytics Tools
| Feature / Tool | TestDiNO | ReportPortal | Microsoft Playwright Testing | Allure TestOps | Xray Reporter |
|---|---|---|---|---|---|
| Native Playwright Support | ✅ | ✅ | ✅ | ⚠️ Via adapter | ⚠️ Via integration |
| Report Type | Cloud dashboards | Centralized analytics | Built-in Playwright reports | Test management + reports | Test management reports |
| Real-Time Reporting | ✅ | ✅ | ❌ | ✅ | ❌ |
| Failure Analysis | ✅ Advanced (root cause) | ✅ AI-based clustering | ⚠️ Basic | ⚠️ Moderate | ❌ Limited |
| Historical Trends | ✅ | ✅ | ❌ | ✅ | ⚠️ Basic |
| Flaky Test Detection | ✅ | ✅ | ❌ | ⚠️ Partial | ❌ |
| CI/CD Integration | ✅ GitHub, GitLab, Jenkins | ✅ Extensive | ✅ GitHub Actions | ✅ Extensive | ✅ Jira pipelines |
| Debug Artifacts (Screenshots, Videos, Traces) | ✅ Full support | ✅ Full support | ✅ Native | ✅ Full support | ⚠️ Limited |
| Scalability for Large Test Suites | ✅ High | ✅ Enterprise-grade | ⚠️ Limited | ✅ High | ⚠️ Medium |
| Best For | Modern QA teams | Enterprise QA orgs | Playwright-first teams | QA + Test management | QA + Test management |
| Deployment Model | SaaS | SaaS / Self-hosted | Cloud (Preview) | SaaS / Self-hosted | SaaS |
| Pricing Model | Paid (team-based) | Paid (usage-based) | TBD (Preview) | Paid (enterprise) | Open-Source |
Top Playwright Reporting Tools Used by QA Teams in 2026
Modern QA teams rely on specialized Playwright reporting tools to improve CI debugging speed, track test health, and gain actionable insights. Each tool serves different reporting needs depending on team size, CI complexity, and automation maturity.
1. TestDino:
Overview
TestDino is a Playwright-focused reporting and test visibility platform designed to support teams at different levels of CI maturity. It offers two reporting approaches, allowing teams to start simple and adopt more advanced capabilities as their CI usage grows.
Reporting Option 1: Native Playwright JSON + HTML Reports
The first approach uses Playwright's native JSON and HTML reports, which are uploaded to TestDino after the test run completes.
This option is ideal for:
-
Small teams or startups
-
Simple CI pipelines
-
Teams that want zero disruption to their existing Playwright setup
In this mode, Playwright runs normally, generates its HTML and JSON output, and TestDino processes the completed report once execution finishes. Teams get centralized access to test results, screenshots, and traces without introducing additional runtime complexity.
Reporting Option 2: TestDino Custom Reporting
For more advanced CI teams, TestDino offers a custom TestDino reporting format. This option generates reports in TestDino's own structure, which can capture significantly more metadata than Playwright's native HTML/JSON output.
This matters because Playwright's default reports are designed mainly for "what happened in this run," while TestDino's custom format is designed for "what happened, why it happened, and how to optimize CI around it."
What this option includes by default
-
Richer metadata than native Playwright HTML/JSON (run context, execution signals, CI-level details, etc.)
-
Real-time status updates during execution (no need to wait for the full HTML report to finish)
-
Full CI controls that enable deeper workflow and pipeline optimization
-
WebSockets-based live streaming for continuous updates as tests run
-
Enables CI optimization use cases like smarter sharding, job/runner orchestration, and faster feedback loops
In short
- Native JSON/HTML upload = simple, post-run reporting with minimal change
- TestDino custom reporting = richer metadata + real-time updates + CI controls for teams operating at scale
Key Features
- AI-powered failure insights: automatically analyzes logs, traces, and history to explain why tests failed.
- Adaptive failure classification: learns from project patterns and labels tests as UI change, bug, unstable, or skipped.
- Flaky test detection: identifies unstable tests over time instead of marking everything as "failed."
- Evidence-rich failure views: screenshots, videos, traces, logs, and steps all in one screen.
- Advanced analytics dashboards: visualize trends, performance, retry behavior, and failure hotspots.
- Historical run insights: compare test history across branches, environments, and releases.
- CI-first optimization: rerun only failed tests and reduce pipeline time + cost.
- PR + CI workflow automation: automatic PR comments, commit status updates, and base-branch comparisons.
- Role-based dashboards: tailored views for QA, developers, and managers with the right context.
- Manual + automated test case management: manage test documentation and automation together.
- Cross-environment insights: detect differences between staging, QA, and production behavior.
- Secure access & RBAC controls: granular permissions, time-limited sharing, audit logs, and secure storage.
- integrations: Slack, Jira, Linear, Asana, GitHub, CI tools, email, and bi-directional issue sync.
Best Use Case
-
Runs large Playwright suites, and debugging failures slows releases
-
Deals with flaky tests and unreliable results across CI environments
-
Needs AI-driven insights to understand why tests fail, not just that they failed
-
Wants role-based dashboards for QA, developers, and managers
-
Needs historical insights across branches, PRs, and environments
-
Wants to rerun only failed tests instead of re-running everything
-
Needs GitHub/CI automation (PR comments, commit statuses, workflow triggers)
-
Prefers evidence-rich reports (screenshots, videos, traces, logs) in one place
-
Wants deep integrations with Jira, Slack, Linear, Asana, and GitHub.
Pros
-
AI insights help teams debug faster by explaining real failure causes.
-
Reports show traces, screenshots, videos, logs, and steps together.
-
Flaky test detection and history make CI more stable and predictable.
-
CI-first workflows enable PR comments, reruns, and automation easily.
-
Role-based dashboards give each team member the right level of detail.
Cons
-
Some teams may need a short walkthrough before they feel comfortable.
-
Right now it mainly works with Playwright, and other frameworks may come later.
-
It is most useful for teams that already run tests in CI
-
AI gets smarter over time as more test runs are collected
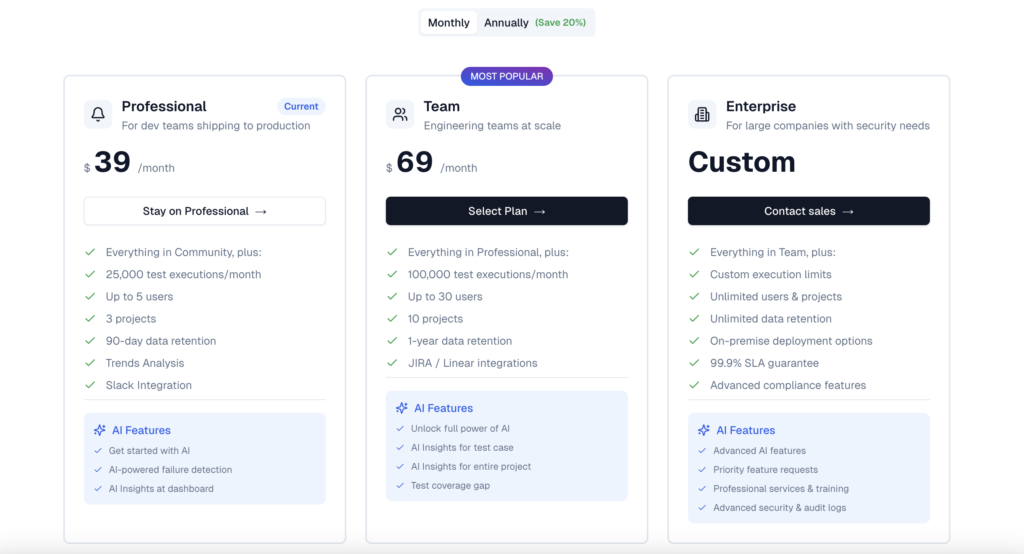
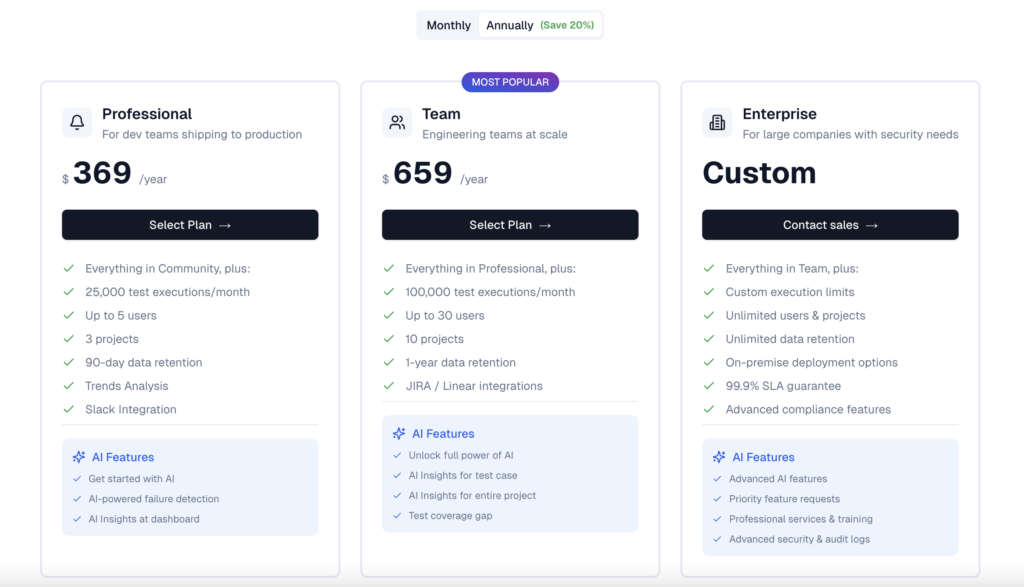
Pricing
Ideal Team Size
TestDino works well for teams of almost any size, but the value grows as your Playwright tests and CI pipelines scale.
It is an especially good fit when:
-
A team has 50+ automated tests, and debugging starts slowing people down
-
CI runs happen on every commit or pull request
-
Multiple developers or QA members share responsibility for failures
-
Flaky tests are becoming harder to track manually
Best for
-
startups growing their automation
-
mid-size teams building serious CI pipelines
-
enterprise teams managing large test suites across branches and environments
If you want to take a quick look without any setup, you can also check out our sandbox environment to see how it works in practice.
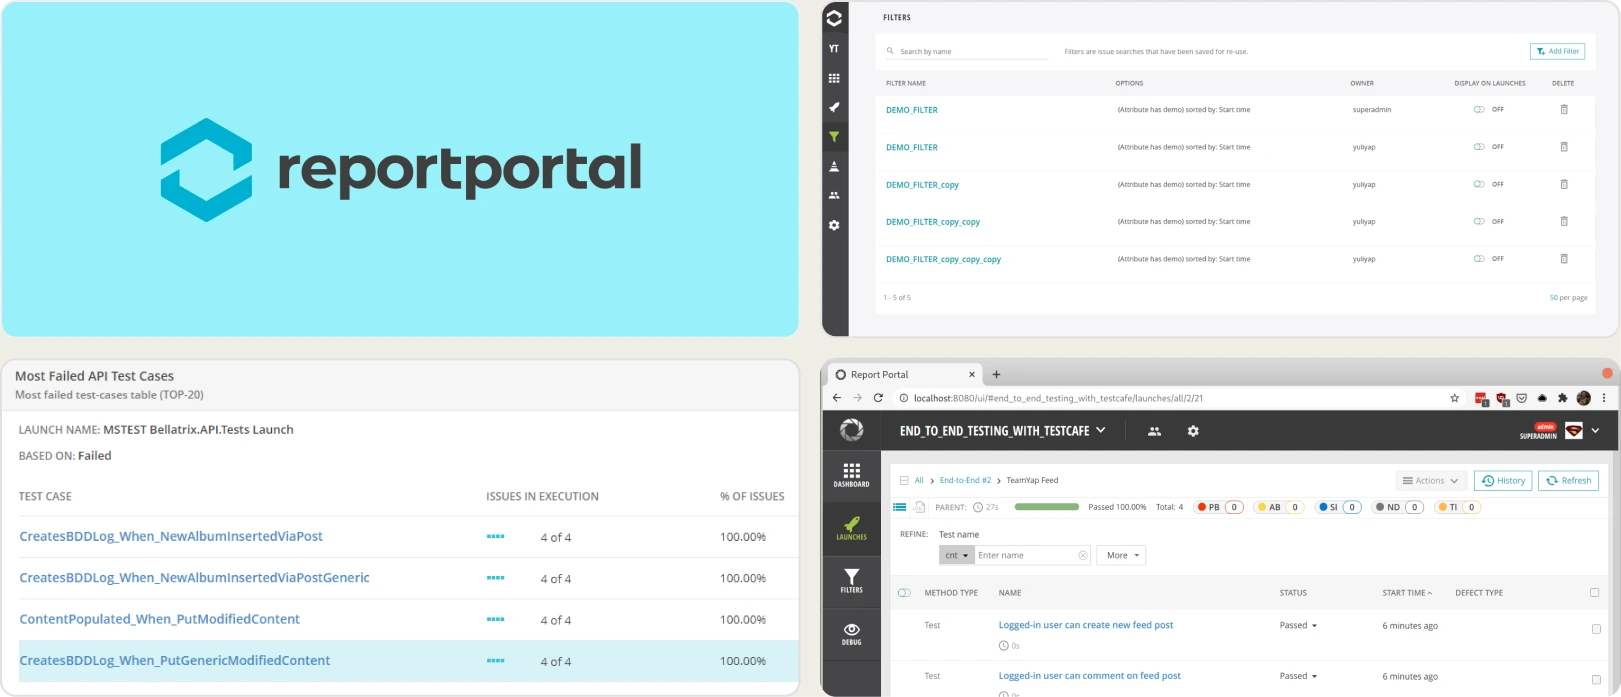
2. ReportPortal
Overview
ReportPortal is an AI-powered test analytics platform that centralizes automation results and automatically groups failures to reduce manual triage work.
Key features:
-
AI-driven failure clustering
-
Historical analytics across branches and pipelines
-
Flaky test trend detection
-
Integration with multiple automation tools and CI tools
-
Centralized execution dashboards
Best use case:
Teams with large, distributed automation suites that need help managing noisy, repetitive failures and unreliable tests.
Pros:
-
Excellent at identifying repeated failures
-
Long-term visibility across builds
-
Supports multiple testing frameworks
-
Strong analytics and reporting depth
Cons:
-
Setup and infrastructure are not beginner-friendly
-
Requires learning curve to configure dashboards well
-
Less focused on Playwright-specific debugging workflows
Pricing:
-
Self-hosted and open source (infrastructure + maintenance cost applies)
-
Paid enterprise support available
Ideal team size:
Mid-market to enterprise teams running thousands of automated tests
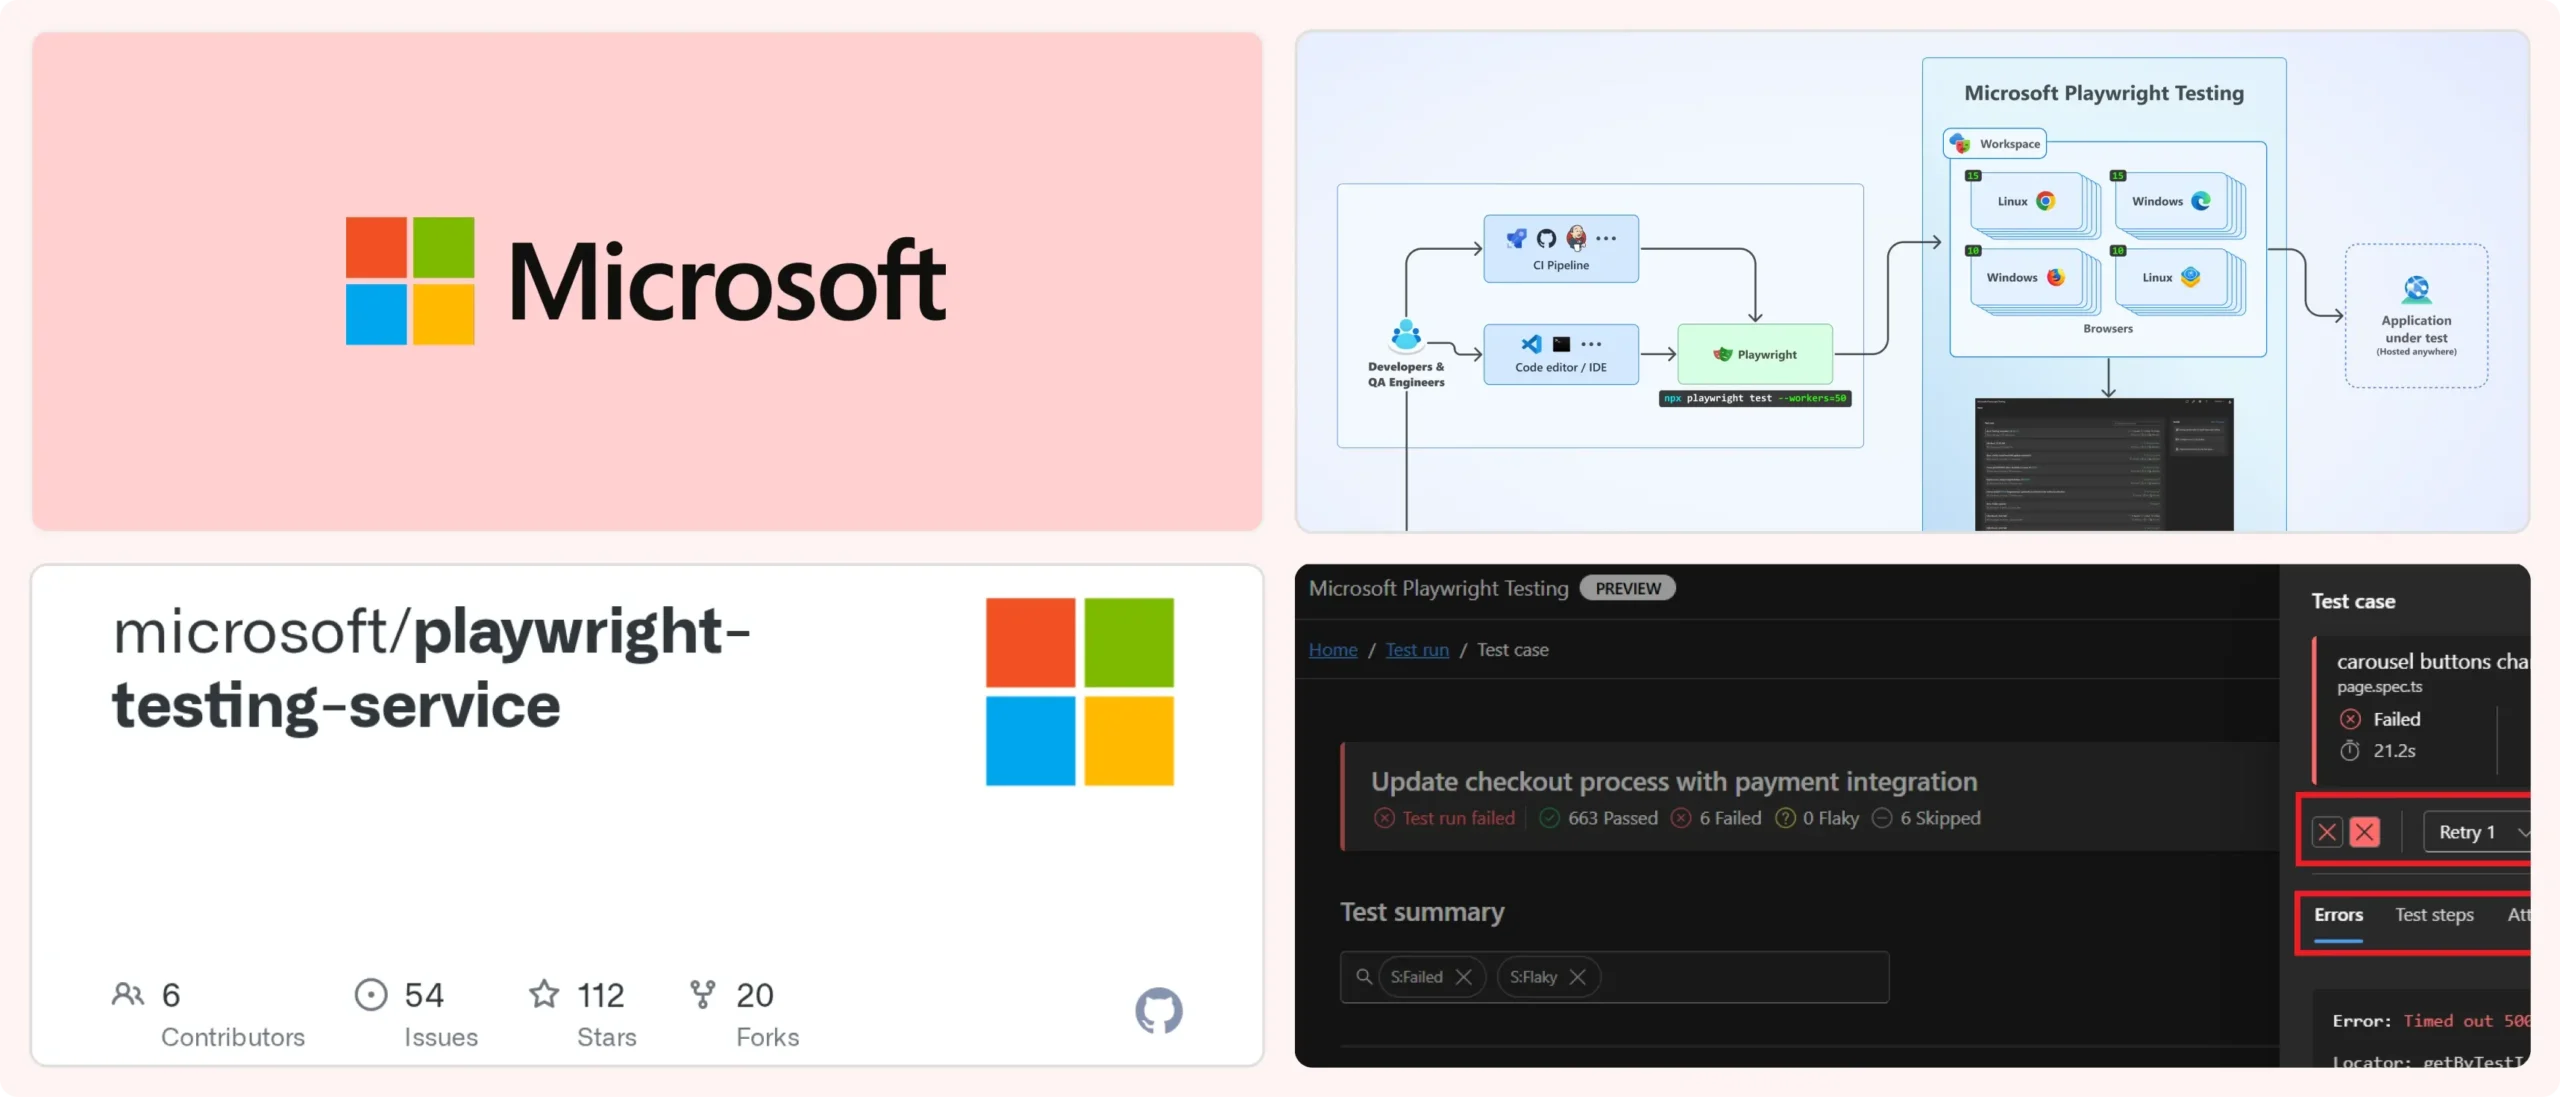
3. Microsoft Playwright Testing (Preview)
Overview
Microsoft Playwright Testing is a cloud execution and reporting service tightly integrated with the Playwright ecosystem.
Key features
-
Native Playwright trace viewer
-
Screenshots, videos, and trace artifacts
-
Cloud-hosted reports
-
Parallel execution across browsers
-
Minimal code configuration
Best use case
Teams already using Azure CI and wanting cloud execution with Playwright artifacts handled automatically.
Pros
-
Seamless Playwright integration
-
Zero infrastructure maintenance
-
Great trace debugging experience
-
Good scalability
Cons
-
Designed primarily for Playwright only
-
Limited analytics beyond run-level insights
-
Product is still evolving
-
Lock-in to Microsoft ecosystem
Pricing
Preview / usage-based pricing expected. Details depend on Azure usage.
Ideal team size
Startups to mid-market teams already using Azure DevOps.
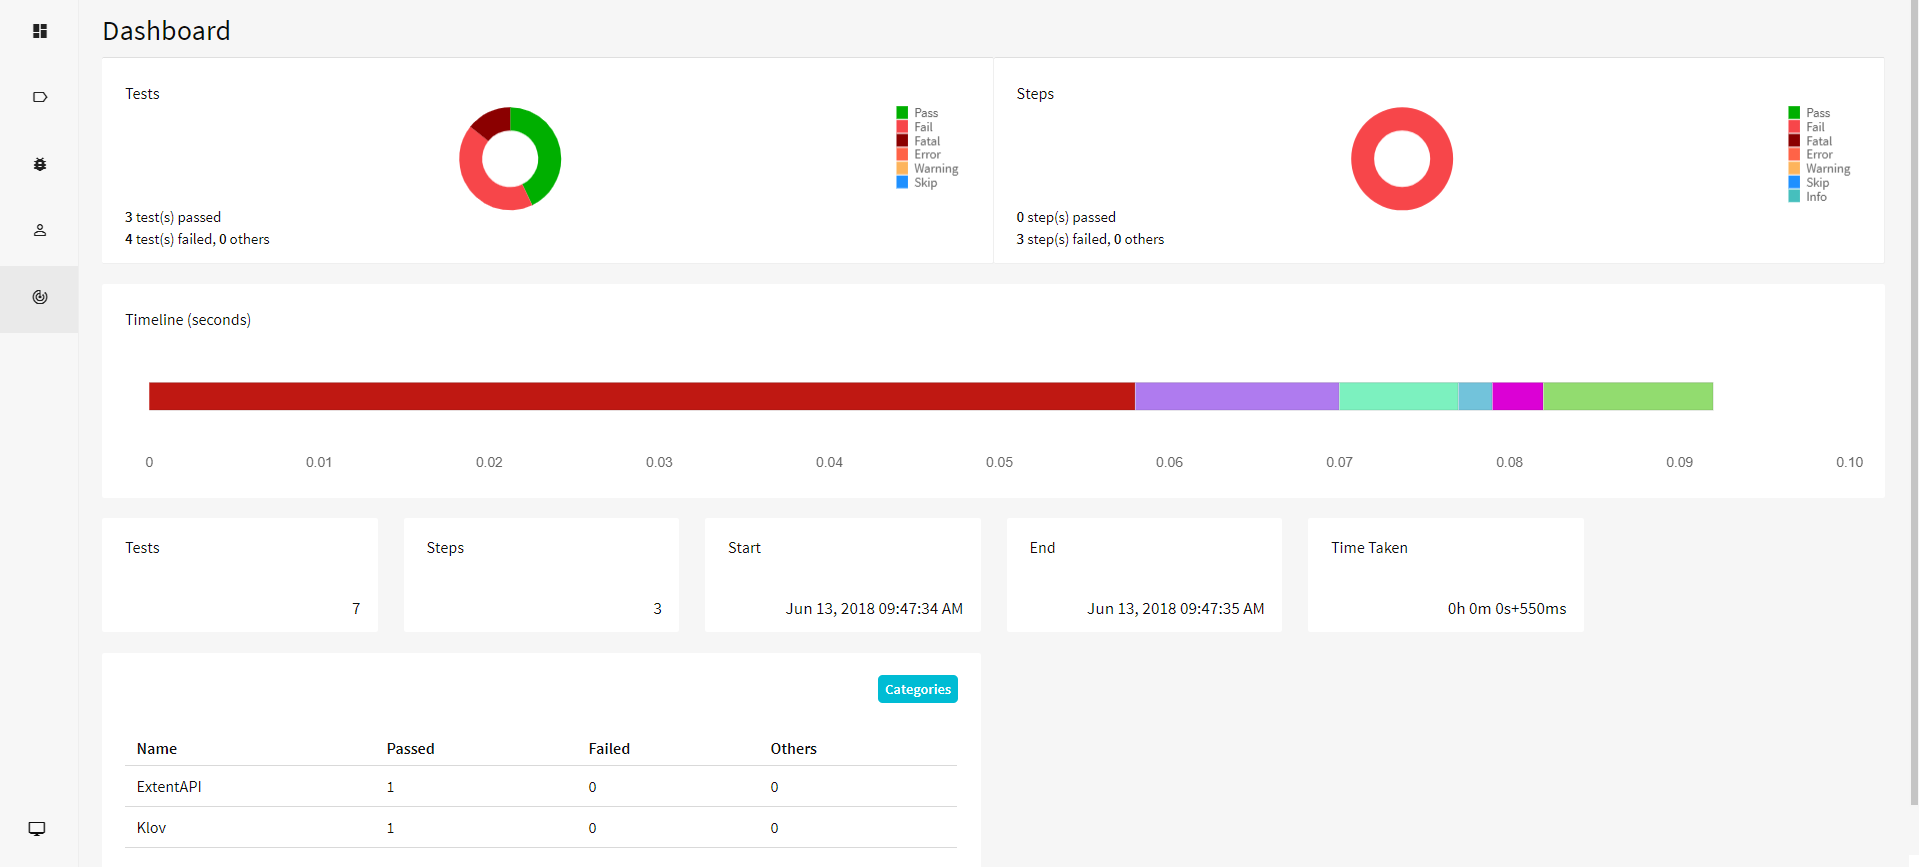
4. ExtentReports
Overview
ExtentReports is a report generation framework that produces customizable static HTML reports from automated test runs.
Key features
-
Customizable HTML dashboards
-
Screenshot embedding
-
Detailed test storytelling and logs
-
Timeline and execution flow views
Best use case
Teams that want clean reports to share with stakeholders or store as CI artifacts without complex dashboards.
Pros
-
Very flexible visual customization
-
Simple setup
-
Great for documentation or offline review
-
Open-source ecosystem
Cons
-
No centralized historical dashboards
-
No AI or flaky test detection
-
Manual management required
-
Not optimized for CI debugging workflows
Pricing
Open-source, with optional paid plugins/services
Ideal team size
Small to mid-size teams needing polished but simple reporting
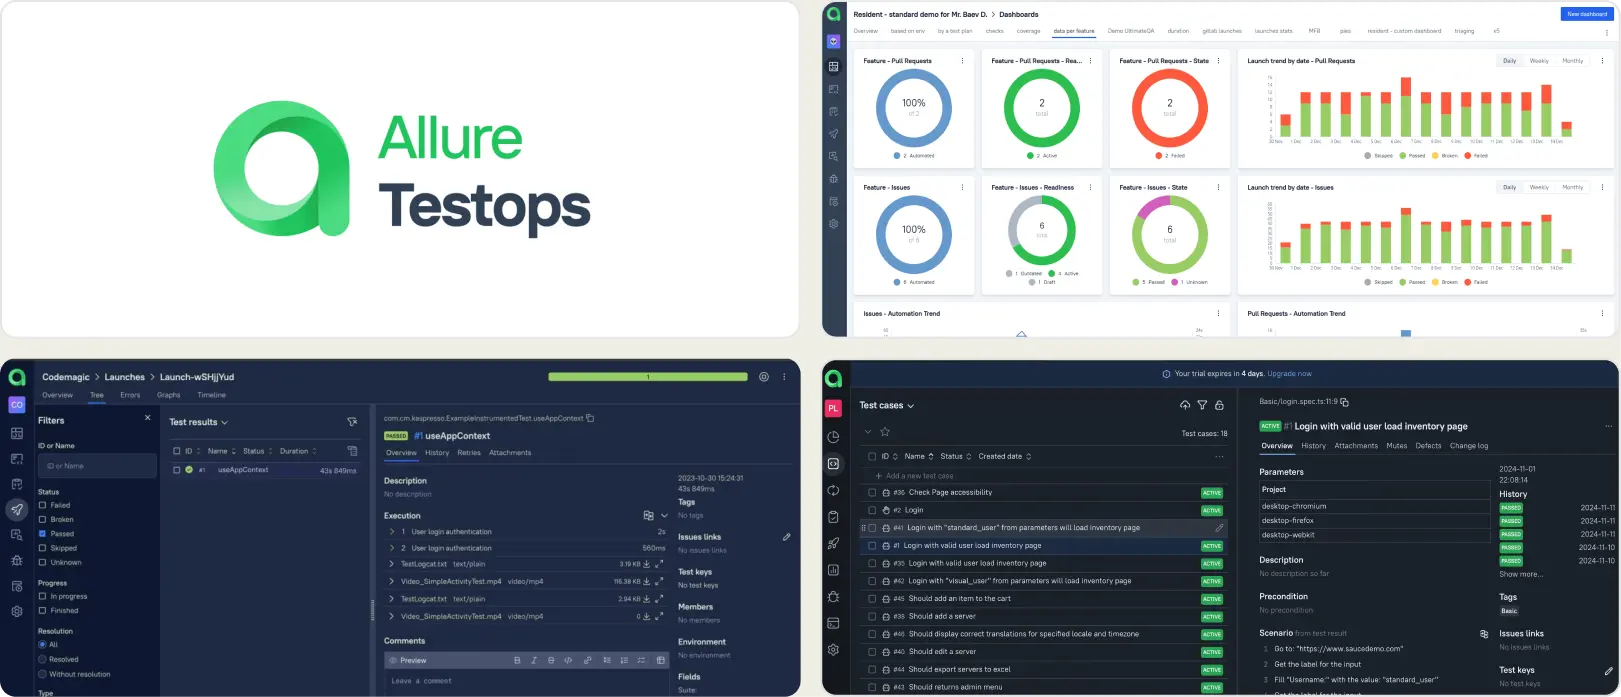
5. Allure TestOps
Overview
Allure TestOps is a test management + reporting platform that combines automation results with manual test planning and release tracking.
Key features
-
Test case management
-
Traceability between requirements and tests
-
Centralized result dashboards
-
CI / VCS integrations
-
Historical analytics
Best use case
QA organizations that need governance, visibility, and coverage tracking, not only CI debugging.
Pros
-
Strong organizational structure
-
Good visibility across projects
-
Historical insights and reports
-
Works across automation + manual testing
Cons
-
Requires server setup or SaaS subscription
-
Harder learning curve
-
Not optimized for Playwright-first workflows
-
Slower debugging than dedicated CI tools
Pricing
Commercial SaaS + on-prem options, pricing varies by seats.
Ideal team size
Mid-market to enterprise QA teams.
6. Xray Reporter
Overview
Xray Reporter is a Jira-native test management and reporting solution built for compliance and coverage tracking.
Key features
-
Requirement-to-test traceability
-
Execution tracking inside Jira
-
Compliance-ready reporting
-
CI pipeline syncing
Best use case
Organizations where audit, compliance, traceability, and approvals matter more than fast debugging.
Pros
-
Native Jira integration
-
Excellent traceability
-
Audit-friendly reporting
-
Works with many automation tools
Cons
-
Debugging happens outside Xray
-
No deep CI debugging features
-
Can feel process-heavy
-
Requires Jira ecosystem buy-in
Pricing
Jira marketplace licensing (per user).
Ideal team size
Enterprise, regulated teams
Key Features You Should Look For in a Playwright Reporting Tool
Modern Playwright suites need more than screenshots and HTML reports. The best tools help teams understand failures, stabilize CI, and accelerate releases. Tools like TestDino are designed around exactly this problem space.
Below are the capabilities that truly matter.
1. AI-Powered Failure Understanding
A strong reporting tool shouldn't simply say "test failed." It should help explain why it failed.
Look for tools that:
-
Classify errors into meaningful categories (UI change, actual bug, unstable, network, timeout, skipped, config issues, etc.)
-
Use ML + LLMs to analyze logs, traces, and history
-
Provide human-readable root-cause explanations
-
Suggest possible fixes or next debugging steps
AI should help engineers get to insight faster, not replace judgment, but eliminate guesswork.
2. Evidence-Rich Failure Views
Debugging becomes easier when everything is in one place.
A modern Playwright reporter should show:
-
Screenshots and failure points
-
Videos with playback
-
Full Playwright traces
-
Console + network logs
-
Step-by-step execution details
-
Image comparison for visual mismatches
If you're still downloading artifacts manually from CI, the reporting layer is doing too little.
3. Flaky Test Detection That Actually Tracks Patterns
Flaky tests kill trust.
A good reporter should:
-
Track instability across environments
-
Show long-term flakiness trends
-
Highlight tests that fail intermittently
-
Separate "real failures" from "environment noise."
That way, teams stop rerunning blindly and start fixing what matters.
4. Historical Trends, Not Just Pretty Dashboards
Dashboards are meaningless without context.
Look for tools that offer:
-
Full test history
-
Branch and PR-based analytics
-
Run-to-run comparison
-
Trend visualization across weeks/months
-
Cross-environment behavior insights
You should be able to answer instantly:
"Did this fail before? Where, how often, and in which environment?"
5. CI-First Workflow Design
Playwright reporting should fit naturally into CI, not replace it.
Ideal features:
-
Automatic uploads after CI runs
-
Rerun-only workflows (run failed tests without losing context)
-
Smart grouping of retries and attempts
-
PR comments + commit status updates
-
Workflow triggers without pushing new code
-
Links between failures and commits
The less friction from CI → debugging, the faster your team moves.
6. Role-Based Dashboards for Real Teams
Different roles need different views.
Look for:
-
QA dashboards focused on failures, blockers, and release readiness
-
Developer dashboards showing root causes and file locations
-
Manager dashboards showing stability trends and risk overview
-
Secure role-based access (RBAC)
Everyone should get exactly the insight they need, not noise.
7. Test & Project Management Where It Makes Sense
Bonus (but powerful) capability:
-
Manual + automated test management in one place
-
Suites, hierarchy, cloning, bulk editing
-
Multi-project visibility and central organization reporting
This prevents juggling spreadsheets or separate tools.
8. Strong Security & Access Controls
Because test data often contains sensitive logs.
Look for:
-
Role-based permissions
-
Time-limited external access sharing
-
API keys + JWT
-
Secure artifact storage
-
Full audit logs
Enterprise teams expect this from day one.
What is the Best Playwright Reporting Tool?
There isn't a single one-size-fits-all answer; the best Playwright reporting tool depends on your goals.
For quick visibility into test failures, built-in Playwright reporters like HTML and JSON are often enough. For deep CI debugging, history tracking, flaky detection, and team dashboards, third-party tools like TestDino, ReportPortal, Allure, and Tesults elevate raw data into actionable insights.
Playwright itself has several built-in reporters you can configure without extra setup.
For example,
-
HTML format
-
JSON format
-
JUnit format
-
Line format
-
List format
-
Dot format
Each one serves different purposes, depending on the level of detail you need and the type of CI integration you're working with.
With third-party tools, you can centralize reports, visualize trends over time, and correlate failures across branches and environments, which are essential as test suites scale and CI complexity grows.
Does Playwright Have Built-In Reporting?
Yes, Playwright does include built-in reporting capabilities right out of the box. When you run npx playwright test, the runner produces results and supports the following built-in reporters:
- HTML Reporter: Rich, interactive reports with pass/fail status and traces
- JSON Reporter: Machine-readable output useful for CI and automation tools
- JUnit Reporter: Standard XML format for CI systems like Jenkins, GitLab, etc.
- List/Line/Dot Reporters: Lightweight consoles for quick feedback
Playwright's built-in reporters can be configured in your playwright.config.js/ts:
export default defineConfig({
  reporter: [
    ['html'],
    ['json'],
    ['junit', { outputFile: 'results.xml' }]
  ],
});
You can view the HTML report locally by running:
npx playwright show-reportThese reporters provide immediate visibility into test outcomes without additional tools.

Pro Tip: Built-in reporters also integrate with Playwright traces, you configure trace recordings via:
[code_light title="playwright.config.js"]
use: {
  trace: 'on-first-retry',
}
[/code_light]
This gives you step-by-step execution evidence when tests fail.
How Do Playwright Reporting Tools Integrate With CI/CD?
Playwright tests are designed to run seamlessly in CI/CD pipelines — and reporting tools integrate by ingesting or publishing results from CI runs.
Built-In CI Support
Playwright supports CI through official docs and sample configs for GitHub Actions, GitLab CI, Jenkins, Azure DevOps, and more. You can configure pipelines to produce and export reports after each test run.
Example Playwright CI snippet (GitHub Actions):
jobs:
  test:
    runs-on: ubuntu-latest
    steps:
      - uses: actions/checkout@v4
      - run: npm ci && npx playwright install --with-deps
      - run: npx playwright test --reporter=junit
      - run: npx playwright show-report
CI systems consume files like JUnit XML, JSON, or HTML reports and can pass them into dashboards or quality gates.
Third-Party Reporting Integration
Many reporting tools integrate with CI/CD by:
Ingesting Playwright Output:
Third-party reporters often hook into Playwright via reporter plugins or upload endpoints after tests run.
For example, you can use the Tesults reporter plugin with a target token to push results automatically:
reporter: [
  ['playwright-tesults-reporter', { 'tesults-target': process.env.TARGET }]
];
This pushes test artifacts to Tesults dashboards directly after your CI step completes.
Pipeline Automation & Alerts
Advanced tools go beyond parsing reports:
-
Publish test run dashboards after every pipeline run
-
Add CI badges showing test health
-
Send alerts (Slack, email) when critical tests fail
-
Comment PRs with actionable test summaries
This turns CI runs into continuous quality checks rather than just pass/fail gates.
Conclusion
Effective Playwright reporting tools are essential for scaling test automation, speeding up CI debugging, and improving test reliability. They transform raw execution data into actionable insights, visual dashboards, and historical trends, helping teams quickly identify failures and optimize workflows.
By choosing the right reporting tools based on team size, CI complexity, and debugging ownership, QA engineers and developers can reduce reruns, detect flaky tests, and maintain high-quality releases.
FAQs

Savan Vaghani
Product Developer