Debug Playwright failures in your browser. No downloads.
Step through DOM snapshots, network calls, and console logs directly in your dashboard.

Debugging Playwright trace files
from CI is a 15-minute headache
Failed tests generate GB-sized trace zips buried in CI artifacts. You download, unzip, filter, open. 15 minutes gone and debugging hasn't even started.

Trace files are buried in CI artifacts
Every failed test generates a .zip trace file. To view it, you download it from GitHub Actions or GitLab CI, unzip it, then open it locally. With 15+ failures per run, you spend 15 minutes just downloading and opening traces before debugging even starts.
The local trace viewer has no context
Playwright's show-trace command opens a single trace in isolation. No test history, no error grouping, no way to compare this failure to last week's. You're filtering failures manually and debugging blind.
Non-engineers can't access trace data
QA leads and engineering managers want to understand failure patterns. But they're not going to clone a repo, install Playwright, and run CLI commands to view a trace file.
No direct access for AI agents
Trace files are locked inside zip archives and local viewers. AI coding agents like Cursor, Claude Code, and Copilot can't access structured failure data to help you debug. Manually reading traces when AI could do it for you is just wasted time.
How the embedded trace viewer works
Works out of the box the moment you push your first test run. No config, no extra packages, no self-hosted infrastructure.
Add the TestDino reporter
One line in your Playwright config. No wrappers, no new dependencies. Push to CI as usual and TestDino captures every trace automatically.

reporter: [
  ['@testdino/playwright', {
    token: process.env.TESTDINO_TOKEN
  }],
]
npx playwright testClick any failure to see its trace
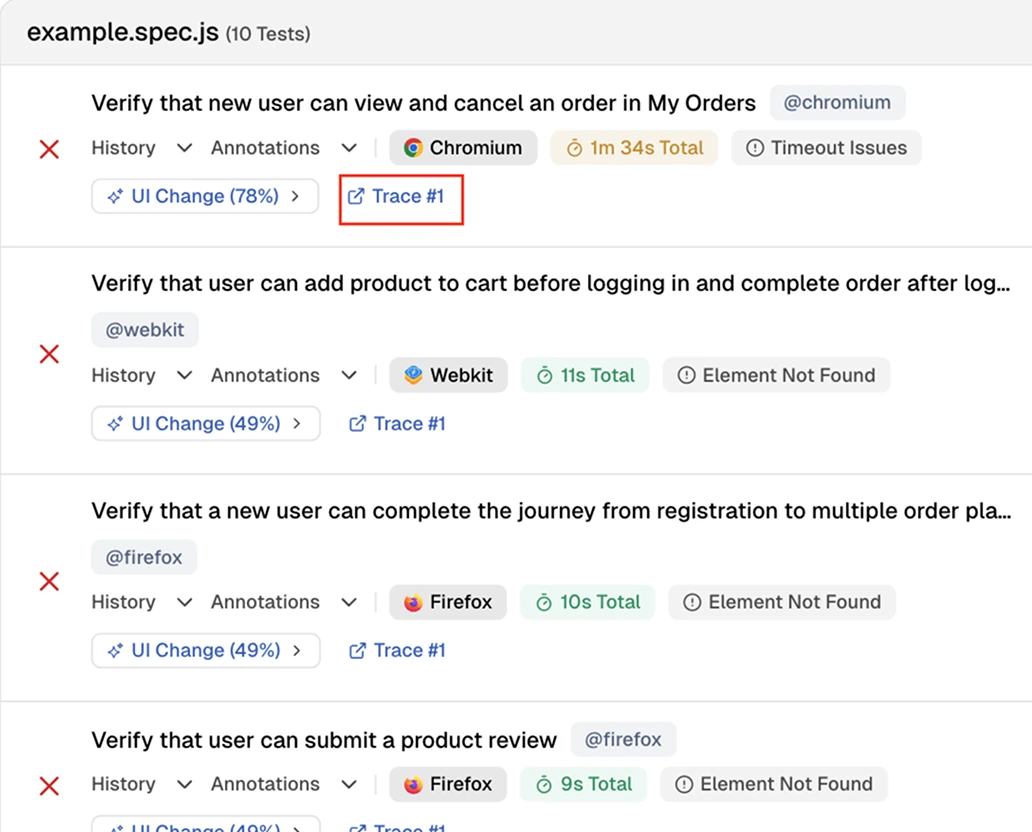
Open any spec file to see every test case with its status, browser, and a direct link to the trace. Failed tests surface immediately with their error type so you know what to investigate first.

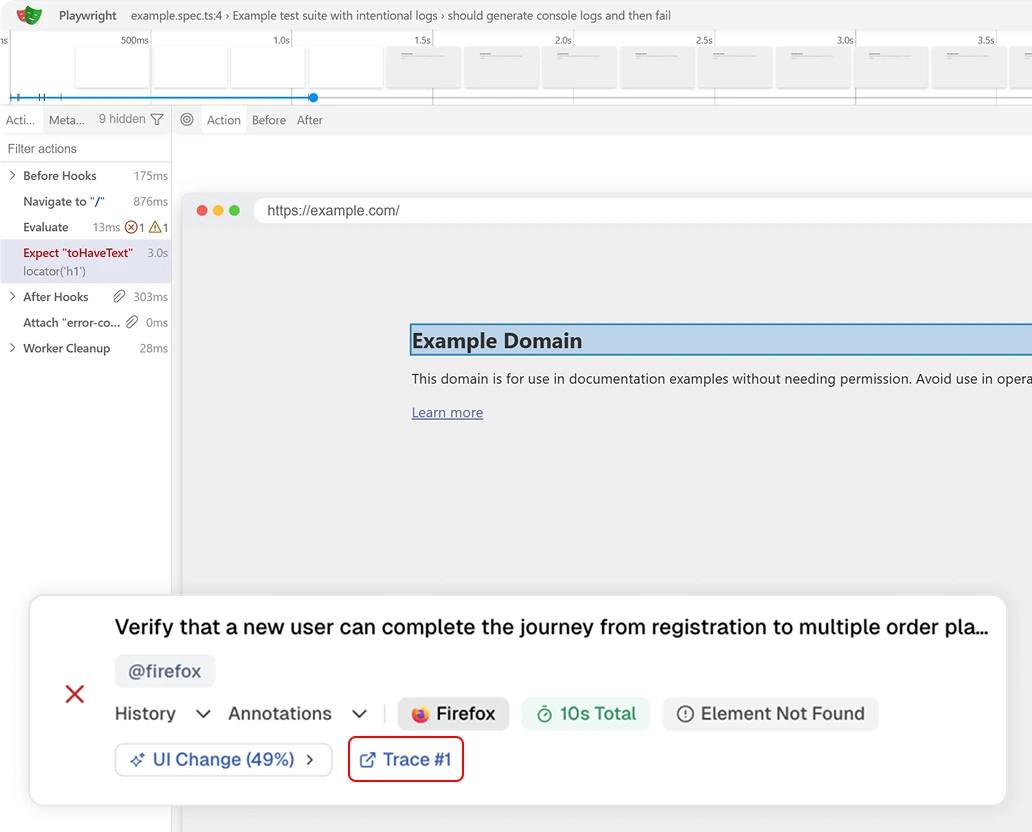
Step through the timeline
The native Playwright trace viewer loads inline. Scrub through each action and see the DOM snapshot at every step to find exactly where the test broke.
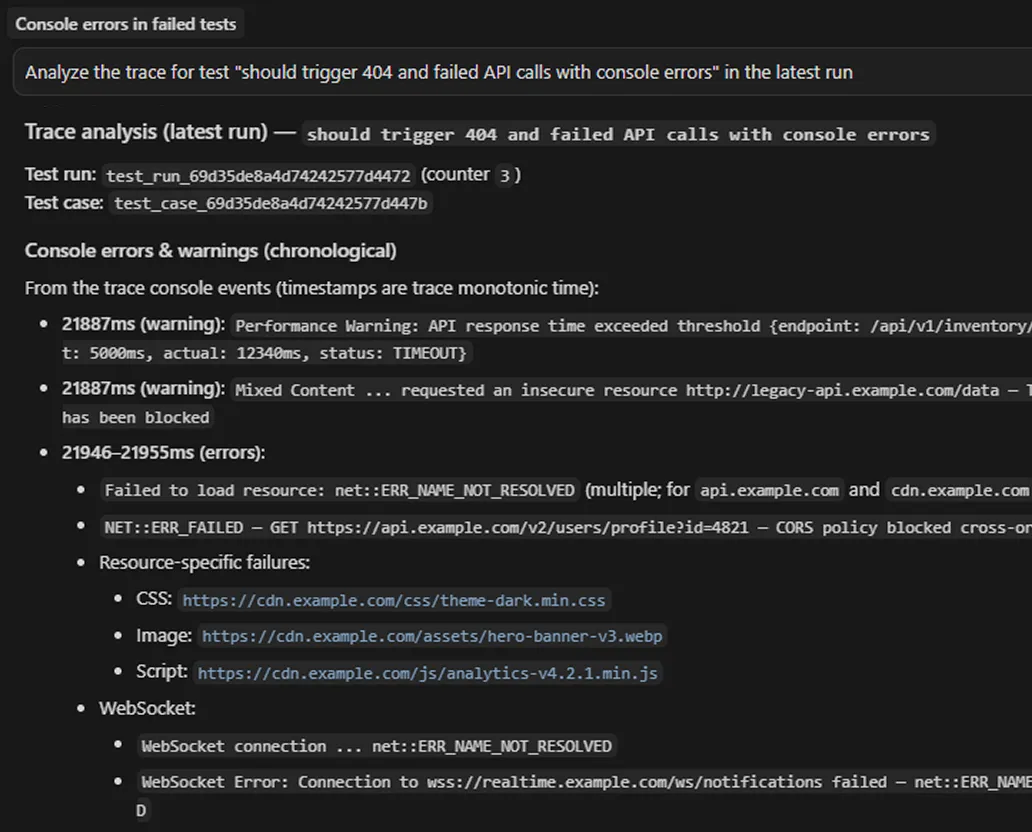
Let your AI agent debug failures for you
Connect TestDino's MCP server to Cursor, Claude Code, or Copilot. Your AI agent pulls trace data, error context, and screenshots without any downloads or local setup. It reads the failure, understands the context, and suggests a fix before you've even opened the file.
Teams love what we built
See why developers choose TestDino to ship faster and debug smarter
We were on the default Playwright reporter, and it was tedious to dig through; half a day gone just triaging failures. The TestDino MCP changed that for us. I now run through the failures in minutes instead of devoting half a day to it, and pulling the latest runs straight through the MCP sped up bug triage drastically. AI failure classification and Slack reports do the rest. It's saved us weeks.
To triage failures, down from half a day
Saved across the team

Migrating to TestDino from Currents was an easy decision. The features are stronger, the cost is lower, and the interface makes debugging far less painful. Flaky test detection and AI failure classification have simplified debugging and reduced our CI costs by cutting down reruns and noisy failures.
Reduction in CI costs
Less time triaging failures

Over 30 flaky tests and no structured way to track them, just CI artifacts and morning guesswork. TestDino's "Most Flaky Tests" feature broke this pattern. We can see failure trends now and pull up video recordings of exactly what went wrong. The TestDino MCP server is the magic piece on top, I ask my Claude agent about a failure and it pulls full context from TestDino without switching tabs. We went from 30-something flaky tests down to 3 or 4.
Fewer flaky test reruns
Faster failure triage

Trace analysis without
downloading zip files
Full trace viewer in the browser
Step through DOM snapshots, network requests, console logs, and source code for every failed test. No downloads or CLI commands.
Side-by-side with screenshots and video
Traces sit alongside failure screenshots and full execution video. All evidence in one place, not scattered across CI artifacts.
Trace history across runs
Compare traces from today's failure to last week's. Confirm whether the same step breaks repeatedly or it's a new regression.
Shareable with non-engineers
Anyone on your team can open a trace link and understand the failure visually. No tooling or CLI setup needed.
Works with sharded CI runs
Traces from parallel shards are merged and indexed automatically. Whether you run 4 or 40 shards, every trace is accessible.
Network request timeline
Inspect every API call your test triggered. Request headers, response bodies, status codes, and timing details without touching browser DevTools.
What you get with the trace viewer
Inline traces that load in your browser, no downloads needed.
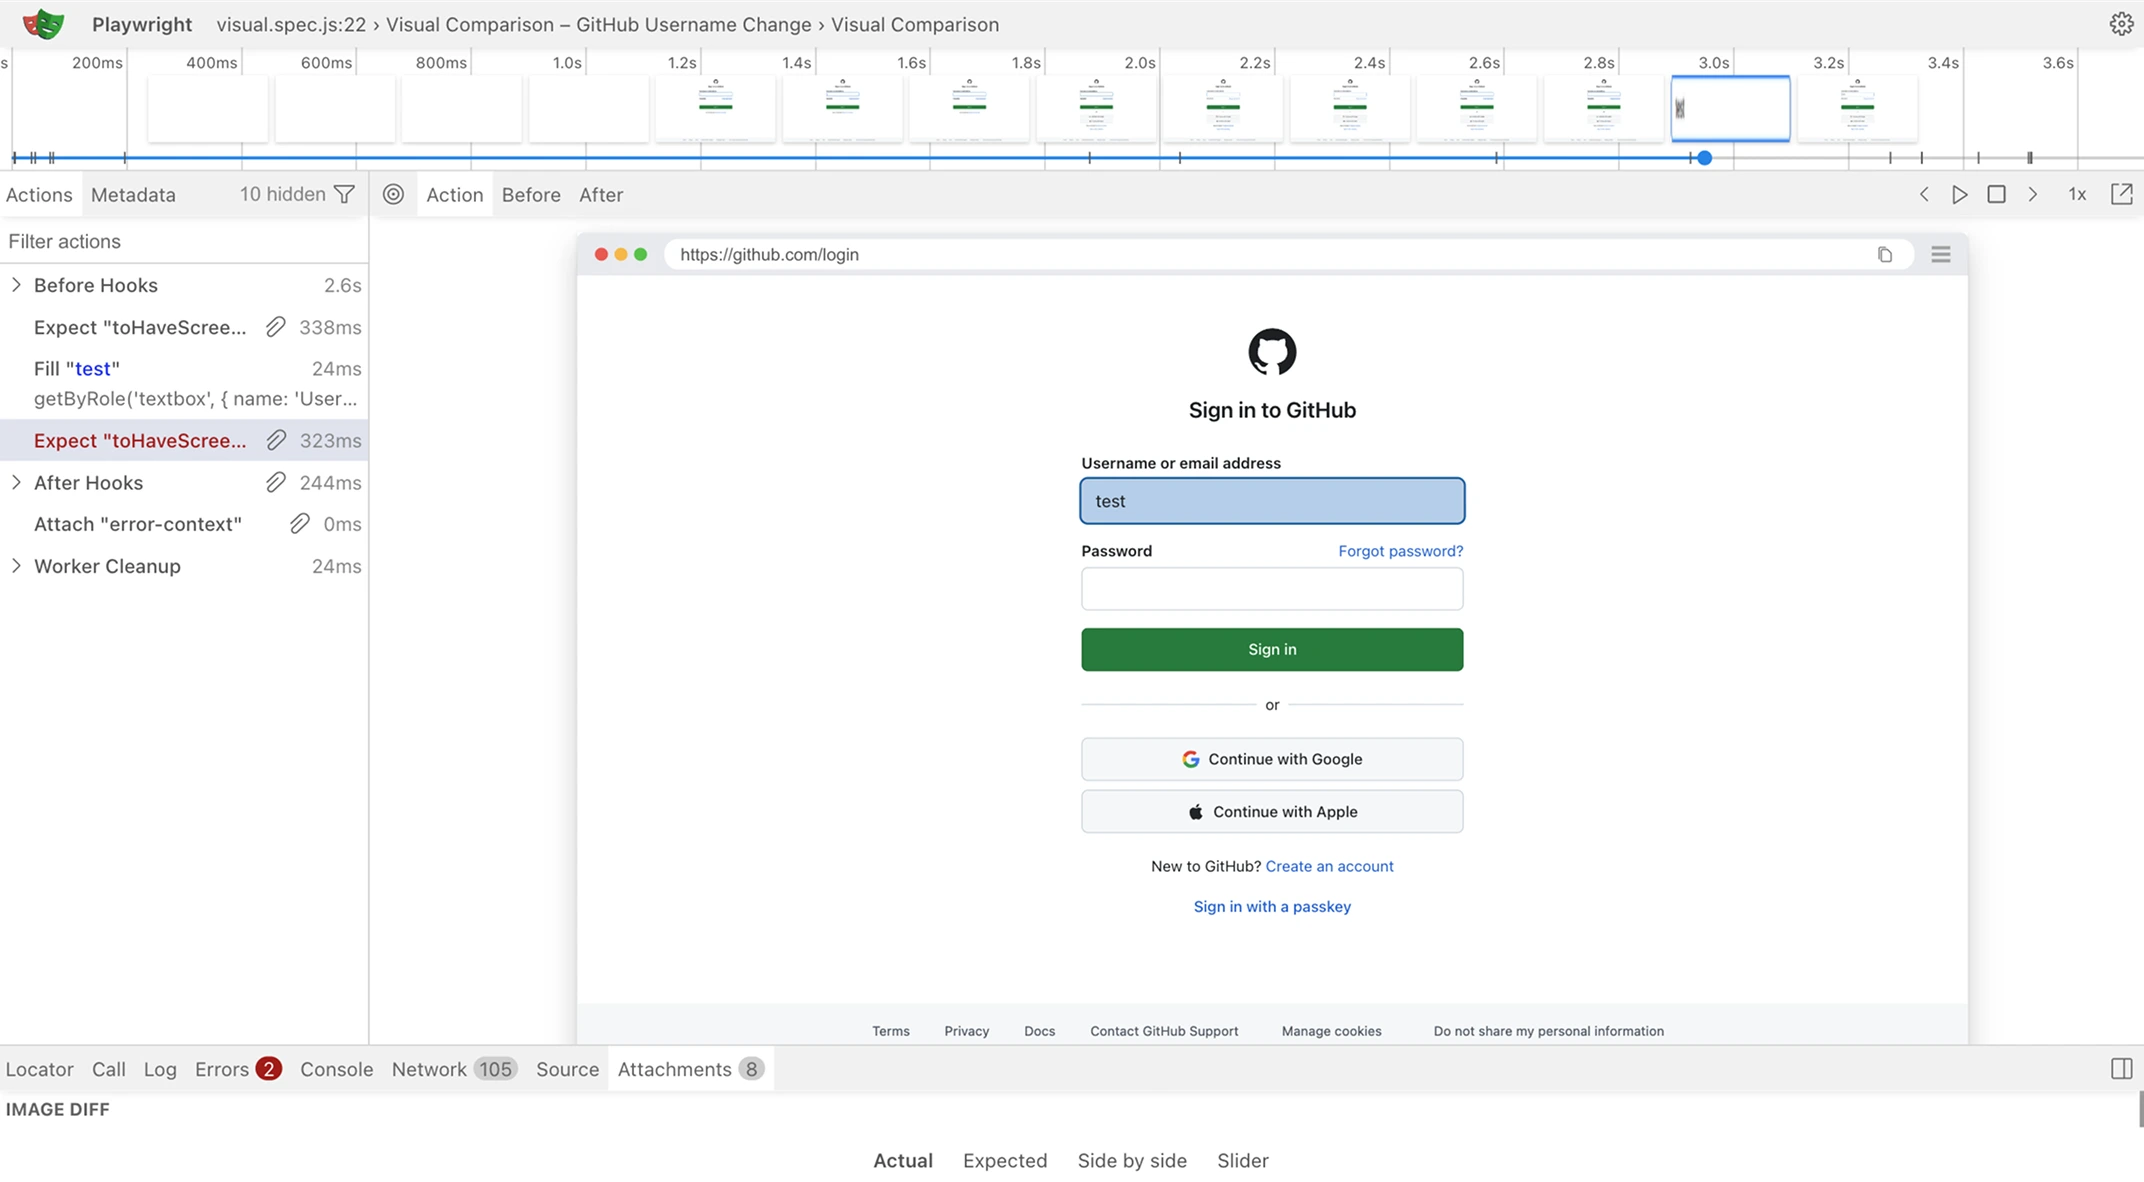
Step through every action with DOM snapshots
The trace viewer loads inline in your browser. Scrub through the full execution timeline, inspect the DOM state at each step, and see exactly which action caused the failure. No downloads required.
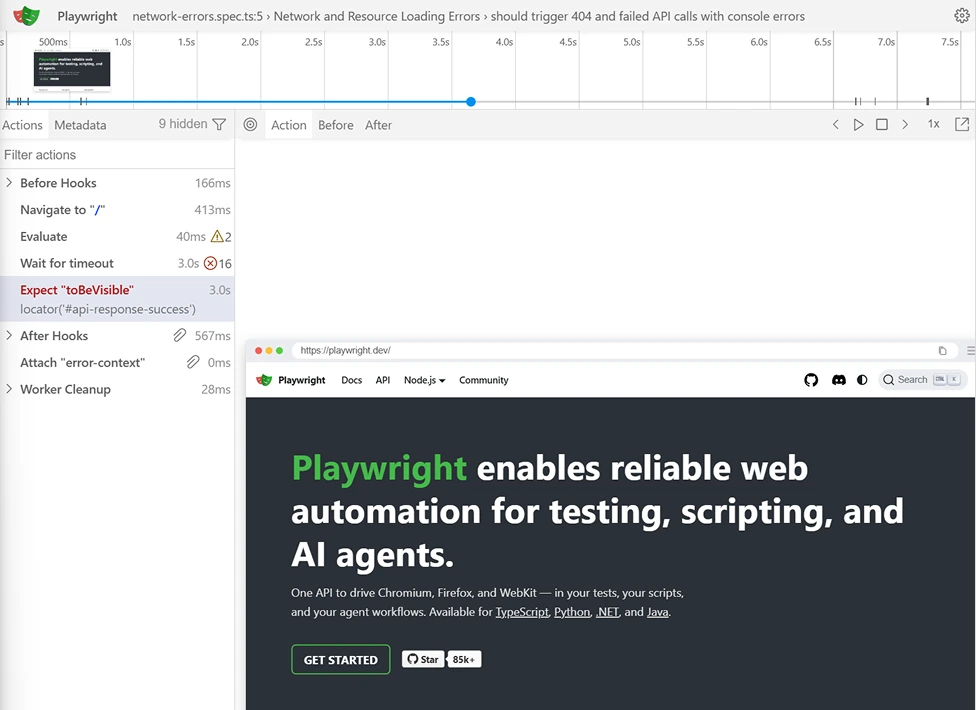
Full trace viewer with action timeline and DOM snapshots
The trace viewer shows every action your test executed alongside the DOM state at that moment. Scrub the timeline to see exactly when a timeout fired or an element went missing.
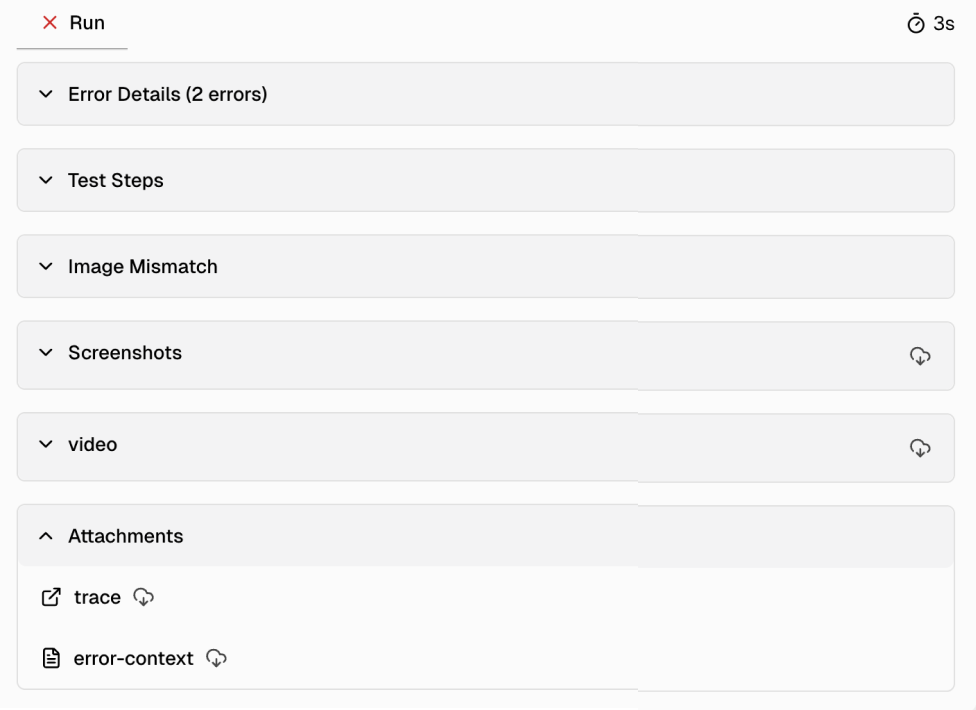
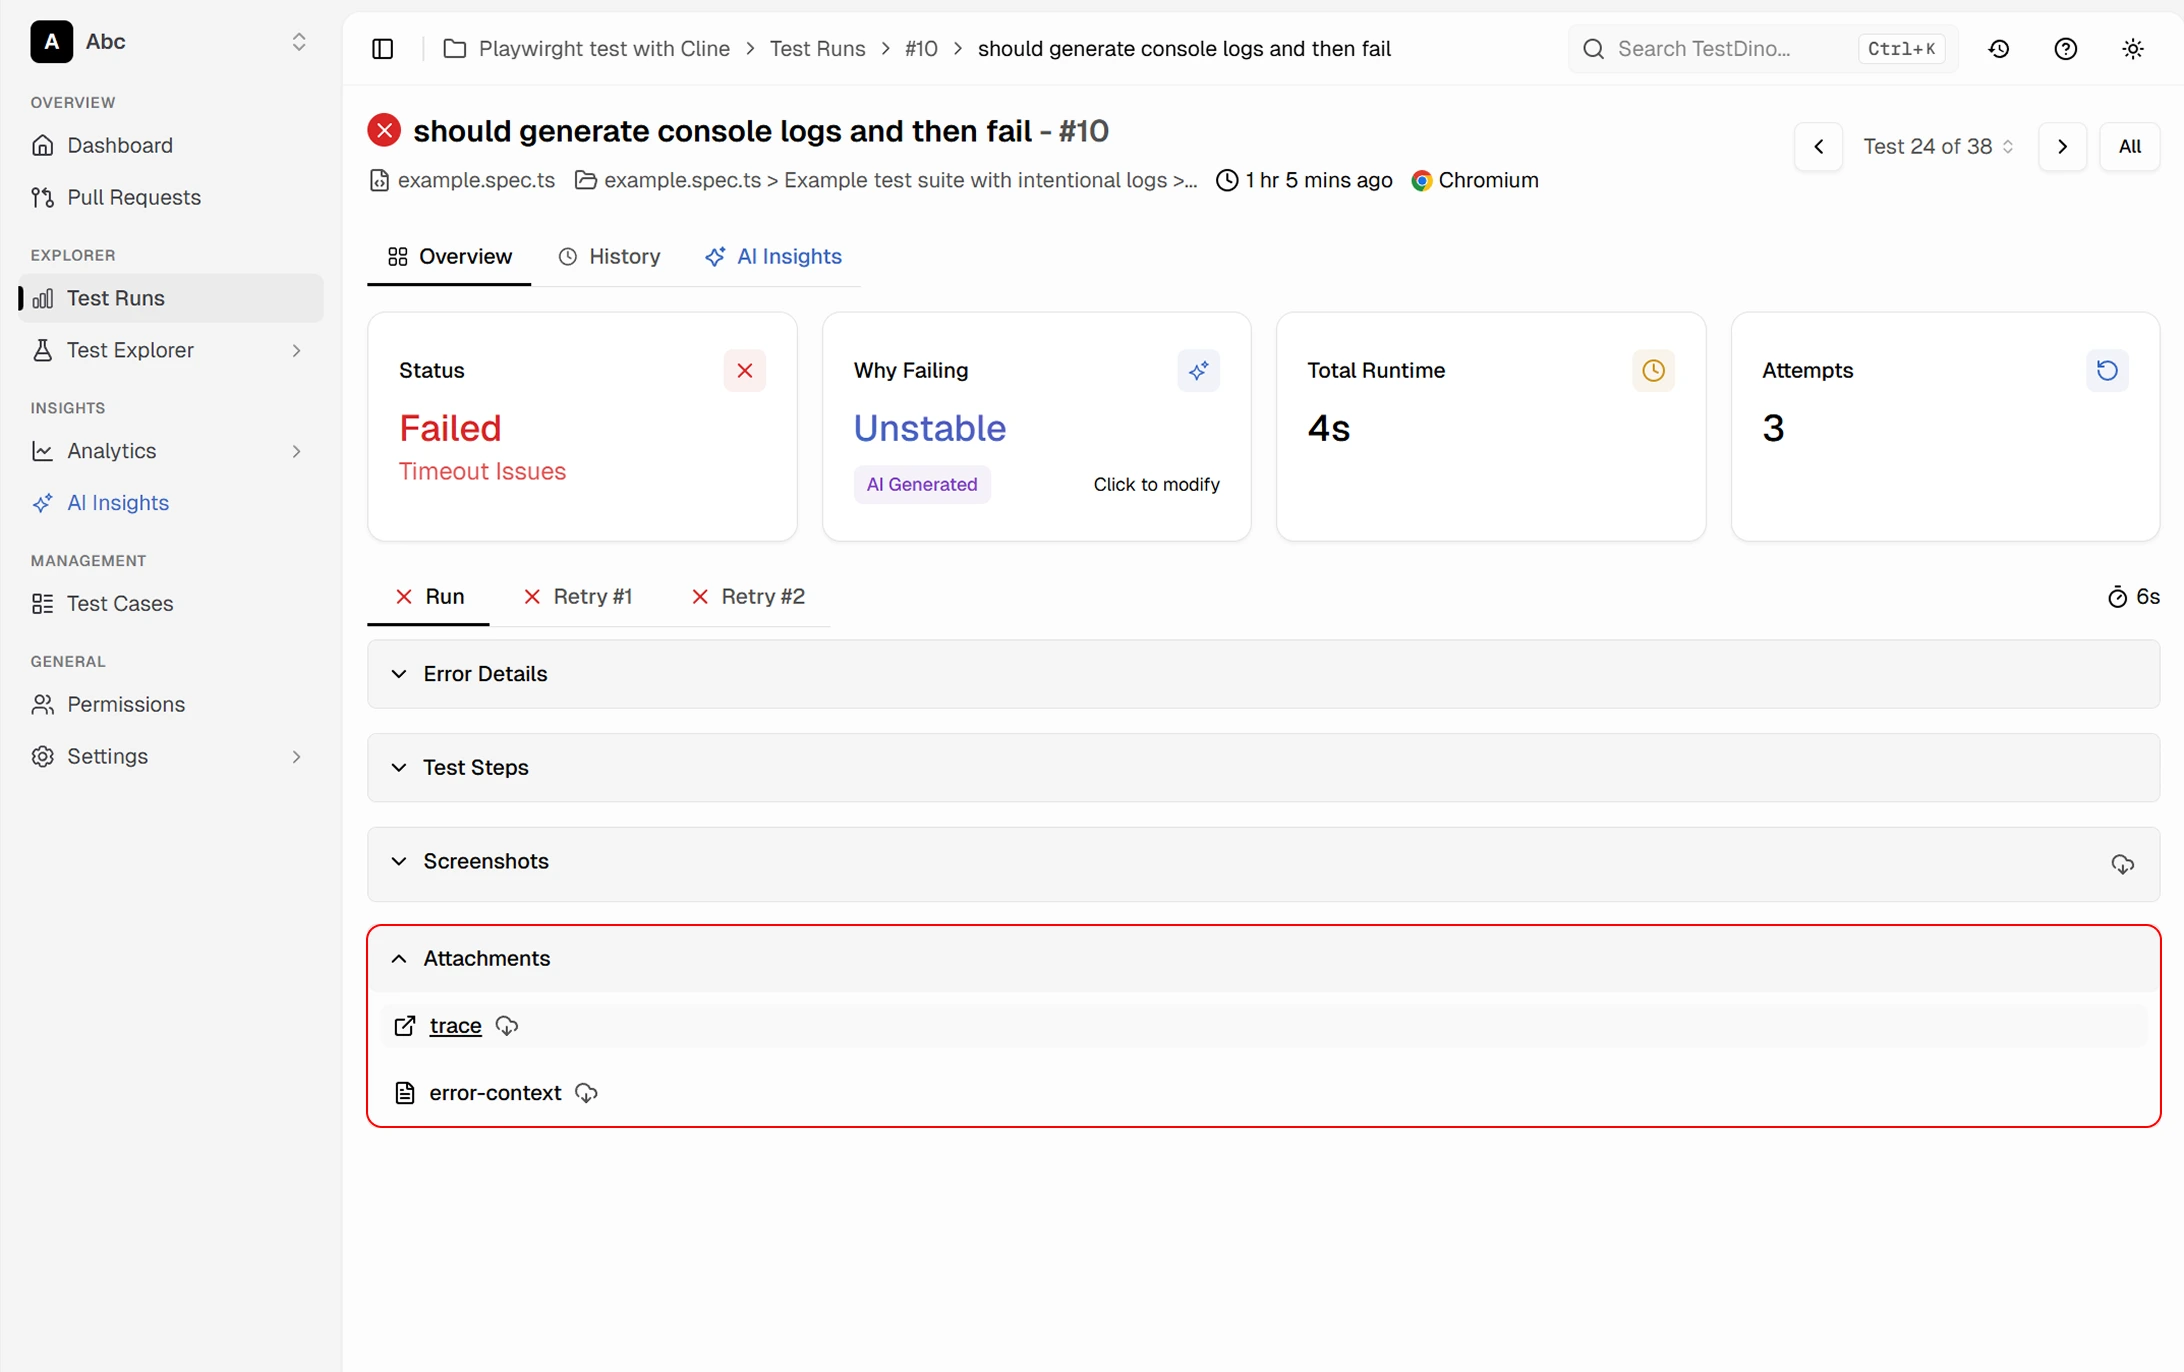
Six collapsible panels for every failure detail
Error Details, Test Steps, Image Mismatch, Screenshots, Video, and Attachments are each in their own collapsible section. Expand only what you need and download traces or error context directly.
Works with your favourite tools
Connect seamlessly with Jira, Slack, GitHub, Linear, Azure DevOps, Asana, and monday to keep your workflow smooth and your team aligned.
FAQs
The Playwright trace viewer lets you step through your test's execution action by action. You see DOM snapshots, network requests, console logs, and source code. TestDino embeds this viewer directly in your browser so you never have to download trace files or run local CLI commands.