Fix one root cause, resolve 20 failures.
TestDino automatically groups Playwright test failures by error pattern, so you triage once instead of reading the same stack trace 20 times.

Your team deserves better than reading
the same stack trace 20 times
Every red CI run starts the same painful cycle. Here's why standard Playwright reports make it worse.

Same error across multiple tests
One timeout causes 20 Playwright test failures. Each gets triaged separately. Nobody realizes it's the same root cause until hours later.
Playwright test reports are flat lists
Allure, HTML reporter, and native Playwright reports show every failure individually. No grouping by root cause, no pattern recognition, no priority signal.
Flaky tests hide real bugs
When 30% of your CI failures are flaky, your team starts ignoring all test results. Real regressions slip through undetected.
Test failure evidence is scattered
Traces buried in CI artifacts. Screenshots in a zip file. Console logs in a different tab. Debugging Playwright CI failures means stitching evidence from 4 different places.
Every failure looks urgent.
Only one is the real bug.
Manual Error Triage
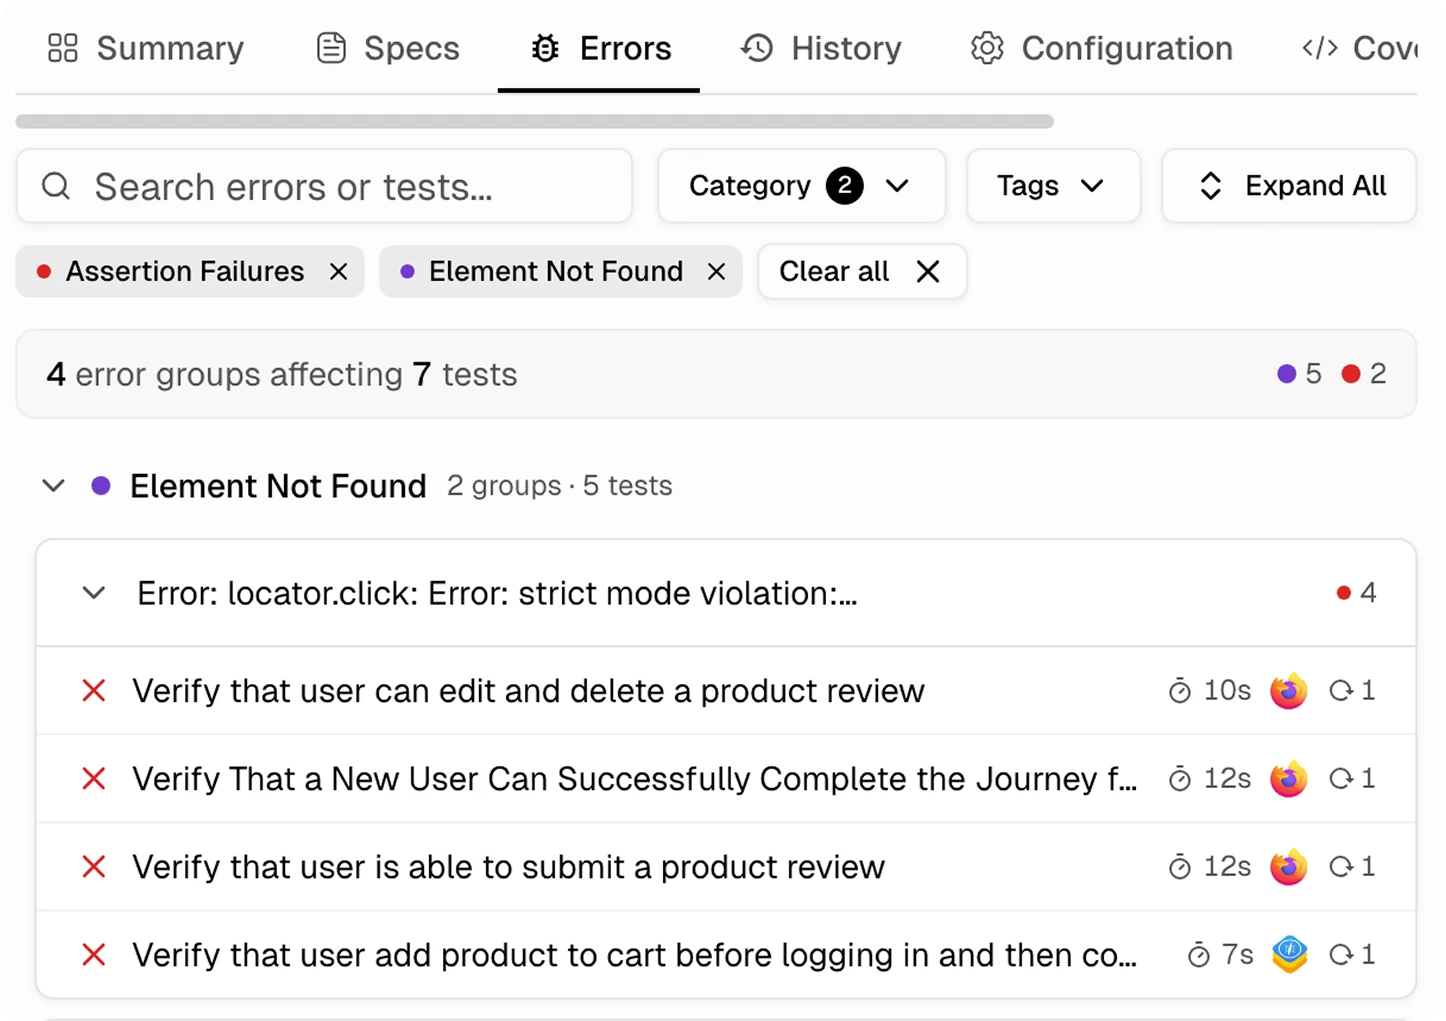
Smart Error Grouping
How error grouping works
Activates automatically on your first CI run. No config, no threshold tuning, no manual tagging.
Add the TestDino reporter
One line in your Playwright config. No wrappers, no new dependencies. Push to CI as usual and TestDino captures every result automatically.

reporter: [
  ['@testdino/playwright', {
    token: process.env.TESTDINO_TOKEN
  }],
]
npx playwright testFailures are grouped by pattern
TestDino compares error messages and stack traces across all failing tests. Failures with matching signatures get grouped together automatically.

Fix what matters
Your dashboard shows grouped failures by pattern. Click any group to drill into affected tests, stack traces, and screenshots. Clear groups based on what the error actually says.
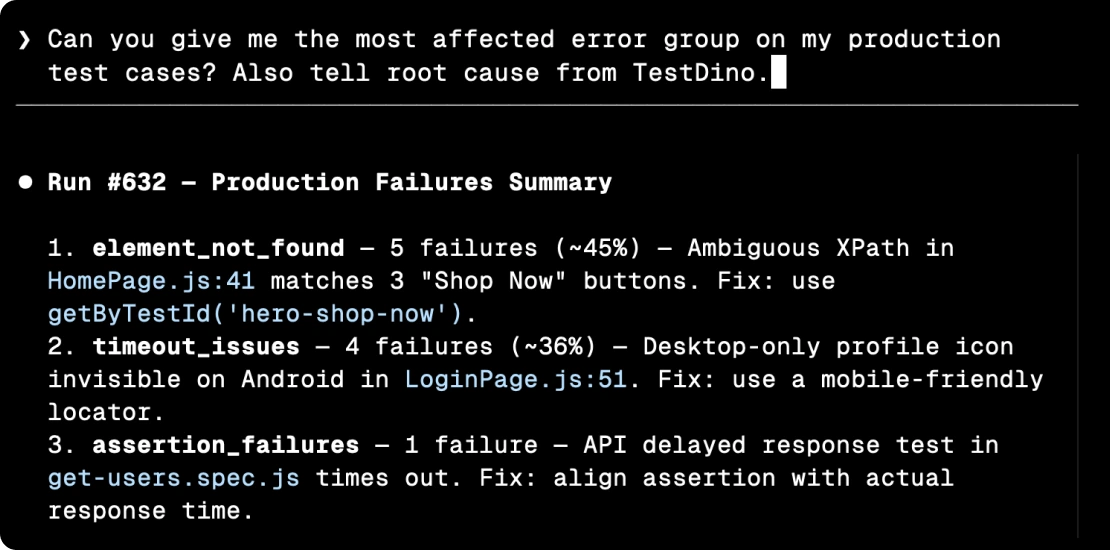
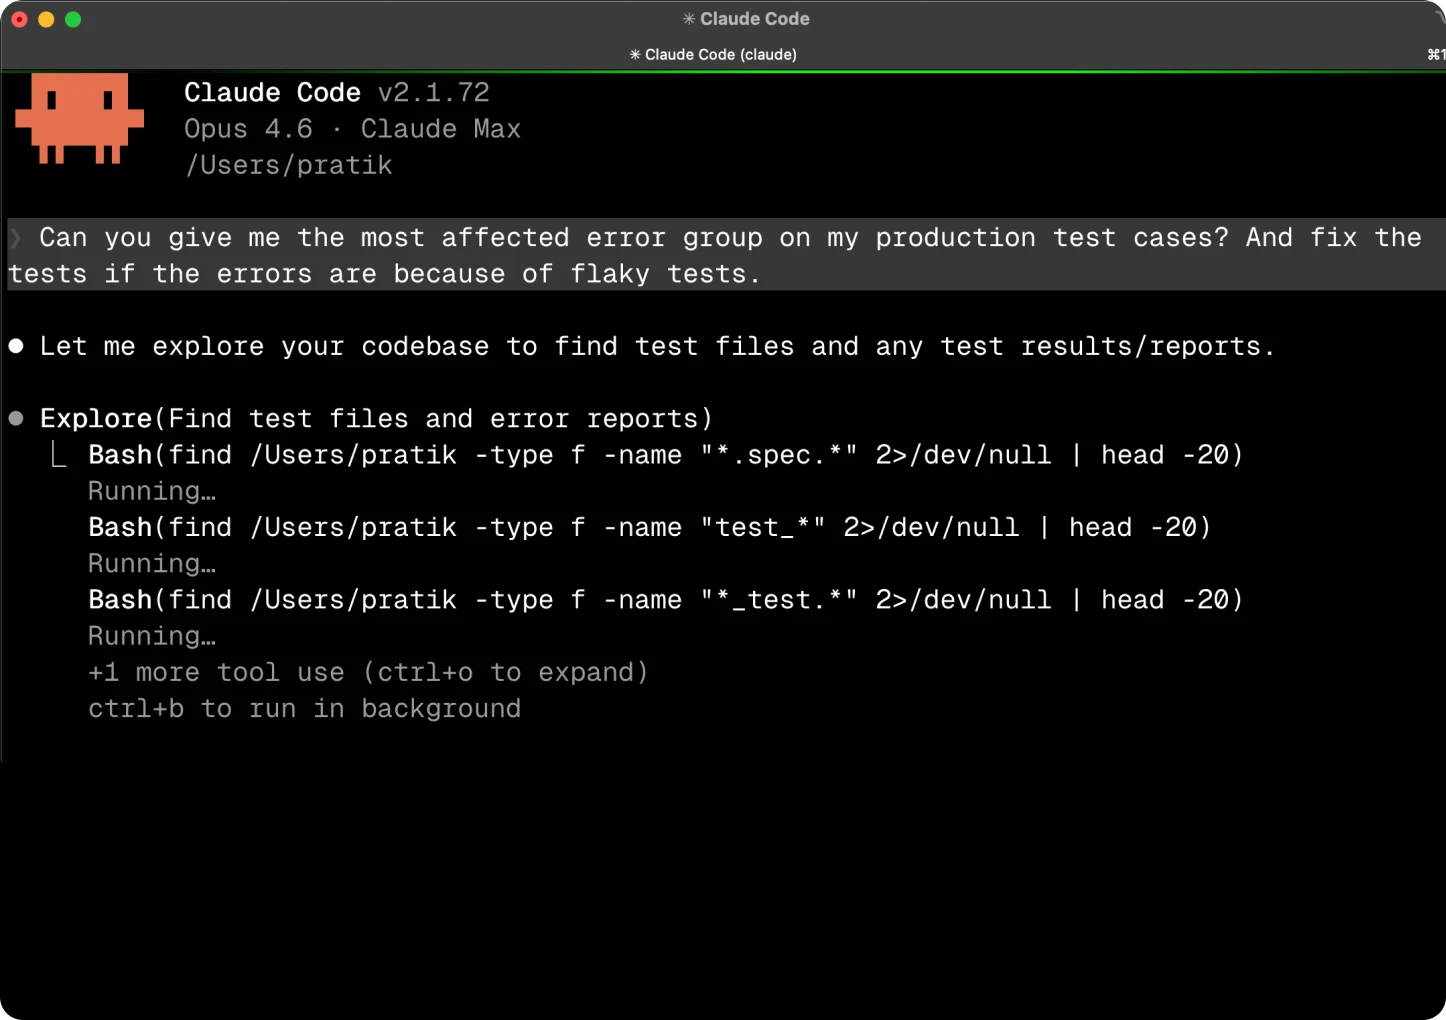
Let your AI agent fix error patterns
Connect TestDino's MCP server to Cursor, Claude Code, or Copilot. Your AI agent queries error groups by branch or environment, spots repeated failure patterns, and suggests targeted fixes without you opening the dashboard.
Teams love what we built
See why developers choose TestDino to ship faster and debug smarter
We were on the default Playwright reporter, and it was tedious to dig through; half a day gone just triaging failures. The TestDino MCP changed that for us. I now run through the failures in minutes instead of devoting half a day to it, and pulling the latest runs straight through the MCP sped up bug triage drastically. AI failure classification and Slack reports do the rest. It's saved us weeks.
To triage failures, down from half a day
Saved across the team

Migrating to TestDino from Currents was an easy decision. The features are stronger, the cost is lower, and the interface makes debugging far less painful. Flaky test detection and AI failure classification have simplified debugging and reduced our CI costs by cutting down reruns and noisy failures.
Reduction in CI costs
Less time triaging failures

Over 30 flaky tests and no structured way to track them, just CI artifacts and morning guesswork. TestDino's "Most Flaky Tests" feature broke this pattern. We can see failure trends now and pull up video recordings of exactly what went wrong. The TestDino MCP server is the magic piece on top, I ask my Claude agent about a failure and it pulls full context from TestDino without switching tabs. We went from 30-something flaky tests down to 3 or 4.
Fewer flaky test reruns
Faster failure triage

Everything you need to debug
Playwright failures - in one place
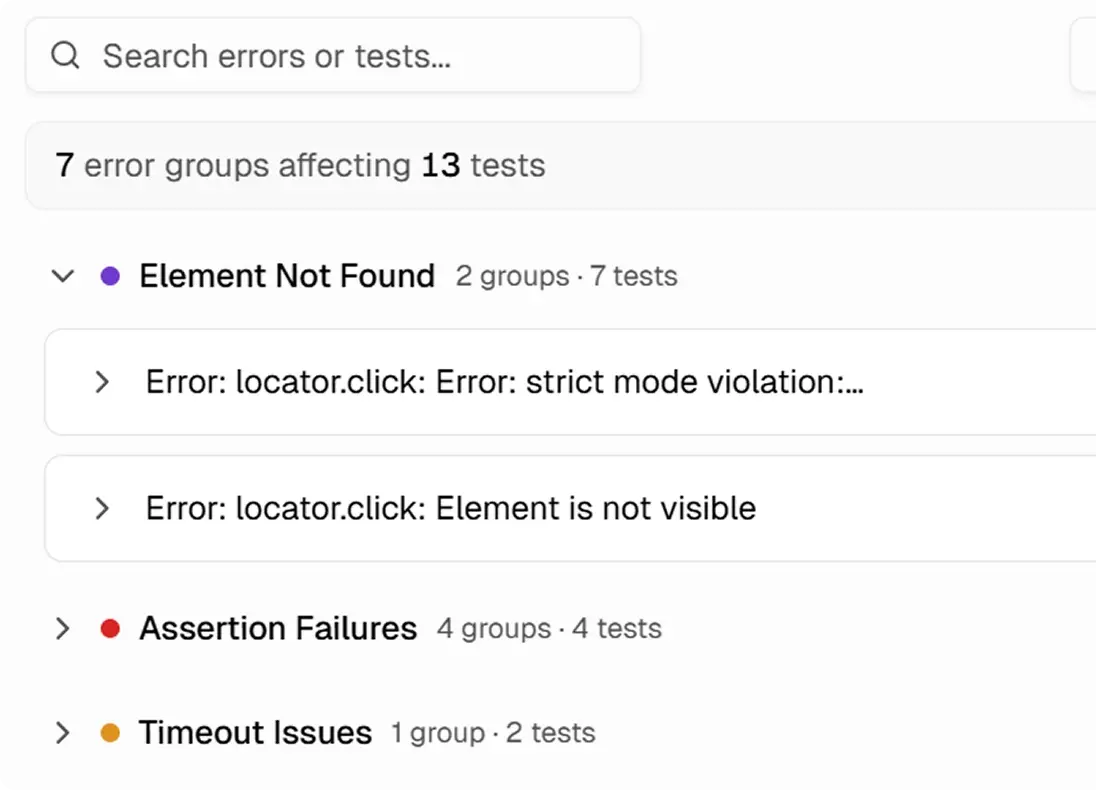
Group failures by root cause
Tests failing with the same error are grouped automatically so you fix the root cause once instead of triaging each failure.
Embedded trace viewer
View traces, screenshots, and videos inline without downloading CI artifacts. Debug failures in your browser alongside grouped error context.
Error analytics by environment
Filter errors by environment, branch, or date range. Total error counts, unique error types, and affected tests for each pattern.
Error frequency trends over time
Track how often each error pattern appears across runs. Spot regressions early and confirm your fixes reduced failure frequency.
One-click drill-down
Click any error group to drill into affected tests, traces, failure history, and environment context in a single view.
Categorized error breakdown
Errors are categorized by type with occurrence counts, affected test lists, and first/last detection dates for each pattern.
What you get with error grouping
See how TestDino surfaces failure patterns and helps you fix them faster.
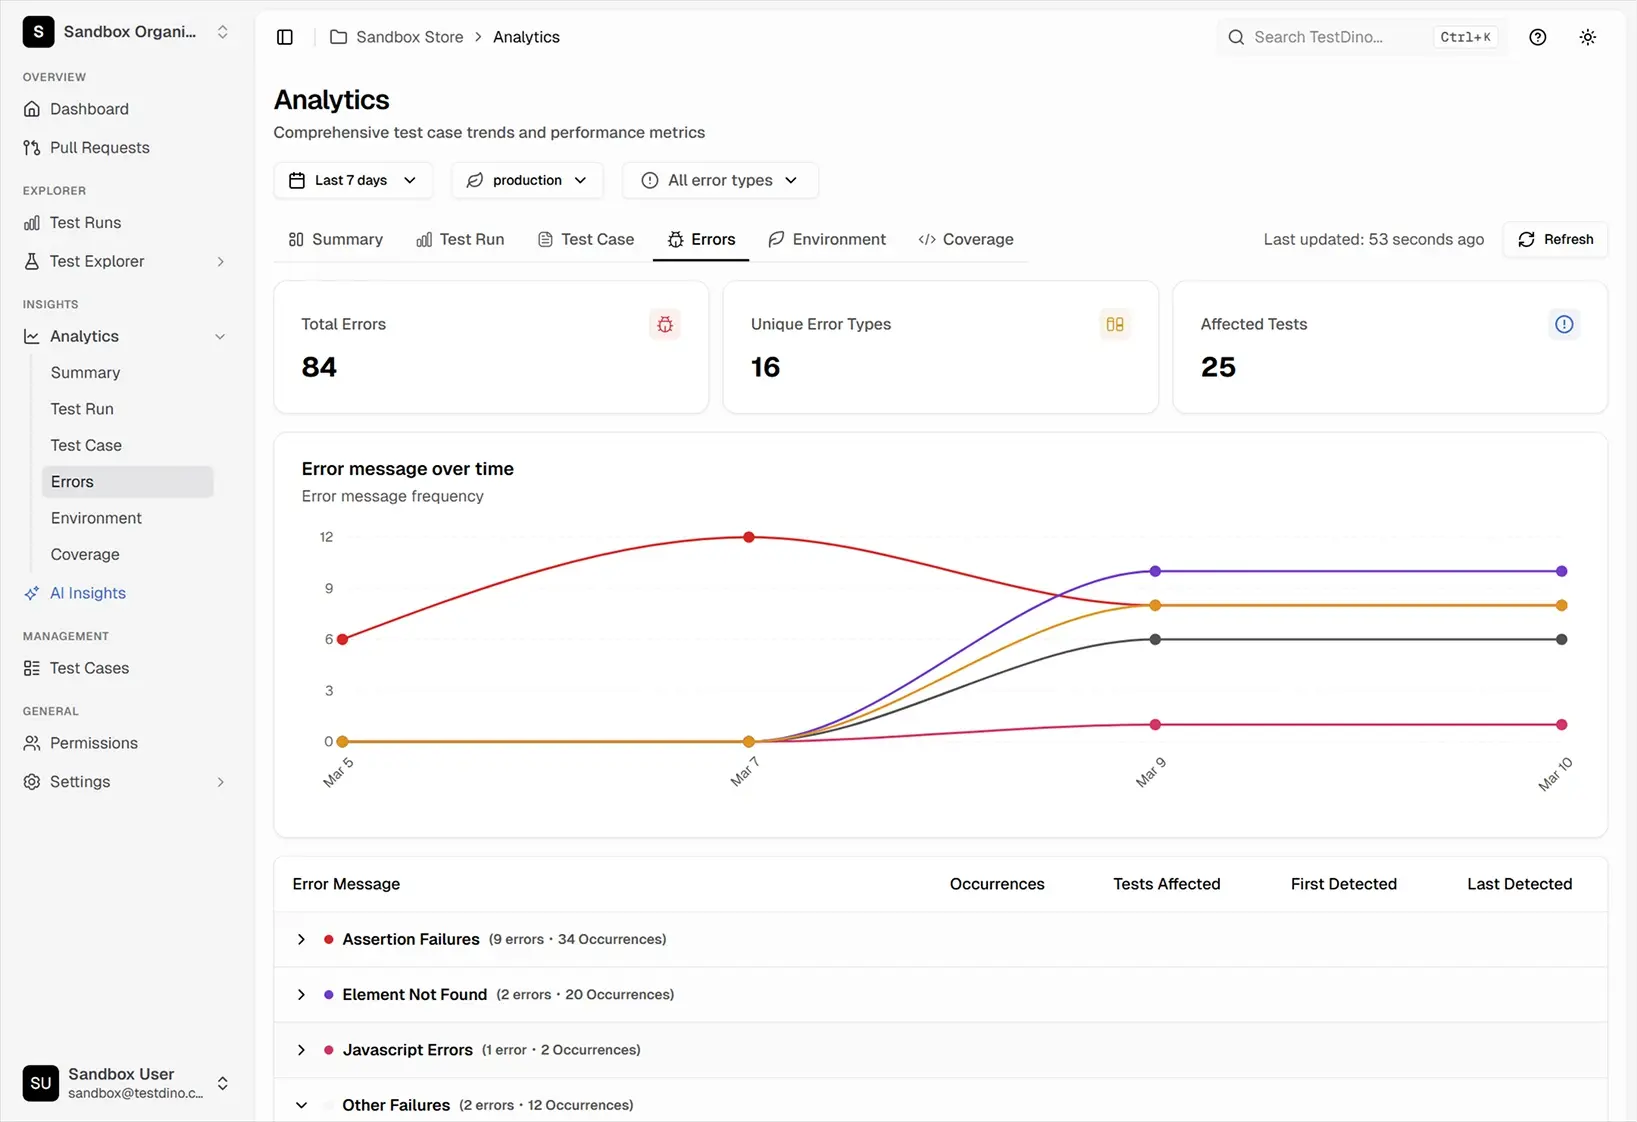
Error analytics dashboard
Filter grouped failures by environment, branch, and time range so you can see which error patterns are growing, where they appear, and what to fix first.
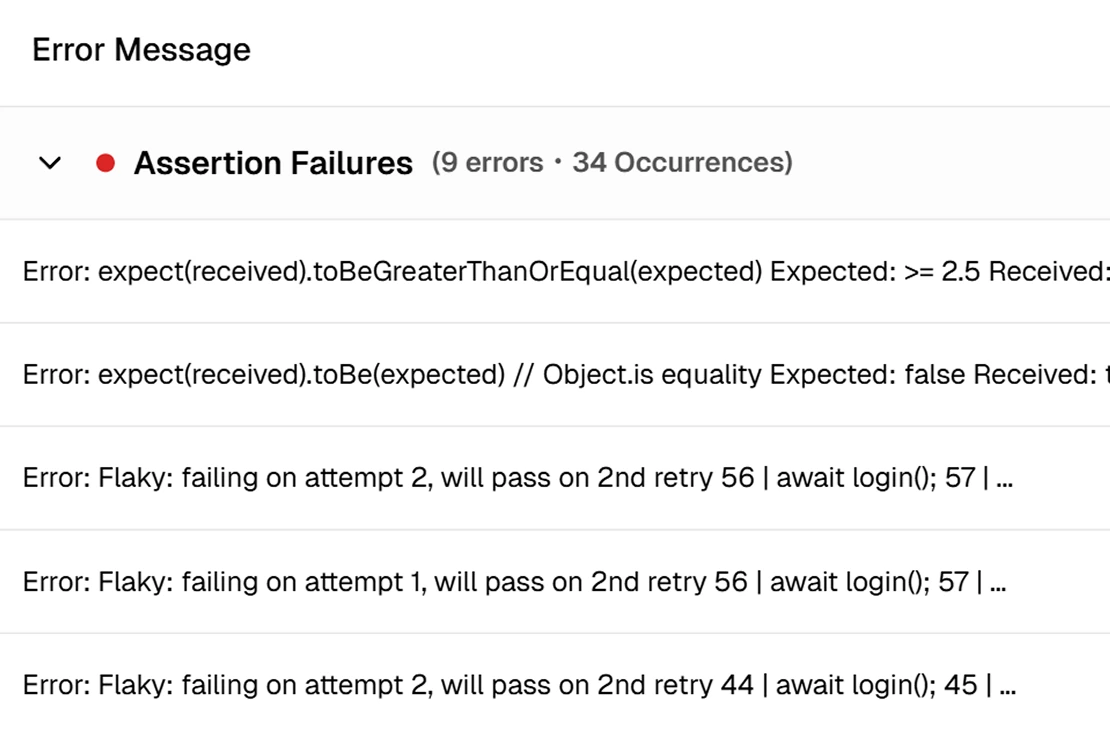
Full test failure analysis in one click
Click an error category to view unique messages, occurrences, affected tests, and detection dates. Explore traces, screenshots, and network timelines.
Error trends that show you what to fix first
Each error group shows occurrence count, affected tests, first and last detected dates, and a frequency trend. The groups growing fastest are the ones to fix first.
Works with your favourite tools
Connect seamlessly with Jira, Slack, GitHub, Linear, Azure DevOps, Asana, and monday to keep your workflow smooth and your team aligned.
FAQs
Error grouping automatically clusters Playwright test failures that share the same root cause. Instead of triaging 50 individual failures, you see 4-5 distinct error patterns and fix each one once.