Data-Driven QA: From Playwright Outputs to Team Decisions
Data-driven QA turns raw test insights into smarter decisions by revealing real failure patterns, risks, and priorities. It helps teams focus on what matters, cut flakiness, and ship more confidently.

Every QA engineer knows the sinking feeling when a critical build breaks and no one can tell if it's a genuine regression or just an unstable test.
Without proper data-driven testing, QA data analytics, and reliable test reporting tools, decisions feel like guesswork, and the pressure to ship on time grows with every failed run.
Scrolling through scattered logs, console traces, and screenshots rarely reveals the root cause, and manually piecing together failures wastes hours. Structured data-driven testing and comprehensive qa data analytics make these signals visible, helping teams detect patterns and prioritize fixes with confidence.
In modern agile and CI/CD environments, intuition alone is not enough. Leveraging automated test reporting tools, artifact correlation, and run history insights turns test runs into evidence-based intelligence, enabling faster triage, improved coverage, and more stable releases.
This blog explores the transformation where test data evolves from a byproduct into a powerful engine for quality and informed decision-making.
What is Test Data Analysis in Modern QA?
Test data analysis is the practice of transforming logs, traces, screenshots, timestamps, and test run history into actionable intelligence that developers and QA can use immediately.
Leveraging data-driven testing, qa data analytics, and test reporting tools, teams can turn fragmented information into insights that drive smarter, faster decisions.
Key elements of modern test data analysis include:
-
Log parsing for identifying recurring errors and patterns
-
Trace correlation to connect failures across environments and configurations
-
Screenshot and artifact analysis for visual and contextual evidence
-
Timeline visualization to track execution flows and pinpoint divergences
-
Run history aggregation to highlight flakiness and recurring issues
-
Automated evidence bundling to create comprehensive, actionable reports
-
Ownership mapping and routing to assign failures to the responsible team
Which Artifacts Matter Most for Decisions?
Every test leaves behind a trail of artifacts: logs, screenshots, traces, and videos. But not all artifacts carry equal weight for decision-making in data-driven testing or when leveraging qa data analytics and modern test reporting tools.
When you're building a release narrative, certain artifacts form your decision backbone. These include:
- Console Logs: Offer granular insights into front-end failures, warnings, and runtime issues, enabling actionable qa data analytics.
- Trace Files: Recreate the full execution timeline, every click, API call, and assertion, critical for data-driven testing analysis.
- Network Logs: Reveal bottlenecks, timeout patterns, or misconfigured endpoints that test reporting tools can highlight automatically.
- Screenshots & Videos: Provide visual evidence for stakeholders and accelerate triage decisions.
- Run History & Spec Analysis: Track long-term performance trends, detect flaky tests, and improve decision-making based on historical qa data analytics.
When QA references these artifacts during release discussions, the conversation shifts from "I think this is fine" to "Here's the data, generated through data-driven testing, that proves it." This is the power of structured qa data analytics: clarity, confidence, and control.
Building a Data-Driven Testing Framework
To unlock real value from your tests, structure is essential. A modern data-driven testing framework ensures that qa data analytics flows seamlessly from test execution to actionable decision-making.
Key steps for designing a framework:
- Collect: Gather all artifacts from test runs, including logs, screenshots, traces, and network captures.
- Normalize: Organize this data into structured formats for analysis and trend detection.
- Query: Apply filtering, grouping, and aggregation to detect patterns across test runs.
- Visualize: Turn structured data into intuitive dashboards that highlight failures, flaky tests, and performance trends.
- Act: Use insights to guide triage, prioritize fixes, and make confident release decisions.
TestDino enhances this process by serving as a Playwright-native test reporting tool that centralizes all runs, artifacts, and debugging data.
Watch this quick demo to see how TestDino transforms raw Playwright outputs into a single source of truth for quality:
Its core capabilities include:
- Test Runs View: A single, filterable list of all Playwright executions from CI or local machines.
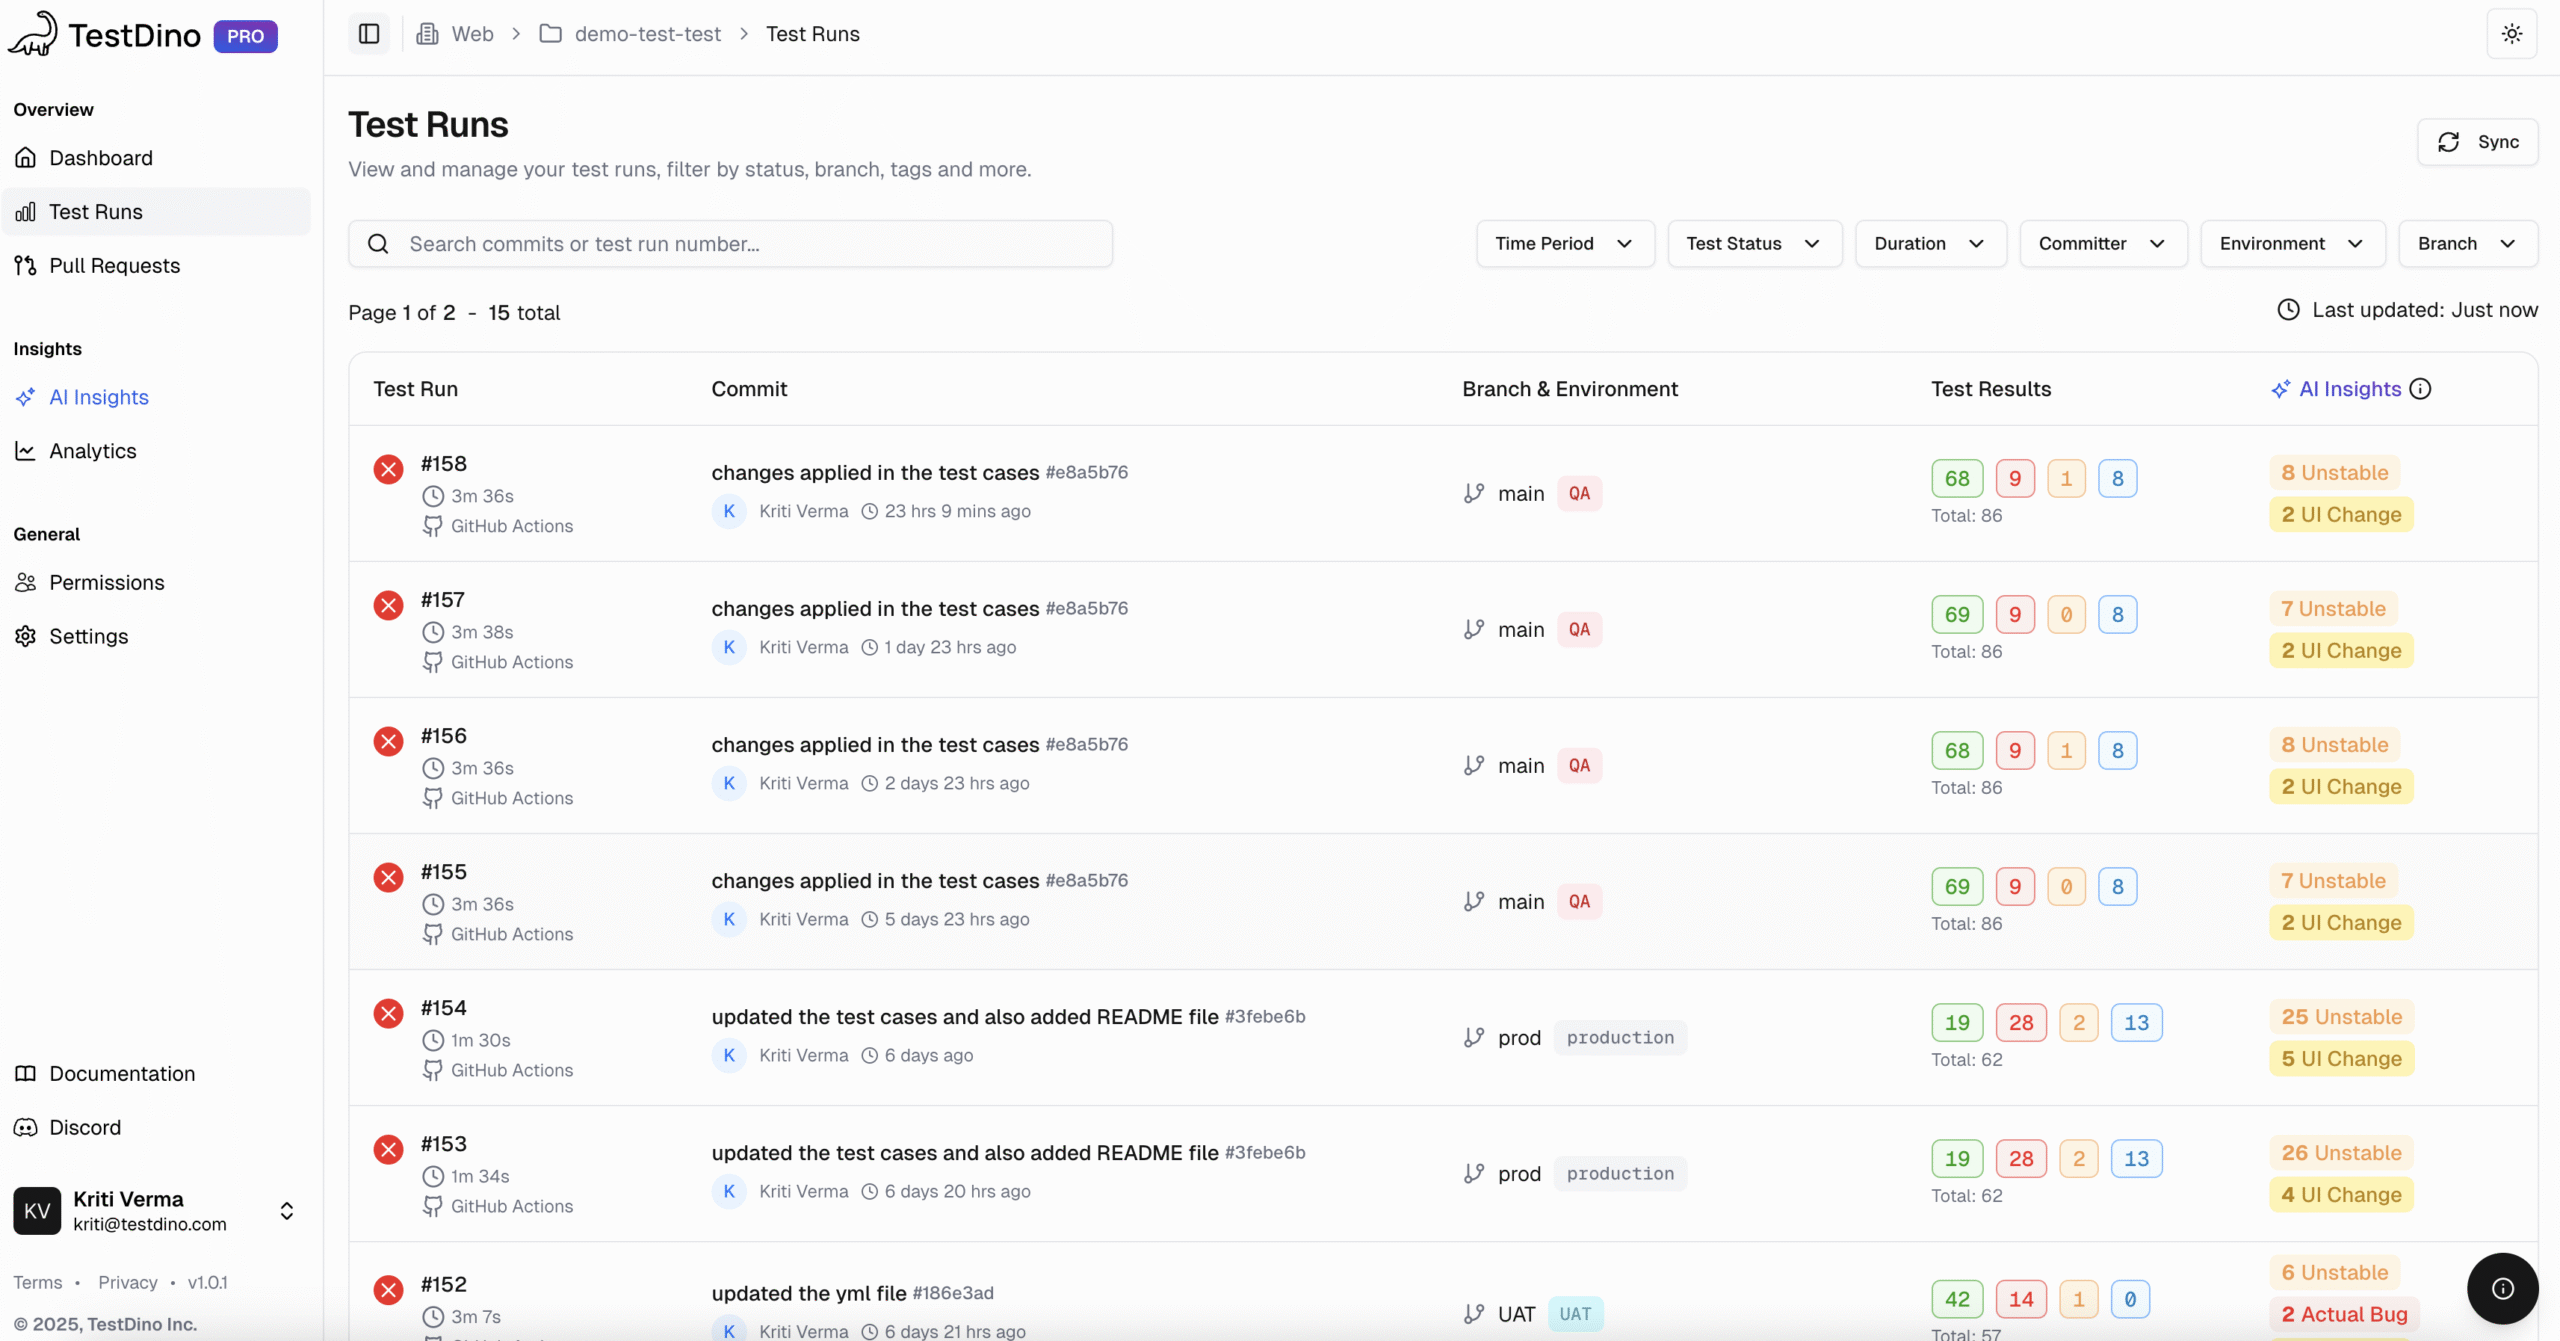
- Detailed Analysis: Fast triage with status, duration, retries, AI-driven failure categorization, and last 10 run histories.
- Evidence Panel: Consolidates logs, screenshots, videos, traces, and artifacts for each test run.
- Trace Viewer: Access Playwright’s time-travel debugger directly, making root cause analysis faster.
- AI Insights: Automatically categorize failures into Actual Bugs, UI Changes, or Unstable Tests and highlight patterns across multiple runs.
- Role-Based Dashboards: QA, Developer, and Manager views tailored to highlight the most relevant insights for each role.
- Integrations: Connects with Jira, Linear, Asana, Slack, GitHub, and CI/CD platforms like GitLab, CircleCI, Azure DevOps, and Jenkins for streamlined workflows.
- Pull Request: Annotates PRs with test results, pass/fail counts, and flakiness, providing full context during code reviews.
- Analytics & KPI Tracking: Visualizes test run volume, pass/fail trends, retry patterns, environment stability, and performance metrics to guide decision-making.
- CI/CD Integrations: Works with GitHub, GitLab, CircleCI, Azure DevOps, Jenkins, Slack, Jira, Linear, and Asana for smooth workflows.
- Fast Setup: Fully compatible with Playwright’s built-in reporter, allowing teams to start collecting structured test data within minutes without custom configuration.
By combining structured qa data analytics, comprehensive test reporting tools, and TestDino's features, teams can transform scattered Playwright outputs into actionable intelligence.
The Evidence Bundle Checklist
When it's time to approve a release, your QA lead needs more than just green test results. They need an evidence bundle, a curated package of data that explains exactly what happened and why.
Here’s your go-to checklist:
✅ Test Summary: Include run stats, pass/fail ratios, retries, and flaky indicators.
✅ Failure Taxonomy: Classify issues as UI, backend, data mismatch, or timeout.
✅ Trace Correlation: Link test results to trace timelines and console logs.
✅ Screenshot & Video Evidence: Visualize actual steps and user flows.
✅ Error Patterns: Show recurring trends or persistent issues across versions.
✅ Ownership & Escalation Paths: Document who's responsible for resolving each failure.
This bundle is your defense and your proof. In reviews or audits, it helps teams justify their calls confidently, turning QA into a data-backed authority, not an opinion-based gatekeeper.
How to Choose QA KPIs That Matter
Metrics can either guide engineering teams toward clarity or send them chasing the wrong problems. Many organizations still rely on superficial stats like “number of tests executed” or “automation coverage,” but true data-driven testing depends on KPIs that influence triage, prioritization, and developer-QA decision-making through reliable qa data analytics.
If a metric doesn't change how your team handles failures, escalations, or release readiness, it's a vanity metric. The KPIs that matter are the ones that reduce noise, expose risk patterns, and provide developers with actionable insights during debugging and code reviews.
KPIs that actually support smarter decisions include:
- Failure Rate per Component: Shows where regressions repeatedly occur so developers can target weak areas.
- Flakiness Ratio: Separates unstable tests from real failures, reducing wasted triage cycles.
- Test Duration Trends: Highlights slow builds or environment-level degradation across test runs.
- Defect Escape Rate: Reveals how many issues slip past testing into production.
- Error Taxonomy Distribution: Groups failures by cause (UI, network, environment, logic) for faster prioritization.
Modern test reporting tools like TestDino make these KPIs immediately useful by correlating them with real test artifacts, run history, failure patterns, and developer-friendly evidence. With TestDino’s centralized test runs, AI-driven failure categorization, flaky test identification, and detailed artifact panels, QA and developers get direct insights that streamline triage, improve ownership routing, and accelerate release decisions.
This is how data-driven testing evolves from a reporting habit into a strategic engine powering better engineering choices and higher product quality.
Triage Decision Tree: From Signal to Action
A failed test doesn't always mean a real issue. A flunking test isn't necessarily a legitimate problem. It may be a flaky dependency, a timing error, or an environmental bug. Without a process-based triage mechanism, QA teams burn hours pursuing specters.
With data-driven triage, you categorize issues based on error taxonomy and pattern grouping. If you detect multiple timeout errors from the same test spec, that’s not a coincidence; it’s a signal.
QA teams using this model report shorter triage cycles and more accurate ownership routing. Instead of reacting to every failure, they analyze, correlate, and decide based on data.
Ownership, Routing, and Accountability
As QA scales, one question becomes harder to answer: Who owns this failure?
Ownership routing solves that. By tagging each test or suite with metadata such as component name, repository path, or commit author, you can automatically assign responsibility.
A few strategies that work:
-
Tag tests using naming conventions linked to teams.
-
Store ownership metadata in your CI config or BI tables.
-
Auto-route failures using scripts or integrated analytics tools.
When combined with pattern grouping and error taxonomy, you get a self-learning feedback loop.
Platforms like TestDino already use this concept to detect recurring failures, map them to their respective owners, and trigger real-time alerts. QA leads no longer have to chase people for answers; the data routes accountability automatically.
That’s what data-driven testing truly means: transparency, traceability, and trust.
That’s what data-driven testing truly means: transparency, traceability, and trust.
Let's put all of this together using a real-world example.
A fintech QA team observed repeated failures in their authentication tests. Their instinct was to rerun them, but instead, they used data-driven analysis. By querying their run history, they spotted a familiar pattern: most failures occurred during peak load hours.
SELECT test_name, COUNT(*) AS failures, AVG(duration)
FROM run_results
WHERE failure_message LIKE '%auth%'
GROUP BY test_name
ORDER BY failures DESC;
Further trace correlation showed API timeouts, while network logs confirmed backend congestion. Instead of ramping up too fast, the QA team assembled an evidence package of logs, screenshots, and traces to prove that the issue was infrastructure, not code.
That single data-driven decision prevented a full sprint's worth of rework.
This is the essence of data-driven testing: using QA data analytics, test reporting tools, and evidence bundles to make calls that improve quality without guesswork.
Conclusion
Data-driven QA has become essential for engineering teams aiming to ship confidently, reduce triage loops, and eliminate uncertainty from release decisions.
When organizations embrace data-driven testing, structured artifacts, error taxonomy, and practical qa data analytics, they transform scattered test data into reliable, decision-ready insights.
With centralized test runs, automated evidence collection, flakiness detection, and rich artifact analysis, TestDino helps QA and developers work from the same factual foundation, strengthening ownership, accelerating debugging, and improving overall release quality.
Ready to elevate your QA process? Start using TestDino and turn your test data into your strongest decision-making engine.
FAQs

Pratik Patel
Co-founder