Playwright reporting metrics every team should track
Most teams waste hours debugging Playwright test failures without realizing their reports lack real insight. This guide shows the key Playwright reporting metrics every team should track and how tools like TestDino turn raw test data into clear, actionable insights.

Your CI/CD pipeline is dragging. I see this all the time, developers sitting around waiting for feedback, and when something breaks, you're looking at hours of debugging. The real kicker? Most of the time, it's not even the tests that are the problem.
Here's what I've learned: without a solid Playwright reporting strategy, you're basically flying blind. You end up burning through valuable engineering time trying to figure out if you've got a real bug on your hands, a flaky test, or just some environmental issues.
This guide covers the essential metrics you need to track if you want to turn your test automation from a major bottleneck into something that actually gives you a competitive edge.
I'm going to walk you through foundational metrics from Playwright's built-in tools and some advanced analytics that'll give you the complete picture of how your test suite is performing and impacting your delivery speed. 👀
Foundational Playwright Reporting Metrics
Test execution produces valuable test result data that can be analyzed to improve testing processes and outcomes. The key is knowing which metrics to focus on first. These foundational metrics provide the core evidence needed to understand any test outcome.
1. The Test Run: Your Single Source of Truth
Every test run generates a wealth of data. The key is knowing which metrics to focus on first. These foundational metrics provide the core evidence needed to understand any test outcome.
The most basic metric is the test status:
- Passed: The test was completed successfully.
- Failed: The test encountered an error or an assertion failed.
- Skipped: Tests you told the framework not to run this time.
Playwright counts how many tests actually run and pass. Simple as that.
Every test run creates a paper trail of logs and errors. You’ll need this later when you're tracking down why something broke last Tuesday at 4 PM.
2. Diagnostic Artifacts: Logs, Screenshots, and Videos
When a test fails, logs are not always enough. Playwright can automatically capture richer evidence to provide visual context.
- Screenshots: Ever had a test fail and wondered what the page actually looked like? Screenshots solve that problem. Just set up screenshot: 'only-on-failure' and you'll get visual proof of what went wrong.
- Videos: Sometimes you need to see the whole story, not just the ending. Videos show you exactly what happened leading up to a failure. Pro tip: use video: 'retain-on-failure' so you're not storing gigabytes of videos from passing tests.
Think of these as your insurance policy. When something breaks at 2 AM and the on-call engineer needs answers, these files tell the whole story without anyone having to recreate the problem.
3. Visual Comparison: Catching UI Regressions
For teams that need to prevent visual bugs, Playwright's snapshot testing is essential. When a test using a visual assertion (e.g., toHaveScreenshot) fails, the HTML report includes an interactive Image Mismatch panel.
This tool allows you to review pixel-level changes without leaving the report. It offers several modes to inspect the differences between the expected (baseline) image and the actual image captured during the run:
| Mode | What it shows | How it helps |
|---|---|---|
| Diff | Colored overlays for changed regions | Pinpoints small layout or visual shifts quickly |
| Actual | Runtime screenshot from the failing attempt | Inspects what was rendered during the test |
| Expected | Baseline reference image | Confirms whether the baseline must change |
| Side by Side | Expected and actual in two panes | Compare at a glance, scans across elements |
| Slider | Interactive sweep between images | Examines precise areas for subtle differences |
This feature changes visual regression testing from a manual, tedious task into a fast, data-driven review process directly within your test artifacts.
4. The Trace Viewer: Time-Travel for Debugging
The Playwright Trace Viewer is arguably its most powerful debugging tool. It captures a complete, interactive recording of a test run, allowing you to "time-travel" through the execution.
The Trace Viewer provides a detailed view of test execution results for each test run, making it easier to analyze outcomes and identify issues.
A trace includes:
- A chronological list of every action.
- DOM snapshots before and after each step.
- A full network request waterfall.
- Browser console logs.
For CI failures, this tool completely transforms how you approach debugging. The recommended setting is trace: 'on-first-retry', which captures this rich data precisely when it's needed most: for flaky and failing tests.
5. Retry and Attempt Analysis: Identifying Flaky Tests
A flaky test passes and fails intermittently without any code changes.
They destroy confidence in a test suite. Here's how Playwright deals with them: it automatically runs failed tests again if you tell it to.
When a test bombs the first time but works on the second try, Playwright marks it as "flaky". This is gold for figuring out which tests need fixing. Keep an eye on how many flaky tests you have each week. If the number keeps growing, your test suite needs some attention.
CI/CD Contextual Metrics
Isolated test results are not very useful. To be actionable, software test reporting must connect test outcomes to the development workflow.
An effective reporting process ensures that test results are integrated with code changes and team workflows.
1. Tying Results to Code: Commit, Branch, and PR Context
A test failure is meaningful only when you know what code change caused it. Running tests in your CI pipeline automatically links each test to:
- The Git commit hash.
- The branch name.
- The pull request number.
This connection matters. When a test breaks, you immediately know who changed what. The developer who made the change can jump on it right away instead of playing the blame game later.
2. Capturing Test Environment Metadata
Was it a failure caused by a code change or an environment difference?
To answer this, you must capture configuration metadata with every run, including:
- What version of Playwright and Node.js ran the tests?
- Which OS and browser versions were used?
- How many parallel workers? What timeout settings?
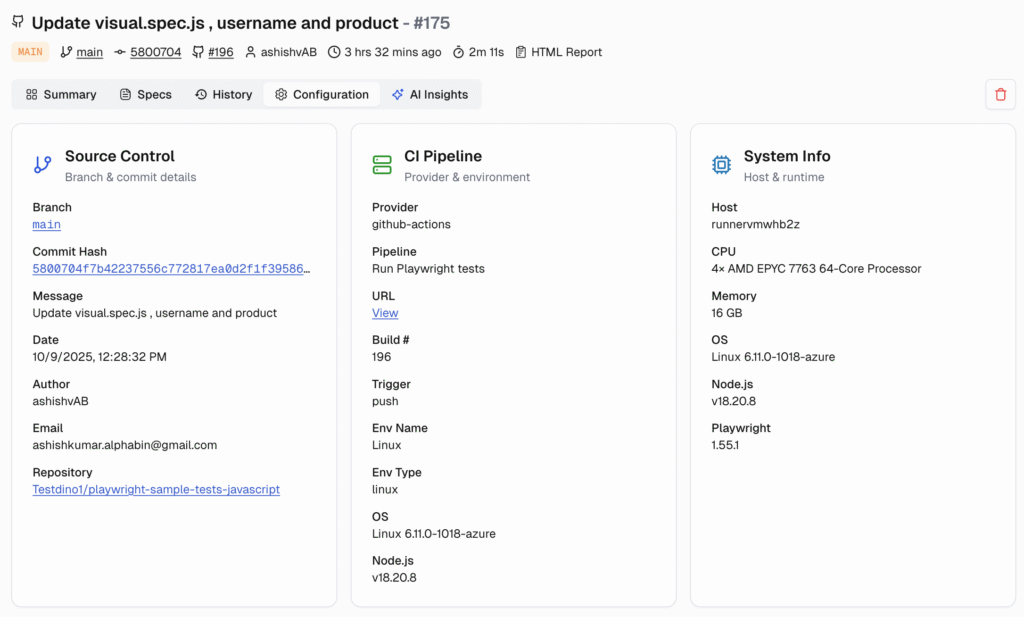
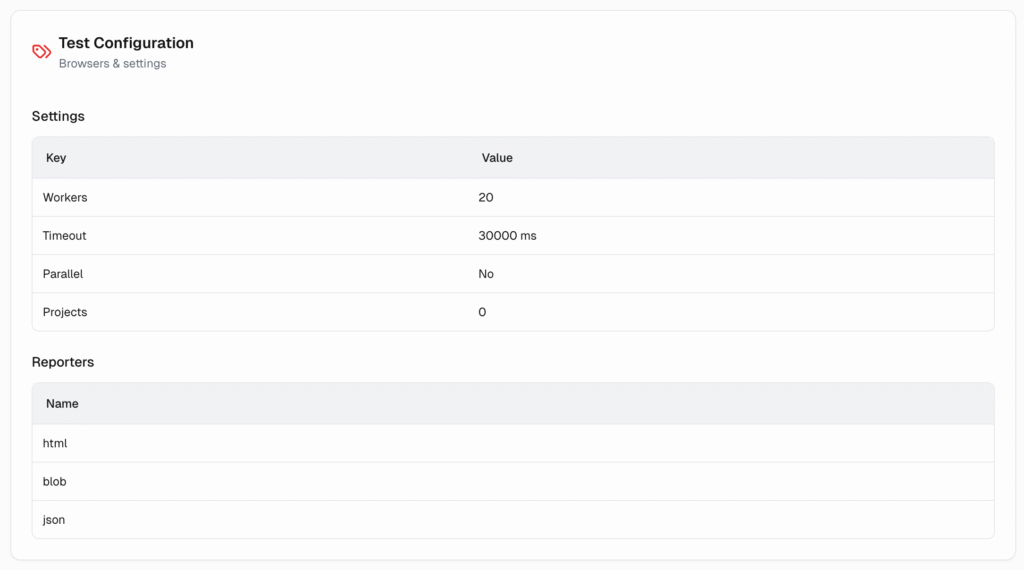
Having this info means you can figure out why tests pass on Mac but fail on Linux. Or why that one test started timing out after you bumped up the parallel workers. It's detective work made easier.
Advanced Performance and Health Metrics
Beyond functional correctness, a great test suite also monitors application performance and its own efficiency.
1. Execution Timing and Duration
Slow tests lead to slow feedback loops. Tracking duration metrics is key to keeping your CI pipeline fast.
- Individual Test Duration: Identify the slowest tests in your suite. These are prime candidates for optimization.
- Overall Suite Duration: Monitor the total run time. A sudden spike can indicate a performance regression in the application itself.
2. Browser-Level Performance: Core Web Vitals
I can't stress this enough: if you want your app to stay lightning fast, you absolutely need to leverage Playwright for browser-level performance monitoring. Setting up checks for these metrics is a must:
- Largest Contentful Paint (LCP): This is all about how quickly your main content actually appears for users. When your LCP is optimized, visitors see your key content almost instantly, which is pretty astounding for user engagement.
- Cumulative Layout Shift (CLS): Nobody likes it when elements jump around during page load. It's frustrating and kills conversions. This metric tells you exactly how stable your layout is while loading.
- Interaction to Next Paint (INP): Here's where the magic happens - this measures how responsive your page feels when users actually interact with it. Fast INP scores create that smooth, professional experience users expect.
You can automatically fail tests when performance drops below your standards!
Just implement something like expect(lcp).toBeLessThan(2500), and you've got yourself a bulletproof system where slow pages never see the light of production.
When you run these performance checks across all your critical user flows, you catch performance issues before they impact a single customer, and that's the proactive approach that separates successful apps from the rest.
Getting Started with Playwright Reporting
To enable Playwright's powerful reporting features, you need to tweak your playwright.config.ts file. You can run tests using Playwright's built-in reporting capabilities to automatically generate reports in formats like HTML, JSON, or JUnit.
Playwright reporters provide multiple options for viewing and analyzing the results of your Playwright tests, making it easier to debug and understand your test outcomes.
Let’s break this down step by step.
1. Define Core Test Settings
Start with the basics. Tell Playwright where your tests live and how to run them. This setup lets you run tests in parallel and prevents anyone from accidentally commiting test.only() to production.
import { defineConfig, devices } from '@playwright/test';
export default defineConfig({
  // Directory where your tests are located.
  testDir: './tests',
  // Run tests in files in parallel.
  fullyParallel: true,
  // Fail the build on CI if you accidentally left test.only in the source code.
  forbidOnly: !!process.env.CI,
});
2. Configure CI-Specific Behavior
It's common to use different settings for local development and your CI pipeline. Here, we configure test retries and the number of parallel workers for use only in a CI environment.
// Add this inside the defineConfig object
  // Retry on CI only.
  retries: process.env.CI ? 1 : 0,
  // Set the number of parallel workers.
  // We use a lower number for CI to manage resources.
  workers: process.env.CI ? 1 : undefined,
3. Enable the HTML Reporter
This step tells Playwright to generate the rich, interactive HTML report after the test run is complete.
// Add this inside the defineConfig object
  // Reporter to use. See https://playwright.dev/docs/test-reporters
  reporter: 'html',
4. Configure Diagnostic Artifacts
The use object is where you configure the automatic creation of diagnostic evidence. These settings are crucial for effective debugging, as they capture traces, screenshots, and videos specifically for failing and flaky tests.
// Add this inside the defineConfig object
  use: {
    // Collect a trace when retrying a failed test.
    trace: 'on-first-retry',
    // Capture a screenshot only when a test fails.
    screenshot: 'only-on-failure',
    // Record a video, but only keep it if the test fails.
    video: 'retain-on-failure',
  },
5. Define Your Test Projects
Finally, the projects array defines which browsers and devices your tests will run against.
// Add this inside the defineConfig object
  projects: [
    {
      name: 'chromium',
      use: { ...devices['Desktop Chrome'] },
    },
    {
      name: 'firefox',
      use: { ...devices['Desktop Firefox'] },
    },
    {
      name: 'webkit',
      use: { ...devices['Desktop Safari'] },
    },
  ],
By combining these steps, you create a strong configuration that generates a detailed, self-contained playwright-report folder. Automated test execution across browsers ensures comprehensive coverage and reliable reporting.
This report includes not just pass/fail status but also embedded videos, screenshots, interactive traces, and a visual comparison viewer for any snapshot test failures.
6. Migrating from Other Frameworks
Switching from Selenium or Cypress? You'll probably notice Playwright's reporting feels more complete right away.
The Trace Viewer alone saves hours of debugging time. And that automatic flaky test detection? That means you don't need extra tools or hacky workarounds to figure out which tests are unreliable.
Teams can also leverage reporter methods or develop a custom reporter to tailor Playwright reporting to their specific needs during migration.
For guidance on a migration strategy, check out our detailed guide.
Beyond Built-in Reports: Using a Test Analytics Platform
Playwright's HTML reports work great for checking what just happened in your last test run. But they hit a wall when you need the bigger picture.
You can't track patterns, spot recurring problems, or give your manager that dashboard they keep asking for. That's when you need something more.
Why Standard Reports Aren't Enough for Teams?
- No Historical Context: Each HTML report shows one moment in time. You get today's results, but can't tell if that failing test has been broken all week. Did test duration creep up slowly? You'll never know.
- Triage is Manual: Every failure means digging through logs by hand. Similar errors aren't automatically grouped.
- Limited Visibility: Try getting a bird's eye view of how all your projects are doing. Spoiler: you can't.
| Metric / Need | Basic Approach (HTML Report) | Advanced Approach (TestDino) | Business Impact |
|---|---|---|---|
| Failure Analysis | Manually read logs and traces for each failure. | AI categorizes failures (bug, UI change, unstable) and groups similar errors. | Reduces triage time from hours to minutes. |
| Flakiness Tracking | See if a test was “flaky” in a single run. | Track flakiness rate over time for specific tests, files, and branches. | Proactively identifies and fixes unstable tests, increasing trust in CI. |
| Performance Trends | See the duration of a single test run. | Visualize test and suite duration trends to catch performance regressions. | Keeps the CI/CD feedback loop fast. |
| Team Visibility | Share a zip file or a link to a CI artifact. | Centralized dashboards show test health, failure rates, and PR status. | Aligns developers, QA, and managers with a single source of truth. |
How does TestDino enhance Playwright Reporting?
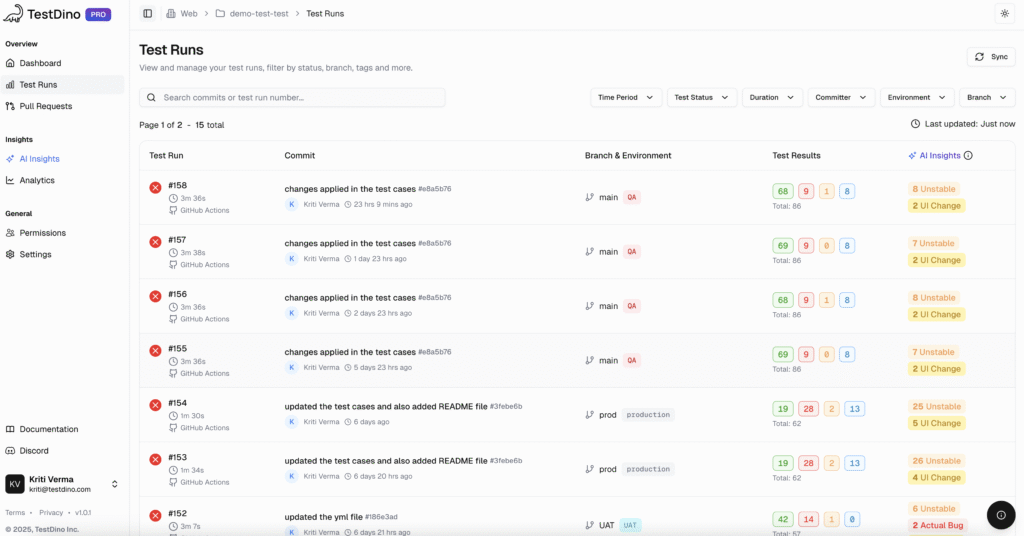
TestDino takes your existing Playwright reports and makes them actually useful for the whole team.
It's like having a smart assistant that watches all your test runs and spots patterns you'd miss. Your tests already generate reports. TestDino just reads them and tells you what's really going on.
With TestDino, you can:
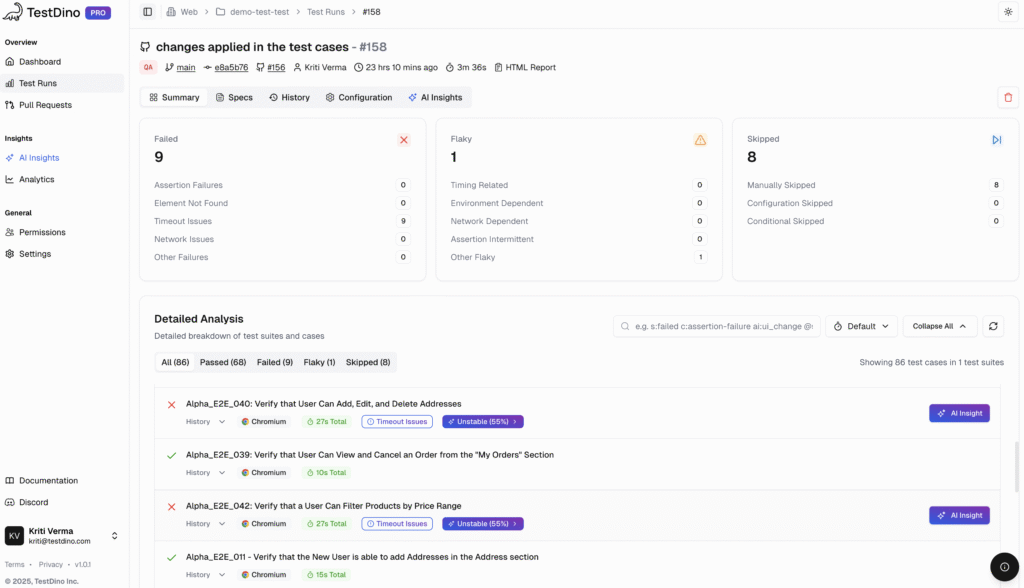
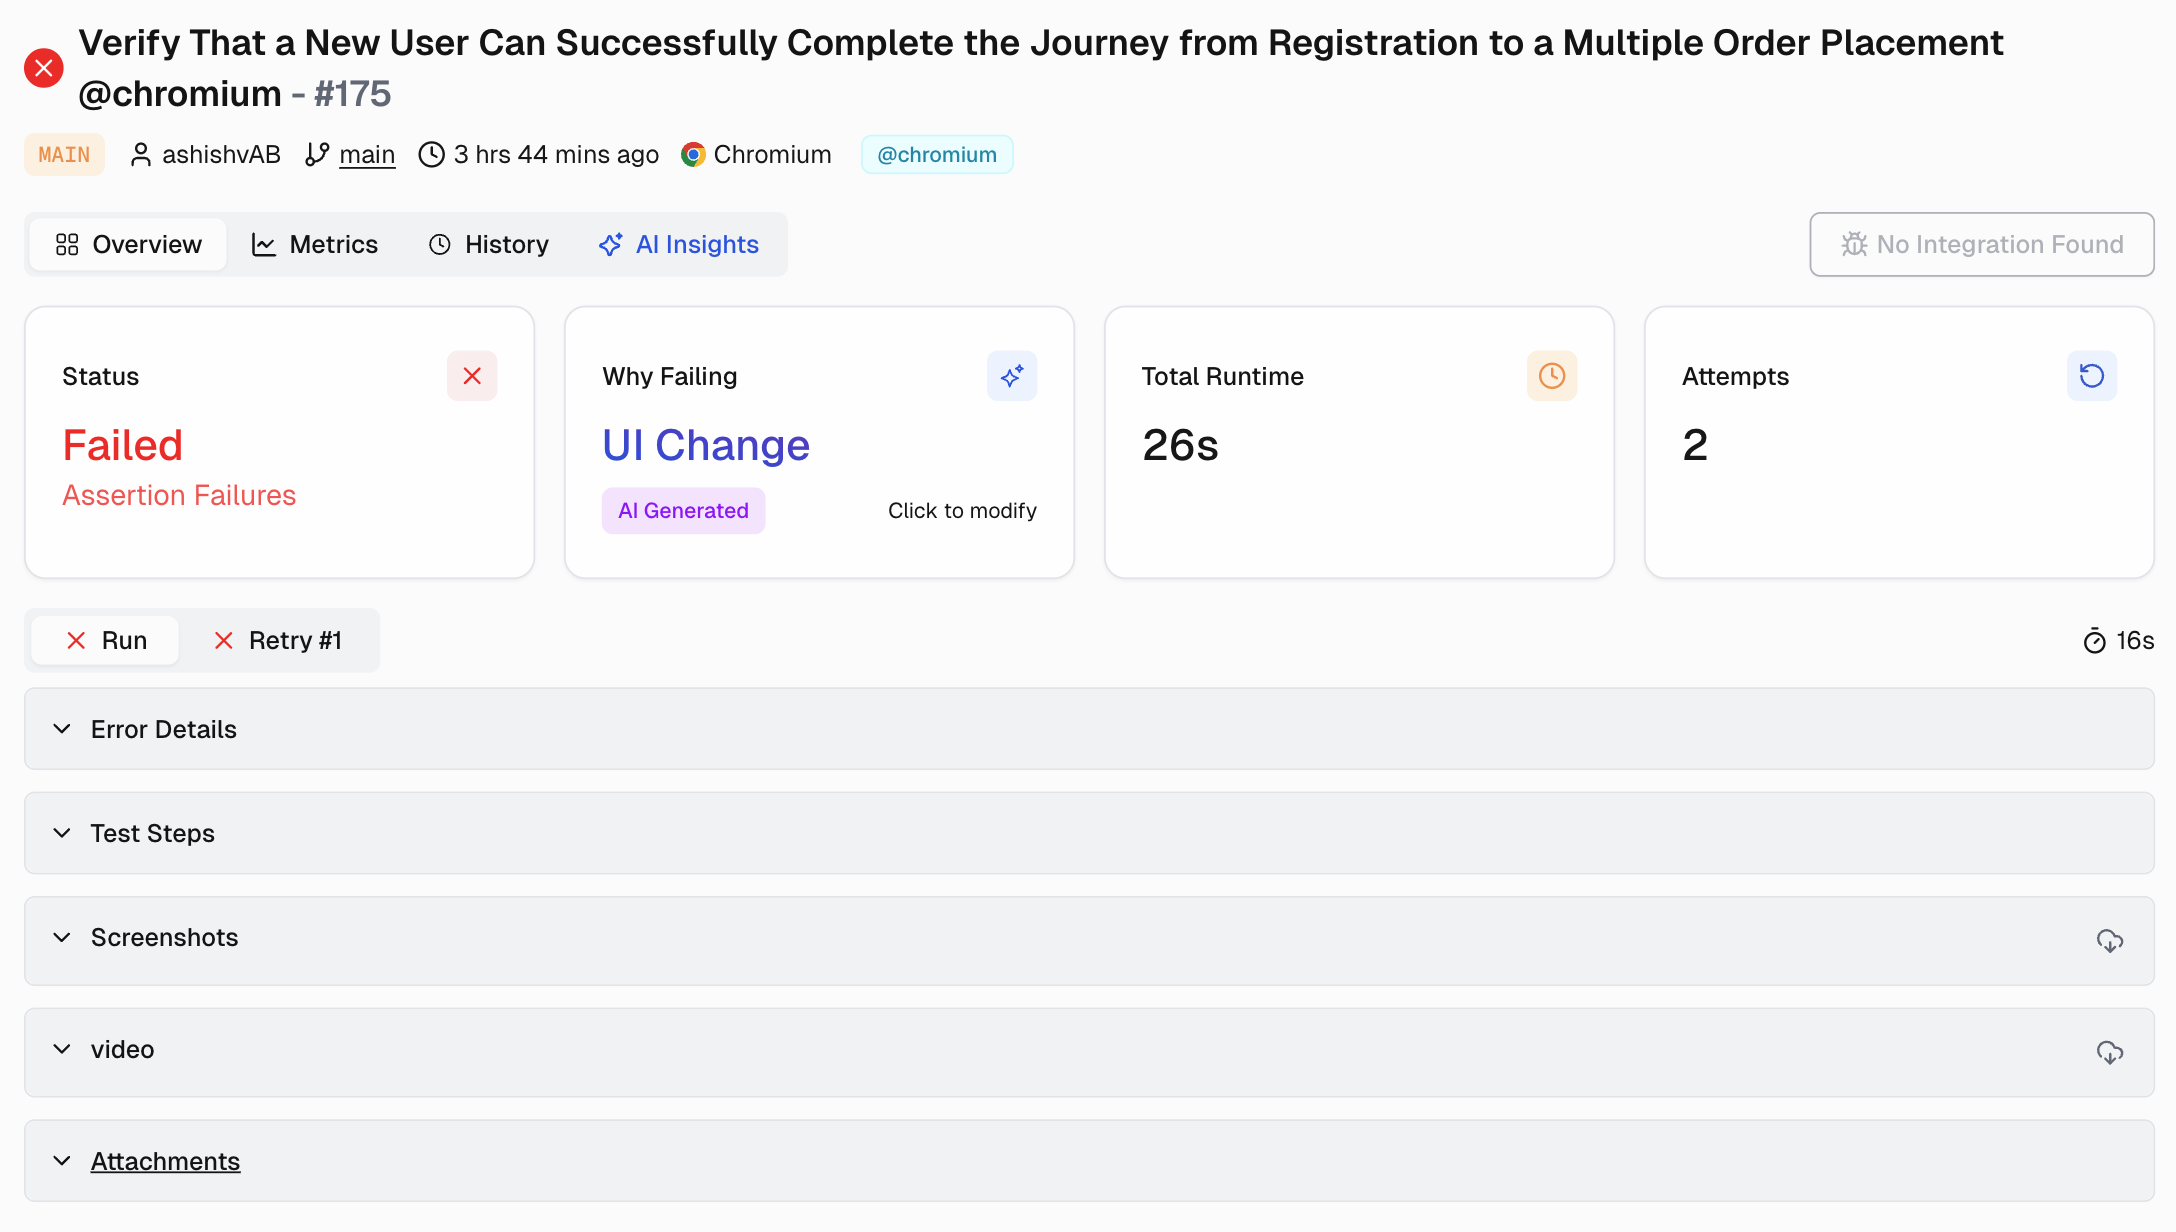
- Get AI-Powered Insights: The platform figures out why tests fail. Is it a real bug? A UI change? Just an unstable test? No more guessing games about who should fix what.
- Track Health Over Time: Watch your test suite's vital signs. Are failure rates climbing? Are tests getting slower? Flakiness creeping up? You'll see the trends before they become problems. For a deeper look, review the test reporting metrics to track.
- Debug Faster: Everything you need lands in one place. Traces, videos, logs, screenshots, all connected to the right commit and pull request.
- Improve Collaboration: Hook it up to Jira or Linear. Get Slack alerts when things break. No more copying and pasting between ten different tools.
Moving from basic Playwright reports to something like TestDino means your team stops fighting fires and starts preventing them. You get real insights, catch problems early, and ship code you actually trust.
TestDino takes what Playwright already does well and adds the missing pieces. Think of it as your test reporting co-pilot that connects all the dots between test runs, spots problems early, and keeps everyone on the same page.
Conclusion
Effective Playwright reporting is more than just generating an HTML file. It's about creating a system that provides fast, actionable feedback to your entire engineering team.
Start by mastering the foundational metrics: test status, diagnostic artifacts, traces, and flaky test detection. Integrate this data into your CI/CD pipeline to provide essential context around every code change.
When your team grows and your test suite scales, move beyond basic reports to a dedicated test analytics platform.
Tools like TestDino provide the historical trends, AI-powered insights, and collaborative workflows needed to manage quality at scale. By investing in your reporting strategy, you reduce debugging time, improve developer productivity, and build a more stable and reliable product.
Ready to see your Playwright reports in a whole new light? Contact us and start your TestDino trial today.
FAQs
Yes, Playwright can measure page load speed and other user-centric performance metrics.
By using the page.evaluate() method to access the browser's window.performance API, you can capture Core Web Vitals like Largest Contentful Paint (LCP) and Cumulative Layout Shift (CLS) to test for performance regressions.
A standard Playwright HTML report is a static file that provides detailed results for a single test run.
A test analytics tool, like TestDino, ingests these reports over time to provide historical trends, cross-run analysis, AI-powered failure classification, and centralized dashboards for team collaboration.
It turns raw data into actionable insights for the entire engineering organization.

Vishwas Tiwari
Software Engineer