Why Playwright Tests Pass Locally but Fail in CI: A Research-Backed Breakdown
Learn the main causes of flaky failures and the debugging steps Playwright recommends for CI.
The problem today is that most teams debug failures one at a time, without a system to understand why tests break.
We combined data from peer-reviewed studies, open-source project analyses, and real-world failure classification patterns from Playwright teams to build the most complete breakdown of test failures available.
The goal: show you where your debugging time goes, and how to cut it in half.
Finding 1: Almost Half of All Failures Trace Back to Async Wait Issues
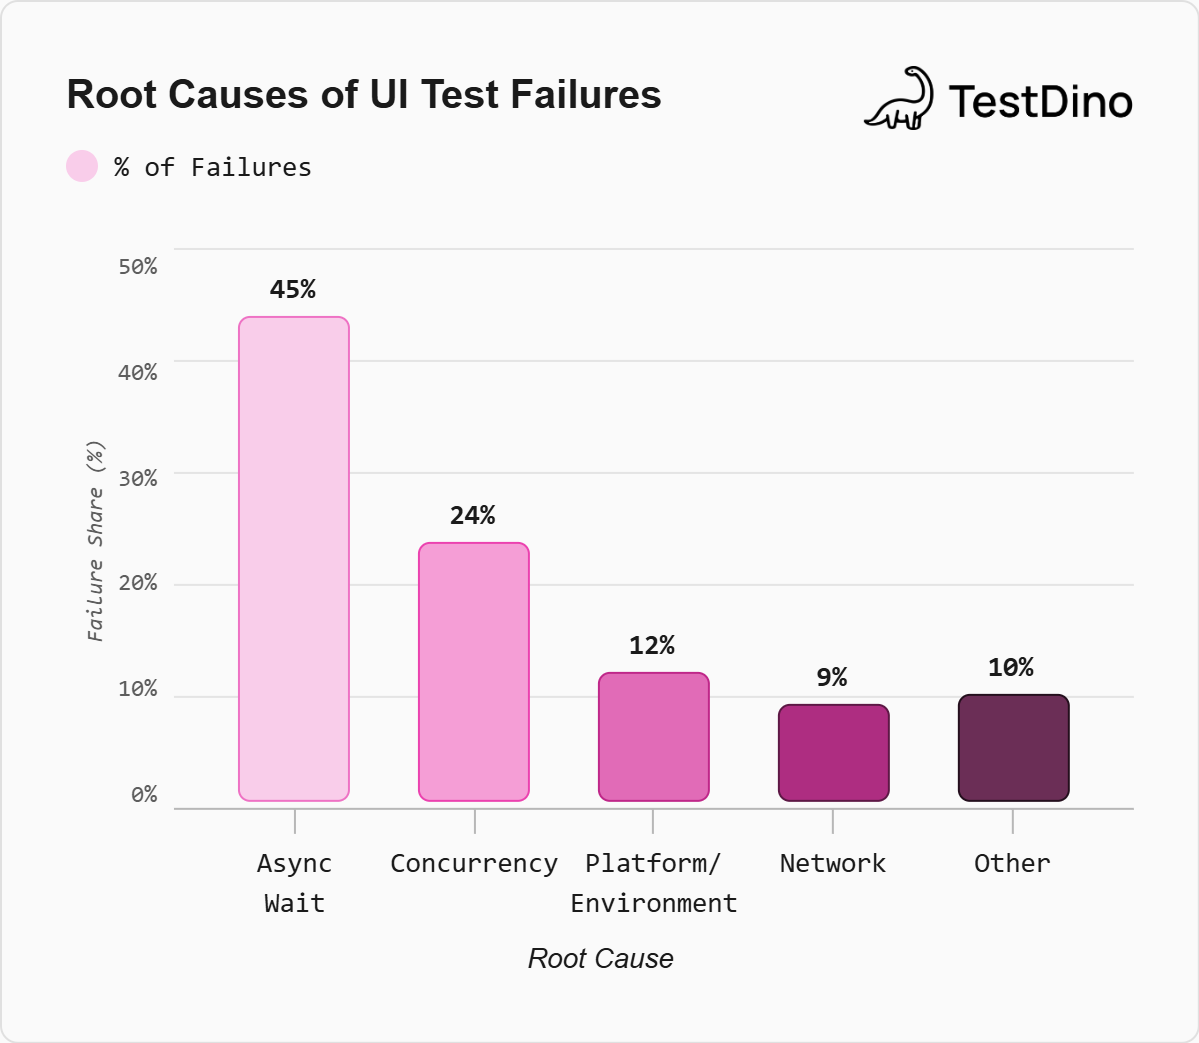
The single biggest category of E2E test failures is async wait, and it’s not close.
Romano et al. found that 45% of flaky UI tests fail because tests don't properly wait for asynchronous operations to complete. Luo et al.'s foundational study confirmed the same pattern: nearly half of flaky-test-fixing commits addressed async wait as the root cause.
In Playwright terms, this shows up as:
- Clicking before an element is interactive: The element exists in the DOM but isn't clickable yet
- Asserting before data loads: API responses haven't returned, so the UI shows a stale or empty state
- Racing against animations/transitions: The page is mid-render when the test acts
| Root Cause Category | % of UI Test Failures | Playwright Equivalent |
|---|---|---|
| Async Wait | 45% | Missing waitFor, premature assertions |
| Concurrency / Race Conditions | ~24% | Parallel tab/context conflicts, shared state |
| Platform / Environment | ~12% | Browser-specific rendering, OS differences |
| Network | ~9% | API timeouts, failed backend requests |
| Test Order Dependency | ~5% | Shared database state between tests |
| Other (IO, Randomness, Time) | ~5% | Timezone-dependent logic, random test data |
Sources: Romano et al., 2021; Luo et al., 2014; Parry et al., 2022

Tip: Playwright's built-in auto-waiting covers many async cases automatically. But auto-wait only applies to actions like click() and fill(). Assertions like expect(locator).toHaveText() need explicit await, and custom logic that checks DOM state manually bypasses auto-wait entirely. That's where most async failures hide..
If you're spending time on random test failures, start by auditing your assertions. Replace manual DOM checks with Playwright's web-first assertions (expect(locator).toBeVisible() instead of checking element properties directly). This alone can address nearly half your failure backlog.
Finding 2: Timeouts Are the Silent Killer
Timeouts sit in a gray zone between real failures and infrastructure noise. The SAP HANA study found that system tests suffer from timeout issues in 18% of cases, compared to just 7% for unit tests. The more complex the test, the more likely a timeout becomes the failure mode.
In Playwright, timeouts show up in three flavors:
-
Action timeouts (default 30s):
page.click()waiting for an element that never appears -
Navigation timeouts (default 30s):
page.goto()on a slow or unresponsive server -
Test timeouts (default 30s per test): The entire test exceeds its time budget
Eck et al.'s study of 200 flaky tests at Mozilla found that test case timeouts and test suite timeouts were frequent enough to warrant their own categories, separate from async wait.
Tip: Don't just increase timeout values when tests fail. That masks the problem. Instead, check whether the timeout is caused by a slow backend (network issue), a missing element (locator issue), or a legitimately slow operation. TestDino's Analytics dashboard tracks duration trends per spec, so you can spot tests gradually slowing down before they start timing out.
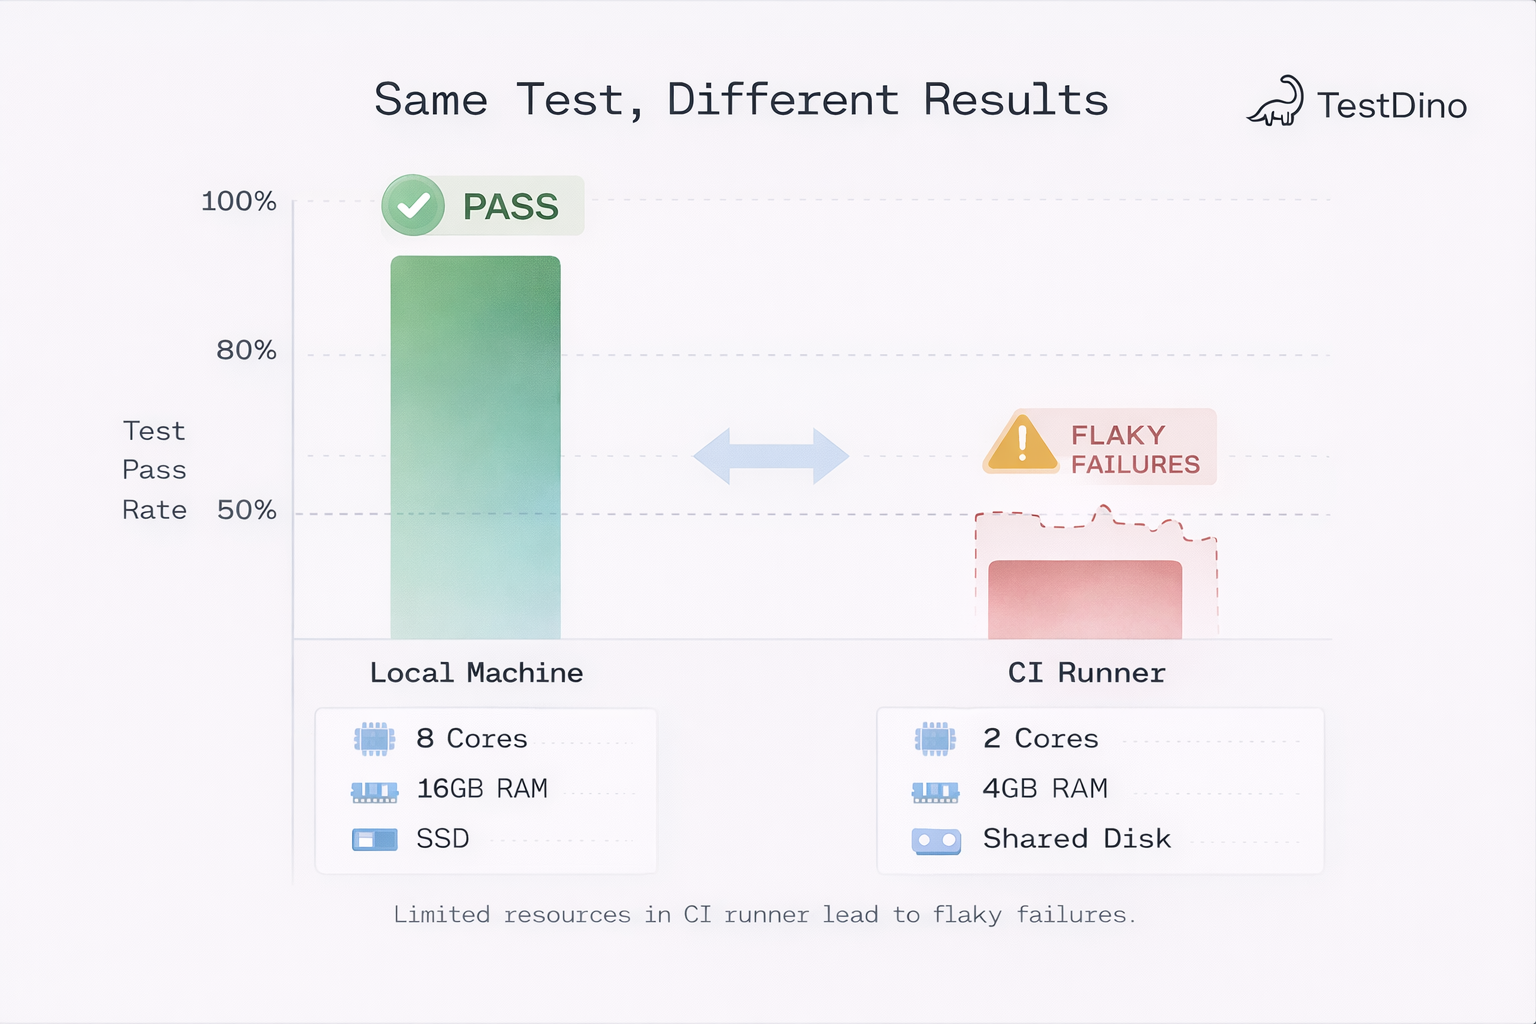
Finding 3: Resource and Environment Flakiness Accounts for Almost Half of All Flaky Tests
Here's a finding that surprised us. A study on resource-affected flaky tests covering 52 projects across Java, JavaScript, and Python found that 46.5% of flaky tests are RAFTs. Their pass/fail behavior depends entirely on available CPU, memory, and I/O at execution time.
This means almost half of your flaky tests aren't flaky because of bad test code — they're flaky because CI runners have variable resources. In Playwright, this shows up as:
- Tests passing locally but failing in CI : Your machine has more CPU/RAM than the CI runner
- Inconsistent behavior across shards : Some shards get resource-starved containers
- Tests failing only under load : Parallel execution increases resource contention
| Factor | Impact on Flakiness | Practical Solution |
|---|---|---|
| CPU availability | Higher CPU reduces the flaky rate substantially | Use consistent CI runner specs |
| Memory pressure | Causes browser crashes and slow renders | Monitor container memory limits |
| Parallel execution | Increases contention between tests | Use Playwright's browser context isolation |
| Network variability | API call timing becomes unpredictable | Mock external APIs in tests |
Before blaming the test code, check your CI environment. TestDino's Environment Mapping lets you compare test results across environments, so you can determine whether failures are coding issues or infrastructure problems.
Finding 4: 13% of CI Build Failures Are Caused by Flaky Tests
A study of open-source projects by Labuschagne et al. found that 13% of failed CI builds were caused by flaky tests, rather than actual code defects. GitHub's internal data from 2020 showed that 1 in 11 commits (9%) had at least one red build due to a flaky test.
At Google's scale, the numbers are even more striking. Almost 16% of their tests show some level of flakiness, and 84% of test transitions from pass to fail involved a flaky test. For a project with 1,000 tests and a 1.5% flaky rate, roughly 15 tests will likely fail on every run, each requiring investigation.
| Metric | Value | Source |
|---|---|---|
| Flaky tests at Google | ~16% of all tests | Micco, 2016 |
| CI builds failed due to flaky tests | 13% | Labuschagne et al., 2017 |
| Commits with flaky red builds (GitHub) | 9% (1 in 11) | GitHub internal data, 2020 |
| Pass-to-fail transitions that are flaky (Google) | 84% | Micco, 2016 |
| Cost of poor software quality (US) | $2.41 trillion | CISQ |
Tip: The real cost isn't the CI minutes. It's the developer time. An industrial case study found developers spend 1.28% of their working time specifically on repairing flaky tests, at a monthly cost of $2,250 per developer. For a team of 10, that's $270,000/year burned on flaky test repairs alone.
Teams that invest in flaky test detection early recoup that cost within weeks.
Finding 5: JavaScript Tests Fail Differently Than Java Tests
Most flaky test research focuses on Java projects. But Verdecchia et al.'s JavaScript-specific study found a meaningfully different root cause distribution for JS/TS codebases
| Root Cause | In Java Studies | In JavaScript Studies |
|---|---|---|
| Async wait / Concurrency | Common | Dominant (primary cause) |
| Test order dependency | Top 3 cause | Rare |
| OS-specific behavior | Occasionally noted | Ranks higher |
| Network stability | Moderate factor | Bigger factor (event-driven arch.) |
| Infrastructure flakiness | Not reported | New category (Gruber et al.) |
This matters for Playwright teams because Playwright tests run in JavaScript/TypeScript by default, in an inherently asynchronous environment where timing is the primary failure mode.
Don't apply Java-focused flaky test advice directly to your Playwright suite. Focus on async patterns, network mocking, and environment consistency rather than test isolation and execution ordering. For a practical checklist, see the Playwright automation checklist.
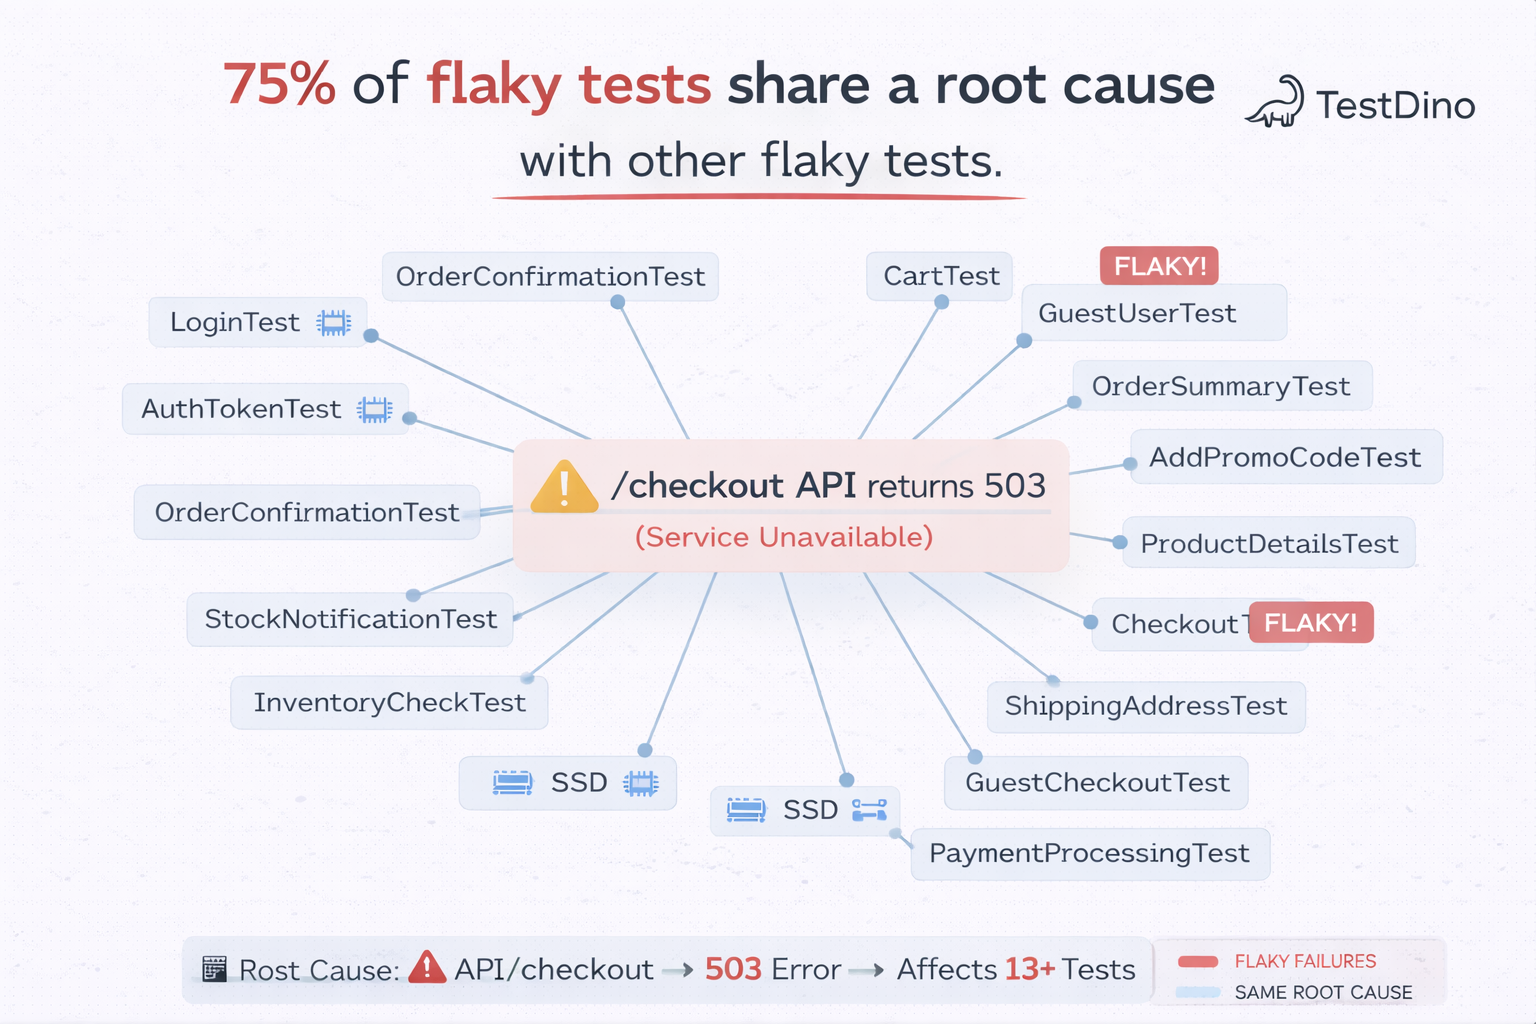
Finding 6: Flaky Tests Cluster Together
One of the most practical findings comes from systemic flakiness research. Across a dataset of 10,000 test suite runs from 24 projects, researchers found:
- 75% of flaky tests belong to a cluster of tests that fail together
- Mean cluster size: 13.5 flaky tests sharing the same root cause
- Predominant causes: intermittent networking issues, unstable external dependencies, shared infrastructure problems
The practical implication: fixing one root cause can stabilize over a dozen tests at once.
Tip: When you find a flaky test, don't just fix that one test. Look at what else failed in the same run. TestDino's error grouping clusters similar failures automatically, so you can see when 15 "different" failures all trace to one broken API endpoint.
How TestDino Automates Failure Analysis
The patterns in this article are exactly what TestDino was built to detect and classify automatically. Instead of manually investigating each failure, TestDino's AI analyzes error messages, stack traces, and historical patterns to categorize every test failure:
- Actual Bug — Consistent failure across environments, pointing to a real product defect
- UI Change — Selector or layout changed after a DOM update, needs locator refresh
- Flaky Test — Intermittent failure from timing, network, or environment issues
- Miscellaneous — Setup issues, data problems, or CI configuration errors
Each classification comes with a confidence score and suggested next steps.
| Research Finding | TestDino Feature | What It Does |
|---|---|---|
| Async wait causes 45% of failures | AI Insights | Classifies timing-related failures with confidence scores |
| Timeouts are the silent killer | Analytics | Tracks duration trends per test case to catch slowdowns |
| 46.5% of flakiness is resource-related | Environment Mapping | Compares results across CI environments |
| Flaky tests cluster together | Debug Failures | Groups similar errors across tests and runs |
| 13% of CI builds fail from flakiness | Flaky Tests tracking | Flags flaky tests with flakiness percentage |
| JS has unique failure patterns | Annotations | Add owner, flaky reason, Slack alerts, and custom tags |
| Faster triage cuts developer cost | Test Explorer | Browse all test cases with full execution history |
What's New in TestDino for Failure Analysis
TestDino's recent releases added features directly relevant to the failure patterns we have discussed:
-
Real-Time Streaming: Watch tests run live in the dashboard with shard-aware tracking. No more waiting for the full suite to complete before seeing failures. Powered by WebSockets with automatic polling fallback.
-
Test Explorer: Browse and search all test cases across a project. Filter by status, tags, or spec files. See how each test behaved over time, including failure and flaky patterns.
-
Enhanced GitHub integration: PR comments and status checks with AI-generated summaries posted directly to pull requests and commits.
-
Code Coverage: Per-run coverage tab with statement, branch, function, and line metrics. Includes sharded-coverage merging and a coverage trend chart in Analytics.
-
Custom Annotations: Owner, Note, Flaky Reason, Link, Notify Slack, and Metric tags for richer failure context and analytics.
-
Slack App integration: Test run notifications with status tables and annotation-based Slack alerts, including private channel support.
For teams running sharded Playwright suites, TestDino provides shard-aware tracking to catch failures as they happen. Combined with CI Optimization (rerun only failed tests via npx tdpw last-failed), you can cut investigation time from hours to minutes.
What This Means for Your Team
Here are the highest-impact actions ranked by expected failure reduction:
-
Audit your assertions first. Async wait causes 45% of UI failures. Replace manual DOM checks with Playwright's web-first assertions. This is the single highest-ROI fix.
-
Track duration trends, not just pass/fail. Timeouts are failures waiting to happen. Monitor which tests are getting slower over time using test analytics.
-
Standardize CI runner resources. Nearly half of flaky tests are resource-affected. Pin your CI container specs and compare results across environments.
-
Fix clusters, not individual tests. 75% of flaky tests share a root cause. When one test flakes, investigate what else failed in the same run using error grouping.
-
Classify before investigating. Don't spend 20 minutes debugging a flaky test that would have passed on retry. Use AI classification to separate actual bugs from noise.
What This Means for Your Team
Here are the highest-impact actions ranked by expected failure reduction:
- Audit your assertions first. Async wait causes 45% of UI failures. Replace manual DOM checks with Playwright's web-first assertions. This is the single highest-ROI fix.
- Track duration trends, not just pass/fail. Timeouts are failures waiting to happen. Monitor which tests are getting slower over time using test analytics.
- Standardize CI runner resources. Nearly half of flaky tests are resource-affected. Pin your CI container specs and compare results across environments.
- Fix clusters, not individual tests. 75% of flaky tests share a root cause. When one test flakes, investigate what else failed in the same run using error grouping.
- Classify before investigating. Don't spend 20 minutes debugging a flaky test that would have passed on retry. Use AI classification to separate actual bugs from noise.
That's the workflow TestDino was built around. AI classifies every failure the moment it happens. Error grouping surfaces the clusters. Analytics tracks whether your fixes actually moved the numbers. Instead of spending 6-8 hours a week on manual triage, your team spends that time shipping features.
The data is in the studies. The patterns are in your test suite. The only question is whether you're tracking them.
FAQs

Vishwas Tiwari
Software Engineer