Top 12 TestDino Alternatives for Your QA and Dev Team
Compare TestDino alternatives and see how Playwright teams use TestDino for AI failure analysis, flaky test tracking, CI optimization, and evidence-rich reports.

Do you ever finish a test run, open the report, and still feel unsure about what actually went wrong?
Honestly, this is a common frustration for QA and Dev teams working with growing test suites and fast-moving CI/CD pipelines. Test reporting should bring clarity, but too often, teams are left digging through logs, rerunning tests, and losing valuable time.
While TestDino has become a popular solution for modern test reporting, many engineering teams eventually begin searching for a TestDino alternative that better fits their scale, workflow, or analytics needs.
As automation adoption increases, expectations around test visibility, actionable insights, and CI/CD-friendly reporting continue to rise.
To help you make an informed decision, this guide explores the top 12 TestDino alternatives for modern QA and Dev teams.
Best TestDino Alternatives
We’ve analyzed and compared a wide range of platforms to create this list of the best TestDino alternatives available today. Each tool was evaluated based on factors that matter most to modern
QA and Dev teams, such as setup simplicity, CI/CD integration, intelligent debugging capabilities, scalability, pricing flexibility, and the overall test reporting experience.
This curated list is designed to help QA engineers, test leads, and engineering managers confidently identify the right TestDino alternative for their automation strategy.
Whether your focus is faster feedback, deeper analytics, or better collaboration across teams, these TestDino competitors offer practical solutions to meet diverse testing and reporting needs.
Best TestDino Competitors for Modern Test Reporting
1. TestDino
TestDino is a Playwright-focused reporting and test visibility platform designed to support teams at different levels of CI maturity. It offers two reporting approaches,
- Native JSON/HTML upload = simple, post-run reporting with minimal change
- TestDino custom reporting = richer metadata + real-time updates + CI controls for teams operating at scale
allowing teams to start simple and adopt more advanced capabilities as their CI usage grows.
Playwright Visual Testing in TestDino
TestDino supports Playwright visual testing by uploading snapshot screenshots and showing visual diffs, baselines, and CI context for visual test failures.
You can view:
- Diff
- Actual
- Expected
inside the Visual Comparison panel for any failed visual test.
See how Playwright visual diffs work inside TestDino:
Visual Testing Setup:
Add a visual assertion
import { test, expect } from '@playwright/test';
test('homepage looks correct', async ({ page }) => {
  await page.goto('/');
  await expect(page).toHaveScreenshot();
});
Run your tests
npx playwright test
Upload the report with images
npx tdpw upload ./playwright-report --token="your-api-key" --upload-images
Configure CI upload (GitHub Actions)
- name: Run Playwright tests
  run: npx playwright test
- name: Upload to TestDino
  if: always()
  run: npx tdpw upload ./playwright-report --token="${{ secrets.TESTDINO_TOKEN }}" --upload-full-json
Examples: View a Failed Visual Test
- Open the failing run in TestDino
- Open the failing test case
- Use the Visual Comparison panel to switch between:
-
- Diff
- Actual
- Expected
Update Baselines After an Intentional UI Change
npx playwright test --update-snapshots
Key Features
- Flaky test detection: identifies unstable tests over time instead of marking everything as "failed.”
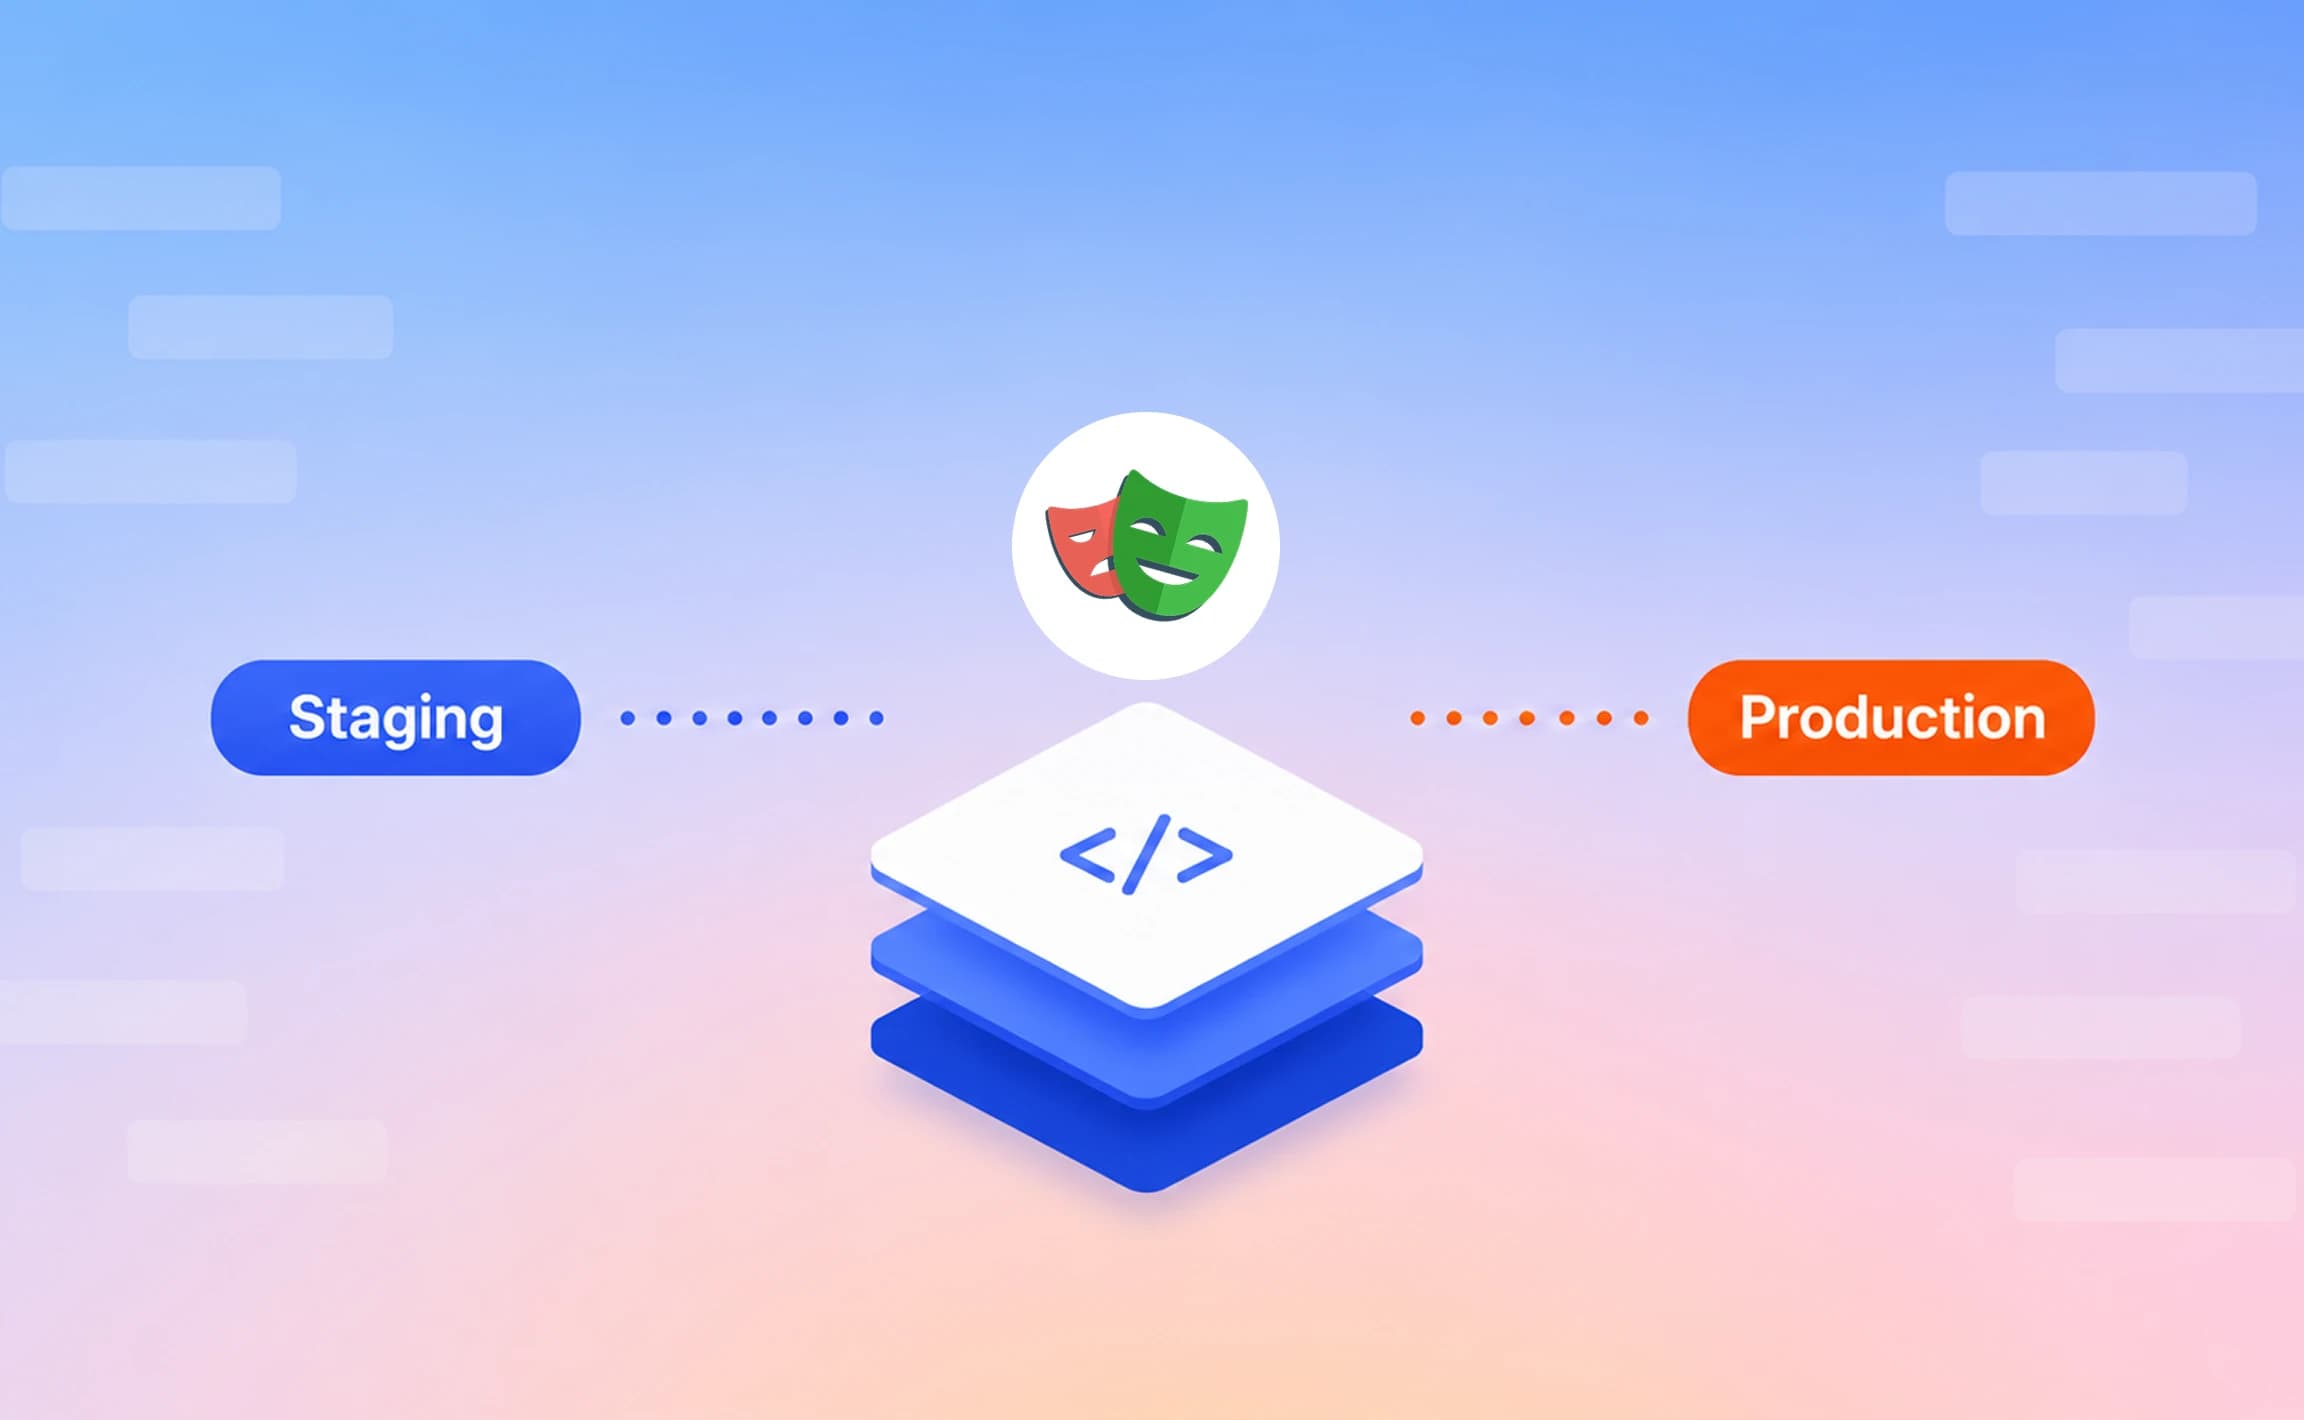
- Cross-environment insights: detect differences between staging, QA, and production behavior.
- Secure access & RBAC controls: granular permissions, time-limited sharing, audit logs, and secure storage.
- Historical run insights: compare test history across branches, environments, and releases.
- AI-powered failure insights: automatically analyzes logs, traces, and history to explain why tests failed.
- CI-first optimization: rerun only failed tests and reduce pipeline time + cost.
- Evidence-rich failure views: screenshots, videos, traces, logs, and steps all in one screen.
- PR + CI workflow automation: automatic PR comments, commit status updates, and base-branch comparisons.
- Role-based dashboards: tailored views for QA, developers, and managers with the right context.
- Adaptive failure classification: learns from project patterns and labels tests as UI change, bug, or unstable.
- Manual + automated test case management: manage test documentation and automation together.
- Integrations: Slack, Jira, Linear, Asana, GitHub, CI tools, email, and bi-directional issue sync.
- Advanced analytics dashboards: visualize trends, performance, retry behavior, and failure hotspots.
Best Use Case
- Needs AI-driven insights to understand why tests fail, not just that they failed
- Wants role-based dashboards for QA, developers, and managers
- Needs historical insights across branches, PRs, and environments
- Wants to rerun only failed tests instead of re-running everything
- Runs large Playwright suites, and debugging failures slows releases
- Deals with flaky tests and unreliable results across CI environments
- Needs GitHub/CI automation (PR comments, commit statuses, workflow triggers)
- Prefers evidence-rich reports (screenshots, videos, traces, logs) in one place
- Wants deep integrations with Jira, Slack, Linear, Asana, and GitHub.
Pros
- Flaky test detection and history make CI more stable and predictable.
- CI-first workflows enable PR comments, reruns, and automation easily.
- Role-based dashboards give each team member the right level of detail.
- AI insights help teams debug faster by explaining real failure causes.
- Reports show traces, screenshots, videos, logs, and steps together.
Cons
- It is most useful for teams that already run tests in CI
- AI gets smarter over time as more test runs are collected
- Some teams may need a short walkthrough before they feel comfortable.
- Right now, it mainly works with Playwright, and other frameworks may come later.
Pricing
| Starter | Pro Plan | Team Plan | Enterprise |
|---|---|---|---|
| Free | $49 / month (Billed monthly) | $99 / month (Billed monthly) | Custom Pricing |
Ideal Team Size
TestDino works well for teams of almost any size, but the value grows as your Playwright tests and CI pipelines scale.
It is an especially good fit when:
- A team has 50+ automated tests, and debugging starts slowing people down
- CI runs happen on every commit or pull request
- Multiple developers or QA members share responsibility for failures
- Flaky tests are becoming harder to track manually
Best for
- startups growing their automation
- mid-size teams building serious CI pipelines
- enterprise teams managing large test suites across branches and environments
If you want to take a quick look without any setup, you can also check out our sandbox environment to see how it works in practice.
2. BugBug
Overview
BugBug is a lightweight, cloud-based test generation tool that enables teams to create automated UI tests using record-and-playback. It focuses on simplicity, speed, and ease of use for web application testing.
Key features
- Record-and-playback-based test generation for web applications.
- Cloud-based test execution with browser support.
- No-code test creation with an intuitive editor.
- CI/CD integration for automated test runs.
- Basic reporting and execution logs for test results.
Pros
- Very easy to use with minimal setup required.
- Fast test creation without writing code.
- Suitable for small teams and startups.
- Low learning curve for non-technical users.
First-Hand Experience
- Very quick to get started with minimal configuration
- Test creation feels intuitive for beginners
- Reporting is limited to basic pass/fail visibility
- Lacks meaningful insights once test volume increases
Best for
Small teams that need quick, no-code UI test generation for web applications without investing in complex automation frameworks.
Pricing
Commercial, subscription-based with a free trial available.
Ideal for
Startups and small QA teams looking for simple and fast UI test automation.
Final Verdict
- Easy to start, minimal setup
- Reporting lacks depth for scaling teams
- Better suited for basic automation than analytics-driven QA
3. TestRail
Overview
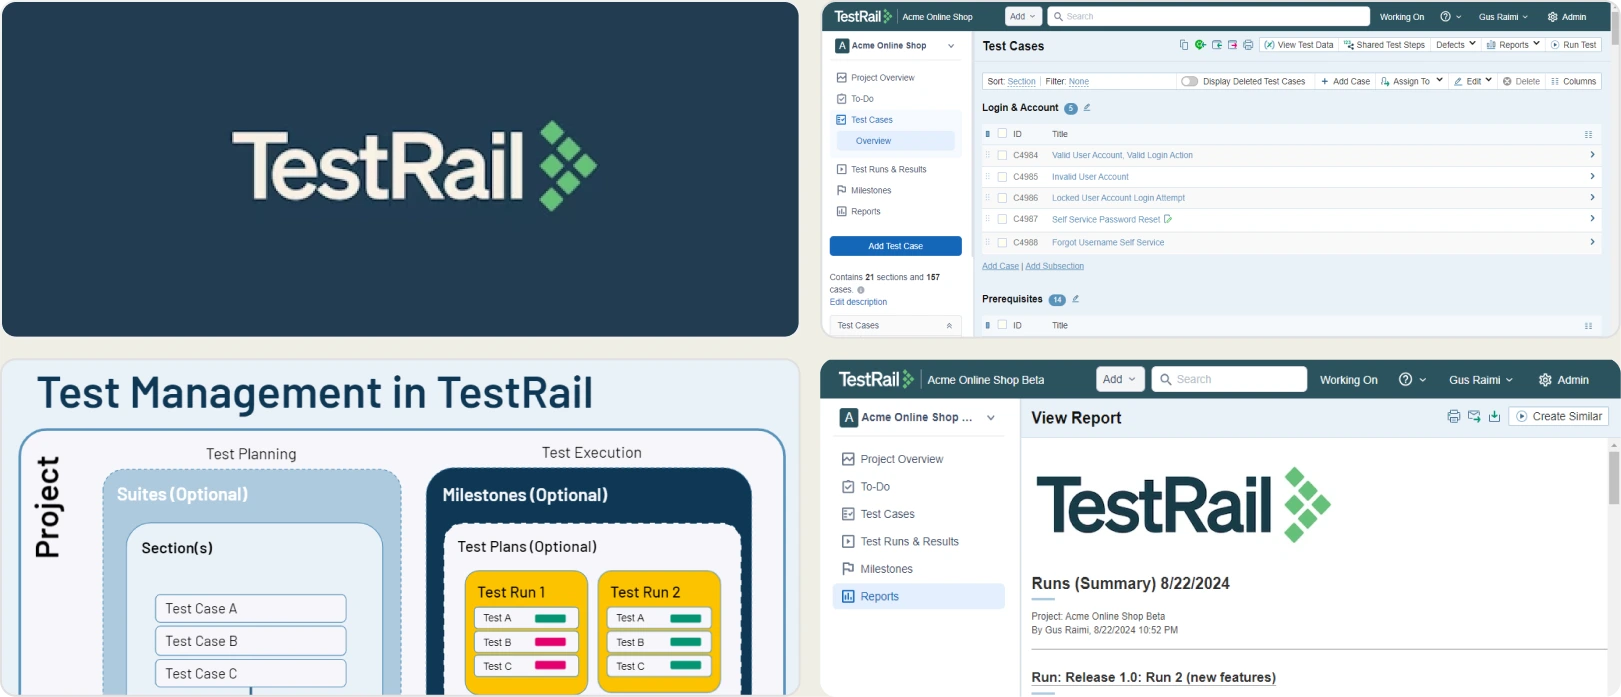
TestRail is a widely adopted test management platform designed to help QA teams organize, execute, and report on manual and automated tests. It focuses on structured test case management and execution tracking rather than real-time CI/CD analytics or intelligent test insights.
Key Features
- Centralized test case repository for organizing manual and automated tests in one place
- Test plans and test runs to manage execution across multiple environments and releases
- Customizable dashboards showing execution status, coverage, and progress metrics
- Built-in reporting for pass/fail trends, test coverage, and execution history
- REST API support to integrate automated test results from CI/CD pipelines
- Role-based access control to manage permissions across QA, Dev, and stakeholders
- Requirement traceability linking tests to user stories, requirements, and defects
- Support for attachments such as screenshots, logs, and comments on test results
- Cloud-hosted and self-managed deployment options for flexibility
- Integration with popular issue trackers like Jira, GitHub, and Azure DevOps
Pros
- Mature and stable platform trusted by large organizations
- Strong test case organization and traceability
- Supports hybrid testing (manual + automation)
- Flexible reporting options for compliance and audits
- Broad ecosystem support and documentation
Cons
- Not built for real-time CI/CD test analytics
- Limited failure intelligence and root-cause insights
- Reporting feels static compared to modern analytics tools
- UI can feel dated and less intuitive
- Requires additional tools for advanced automation reporting
First-Hand Experience
- Excellent for maintaining structured test repositories
- Works reliably for test planning and execution tracking
- Automation results often feel secondary to manual testing workflows
- CI feedback is slower and less actionable
- Teams frequently pair TestRail with other reporting tools for deeper insights
Best For
Teams that use formal test case management and need strong traceability across manual and automated testing efforts.
Pricing
TestRail offers paid plans only, with pricing based on the number of users and deployment type (cloud or self-hosted).
Ideal Team
Small to medium-sized teams that need structured test management and compliance-friendly reporting.
Final Verdict
- Strong choice for traditional test management
- Reliable for manual and hybrid testing workflows
- Limited as a standalone TestDino alternative for CI/CD analytics
- Best used alongside modern test reporting platforms for deeper insights
4. Zebrunner
Overview
Zebrunner is a centralized test reporting and analytics platform focused on aggregating automated test results across multiple frameworks. It emphasizes historical visibility and execution tracking rather than intelligent failure analysis.
Key Features
- Centralized dashboard to collect automated test results from different pipelines
- Support for Selenium, TestNG, JUnit, Cypress, and other frameworks
- Historical execution trends to track stability over time
- CI/CD integrations for automated result ingestion
- Test run comparison across branches and builds
- Artifact storage, including logs and execution metadata
- Cloud and self-hosted deployment options
Pros
- Centralizes test results across teams and pipelines
- Useful historical trend tracking
- Framework-agnostic support
- Flexible deployment options
Cons
- Setup and configuration require effort
- No AI-based failure analysis
- Limited flaky test intelligence
- UI can feel overwhelming for new users
First-Hand Experience
- Helpful for consolidating automation results
- Takes time to configure correctly
- Insights are descriptive, not diagnostic
Best for
Teams that use Selenium or mixed frameworks and need centralized reporting.
Pricing
Free tier available with paid plans for advanced features.
Ideal Team
Designed for medium-sized QA teams running established automation pipelines and needing centralized reporting.
Final Verdict
- Solid reporting foundation
- Limited intelligence compared to TestDino
- Better as a reporting layer than a full analytics solution
5. Datadog
DataDog Alternative, DataDog Review, DataDog Comparison, DataDog vs TestDino
Overview
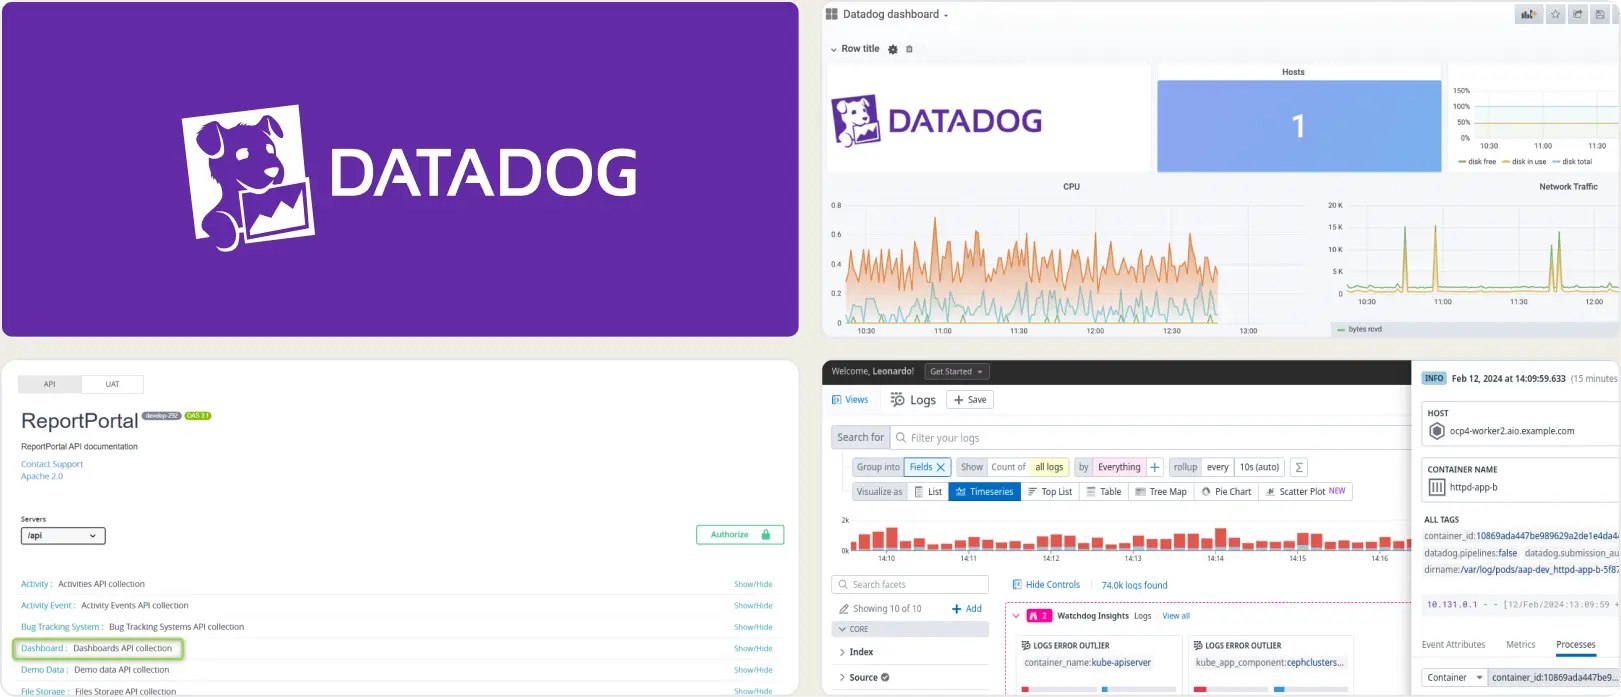
Datadog is primarily an observability and monitoring platform that can also ingest test execution data. It excels at correlating test failures with infrastructure and performance metrics rather than pure test reporting.
Key Features
- Correlation of test failures with system metrics and logs
- Real-time dashboards and alerts
- Highly scalable metrics ingestion
- Deep infrastructure and application monitoring
- CI/CD pipeline integrations
- Custom queries and metrics for test data
Pros
- Exceptional system-level visibility
- Strong real-time monitoring and alerts
- Scales well for large organizations
- Excellent DevOps tooling
Cons
- Not built specifically for test reporting
- Requires significant customization for QA use
- High cost at scale
- Steep learning curve for testers
First-Hand Experience
- Extremely powerful but complex
- QA teams depend on DevOps support
- Best value comes from customization
Best for
Teams that use DevOps-heavy workflows and want test-to-infrastructure correlation.
Pricing
Paid, usage-based pricing.
Ideal Team
Best for large to enterprise engineering teams that require deep observability and test-to-infrastructure correlation.
Final Verdict
- Excellent observability platform
- Overkill for pure test reporting
- Not a direct TestDino replacement
6. Leapwork
Overview
Leapwork is a no-code test automation platform designed to help teams build and execute automated tests without writing code. Its reporting capabilities focus on execution visibility and stability rather than advanced analytics or intelligent insights.
Key Features
- Visual, flow-based test design that allows non-technical users to create automation without scripting
- Centralized execution dashboard showing test run status across environments
- Built-in reporting for execution results, failures, and run history
- Cross-technology automation support, including web, desktop, and legacy systems
- Enterprise-grade integrations with CI/CD tools and test environments
- Role-based access controls for large QA organizations
Pros
- Significantly lowers the barrier to test automation adoption
- Enables collaboration between QA, business, and technical teams
- Stable execution environment suitable for enterprise use
- Minimal coding knowledge required to maintain tests
Cons
- Reporting focuses on execution status rather than analytical insights
- No AI-based failure analysis or flaky test detection
- High licensing cost makes it less accessible for smaller teams
- Limited flexibility for developer-centric workflows
First-Hand Experience
- Very easy to onboard non-technical testers
- Automation creation is intuitive but rigid for advanced use cases
- Reporting answers what failed, but not why it failed
Best for
Teams that use no-code automation and involve business users or manual testers transitioning to automation.
Pricing
Enterprise-only pricing with custom quotes.
Ideal Team
Well suited for medium to large organizations that rely on no-code automation and involve non-technical testers.
Final Verdict
- Excellent no-code automation platform
- Reporting is functional but shallow
- Not suitable as a TestDino alternative for analytics-driven teams
7. Xray
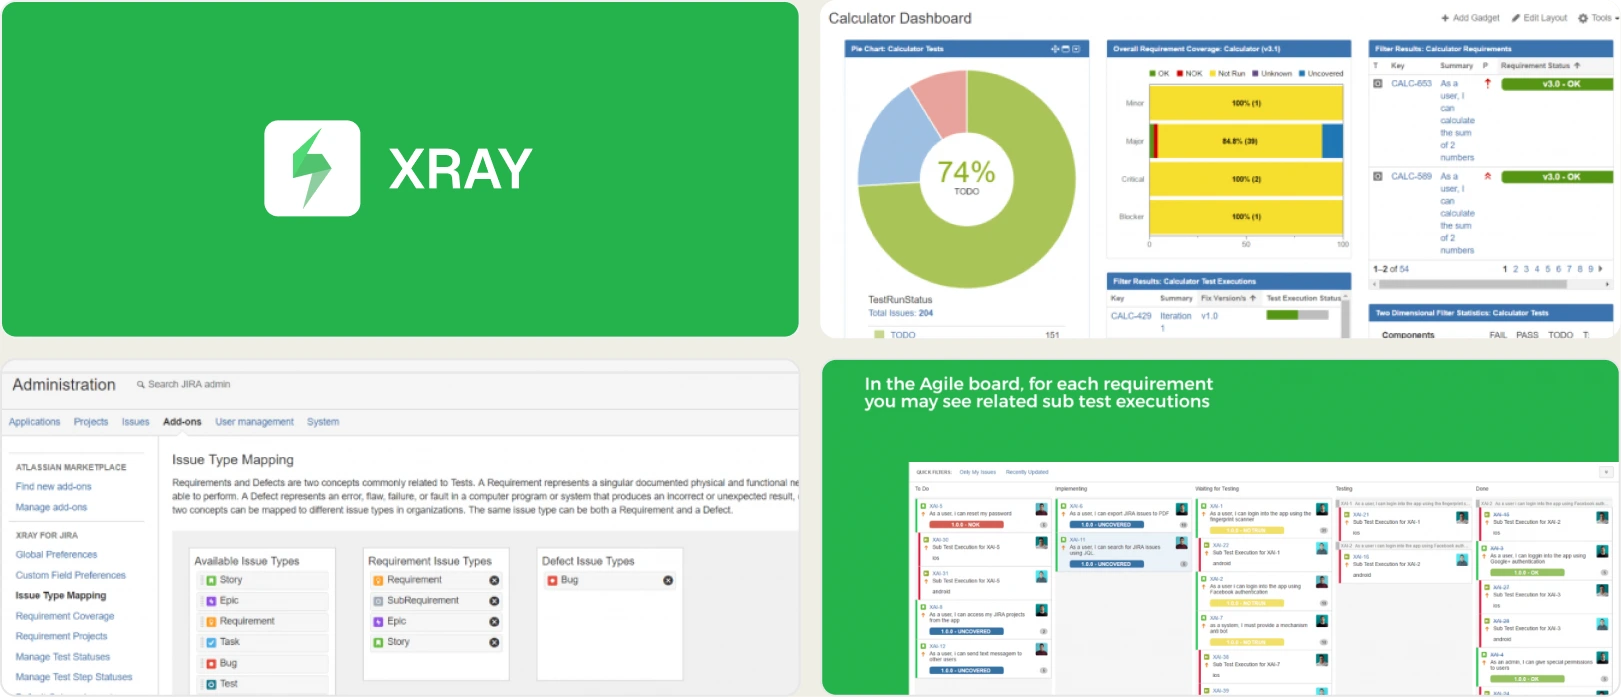
Overview
Xray is a Jira-native test management solution focused on traceability, compliance, and alignment with development workflows. Its reporting capabilities are tightly coupled with Jira dashboards and gadgets.
Key Features
- Native Jira integration for test case management and execution tracking
- Requirement, story, and defect traceability for compliance-driven teams
- Support for both manual and automated test results
- Jira dashboards and gadgets for reporting test status
- REST APIs for CI/CD and automation integration
- Audit-friendly reporting for regulated industries
Pros
- Seamless experience for Jira-centric teams
- Strong traceability between tests and development artifacts
- Well-suited for compliance and governance needs
- Familiar UI for teams already using Jira
Cons
- Reporting depth is limited by Jira’s interface
- Poor real-time CI/CD feedback
- No standalone analytics or advanced insights
- Performance can degrade with large datasets
First-Hand Experience
- Works best when everything lives inside Jira
- Reporting feels restrictive and static
- Difficult to extract actionable insights from pipelines
Best for
Teams that rely heavily on Jira and need traceability over analytics.
Pricing
Paid, per-user pricing through Atlassian Marketplace.
Ideal Team
Ideal for medium to large teams working primarily inside Jira with strong traceability and compliance needs.
Final Verdict
- Excellent Jira-native test management
- Weak analytics and insights
- Compliance-focused rather than intelligence-driven
8. Qase
Overview
Qase is a cloud-based test management tool built with a strong focus on usability and fast adoption. It provides clear execution reporting and basic automation integrations, but it is not designed for advanced analytics or deep CI/CD intelligence.
Key Features
- Centralized test case management with hierarchical organization, tags, and reusable steps
- Test runs and execution tracking with clear pass, fail, blocked, and skipped statuses
- REST API and native CI/CD integrations to upload automated test results
- Lightweight dashboards showing execution progress and overall test coverage
- Integrations with Jira, GitHub, GitLab, and other development tools
- Cloud-hosted architecture with minimal setup and maintenance requirements
Pros
- Very clean and intuitive user interface that reduces onboarding time
- Easy for QA and developers to collaborate on test execution
- Affordable pricing compared to enterprise test management tools
- Suitable for teams transitioning from spreadsheets or basic tools
Cons
- Reporting focuses on status visibility rather than insights
- Limited historical trend analysis across builds and releases
- No intelligent failure grouping or flaky test detection
- Automation reporting feels secondary as test volume grows
First-Hand Experience
- Extremely easy to start using with almost no training required
- Reporting is readable but stays at a high level
- Teams typically outgrow Qase once automation becomes central
Best for
Teams that use test case management with light automation and prioritize simplicity.
Pricing
Free plan available, with paid plans for larger teams and integrations.
Ideal Team
A good fit for small to medium teams looking for modern test management with simple reporting.
Final Verdict
- Excellent usability and fast adoption
- Limited analytical depth
- Entry-level alternative rather than a full TestDino competitor
9. Tricentis
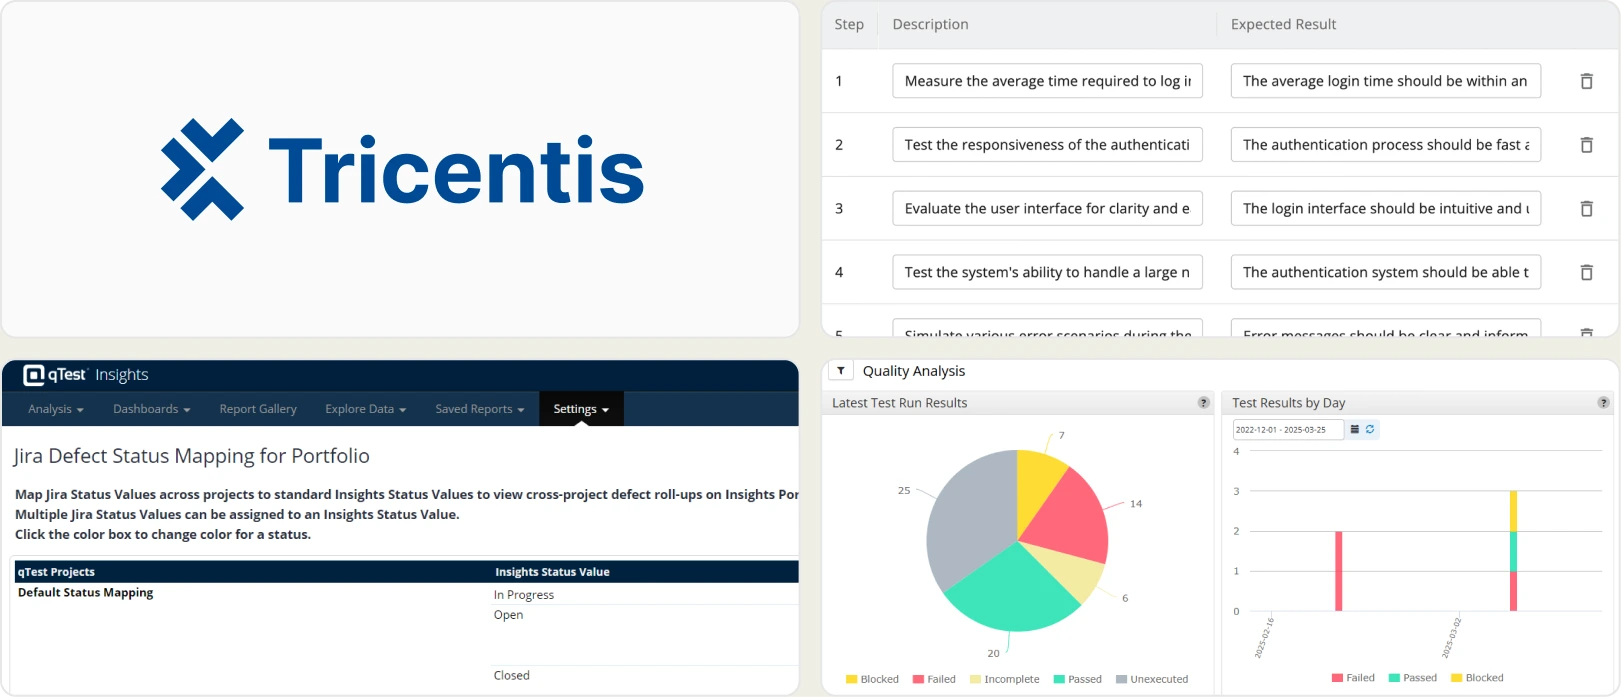
Overview
Tricentis is a large-scale enterprise testing platform offering automation, test management, and reporting capabilities. It is designed for complex organizations with strict governance, not for lightweight or fast-moving teams.
Key Features
- End-to-end enterprise automation and test management suite
- Advanced dashboards with executive-level reporting and KPIs
- Risk-based testing to prioritize test coverage based on business impact
- Deep integrations with SAP, legacy systems, and enterprise CI/CD tools
- Role-based access, audit logs, and governance controls
- Support for large, distributed QA organizations
Pros
- Extremely powerful and comprehensive platform
- Strong reporting for audits, compliance, and governance
- Scales well across very large organizations
- Dedicated enterprise support and training
Cons
- Very high licensing and implementation costs
- Long onboarding and setup cycles
- Requires dedicated teams to manage and operate
- Overly complex for agile, DevOps-focused teams
First-Hand Experience
- Capable of handling extremely complex testing environments
- Tooling overhead slows down feedback cycles
- Benefits are only realized at enterprise scale
Best for
Large enterprises with mature QA processes and regulatory requirements.
Pricing
Enterprise-only pricing with custom contracts.
Ideal Team
Built for enterprise-scale organizations with complex testing requirements and dedicated QA departments.
Final Verdict
- Enterprise-grade powerhouse
- High cost and operational complexity
- Poor fit for modern CI/CD-first teams
10. Squash TM
Overview
Squash TM is an open-source test management solution designed for teams that want full control over their testing workflows and infrastructure. It focuses on manual test management and traceability, with reporting kept intentionally simple.
Key Features
- An open-source test management platform that can be fully self-hosted
- Manual test case creation, execution tracking, and test campaign management
- Customizable workflows to align with internal QA processes
- Requirement and defect traceability through configurable links
- Plugin-based architecture for extending functionality
- Support for test execution history and basic reporting
- Full control over data storage and security
Pros
- No licensing costs, making it attractive for budget-conscious teams
- High flexibility due to open-source nature
- No vendor lock-in or forced upgrade cycles
- Can be customized to match specific organizational processes
Cons
- User interface feels outdated compared to modern tools
- Reporting is limited to basic execution metrics
- No built-in analytics or CI/CD intelligence
- Requires in-house expertise to install, maintain, and upgrade
- Lacks native automation reporting capabilities
First-Hand Experience
- Flexible but cumbersome in daily usage
- Reporting often requires manual effort to extract value
- Maintenance overhead increases as usage grows
Best for
Teams that prefer open-source tools, self-hosting, and full control over their QA stack.
Pricing
Free (self-hosted, open-source).
Ideal Team
Suitable for small to medium teams that prefer open-source, self-hosted test management solutions.
Final Verdict
- Flexible and cost-effective
- Weak reporting and insights
- Best suited for technically mature teams willing to maintain tooling
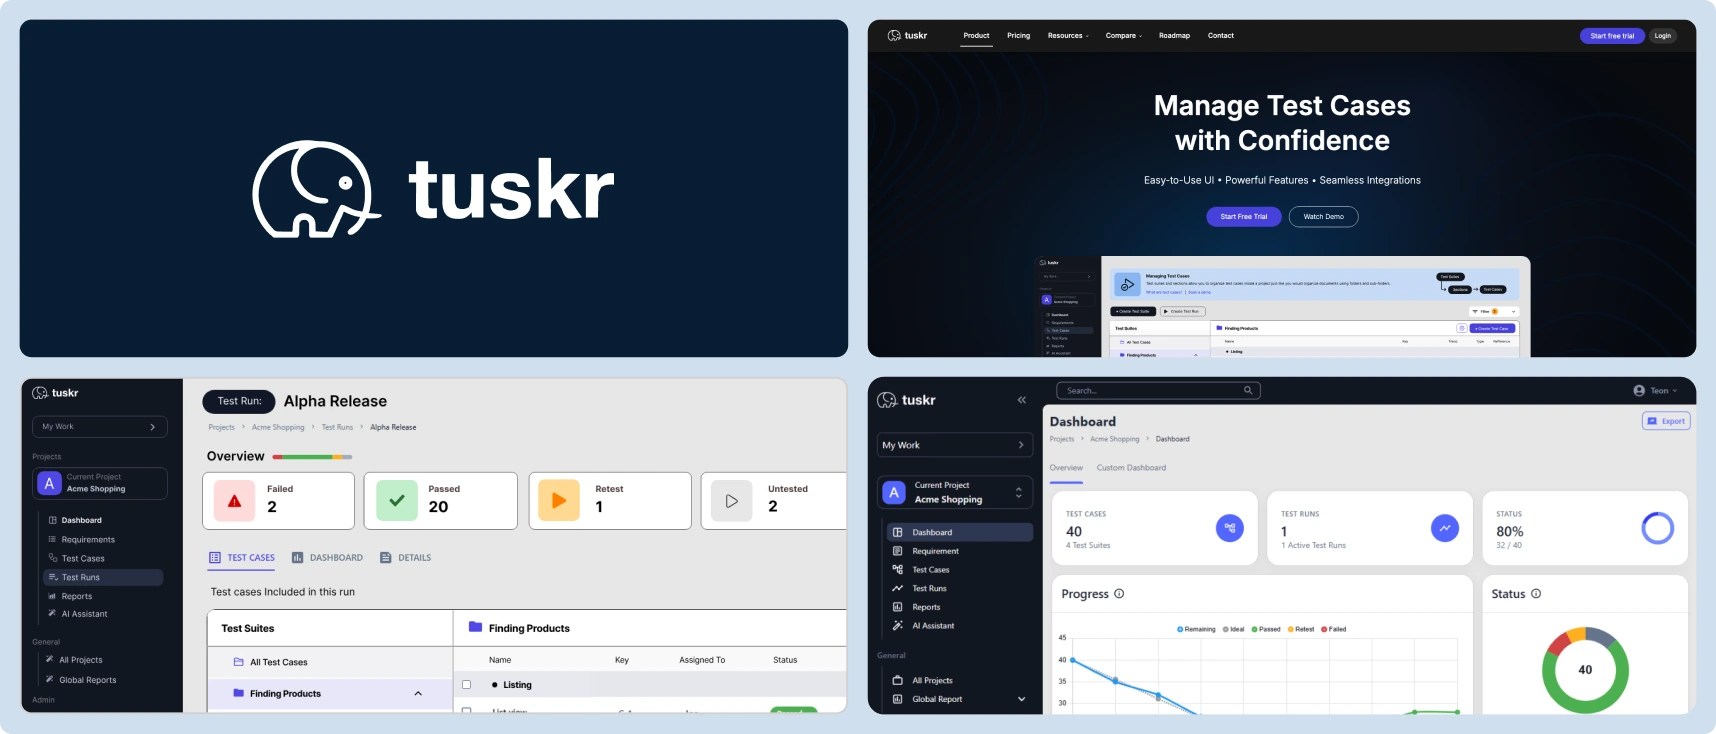
11. Tuskr
Tuskr
Overview
Tuskr is a lightweight, cloud-based test management tool built for simplicity and ease of use. It focuses on basic test organization and execution tracking rather than analytics or automation intelligence.
Key Features
- Simple test case management with folders and tags
- Manual test execution tracking with pass/fail status
- Clean dashboards showing execution progress
- Cloud-based access with fast setup and minimal configuration
- Basic integrations with CI tools and issue trackers
- Collaboration features such as comments and assignments
Pros
- Very easy to learn and use, even for non-technical users
- Clean and uncluttered user interface
- Affordable pricing for small teams
- Quick setup with no maintenance overhead
Cons
- Reporting is limited to basic execution visibility
- No advanced analytics or historical trend analysis
- Limited automation reporting support
- Not designed to scale for large or complex teams
- No intelligent insights into failures or quality trends
First-Hand Experience
- Smooth onboarding with almost no learning curve
- Reporting works well for basic needs only
- Teams often outgrow Tuskr as automation increases
Best for
Small QA teams that need simple test tracking without complexity.
Pricing
Low-cost paid plans with per-user pricing.
Ideal Team
Best for very small teams or startups that need lightweight test tracking at a low cost.
Final Verdict
- Simple, clean, and affordable
- Very limited insights
- Best suited for early-stage or small teams
12. Testmo
Overview
Testmo is a modern test management platform that aims to unify manual testing, exploratory testing, and automated test results in one place. It prioritizes visibility and workflow consolidation over advanced analytics.
Key Features
- Unified platform for managing manual tests, automation results, and exploratory sessions
- Dashboards showing execution status, coverage, and team activity
- CI/CD integrations to import automated test results
- Support for exploratory testing with session-based tracking
- Cloud-hosted platform with modern UI and frequent updates
- API access for custom integrations
Pros
- Consolidates multiple QA workflows into a single too
- Modern and polished user interface
- Good high-level visibility across testing activities
- Actively maintained with regular improvements
Cons
- Analytics remain surface-level and descriptive
- No AI-based failure analysis or flaky test detection
- Dashboards can feel crowded as usage grows
- Limited customization for deep reporting needs
First-Hand Experience
- Helpful for centralizing QA activities
- Reporting answers what happened, but not why it happened
- Often paired with analytics-focused tools for deeper insights
Best for
Teams that want a single platform to manage different testing workflows.
Pricing
Paid plans only.
Ideal Team
Medium-sized teams that want unified test management across manual and automated workflows.
Final Verdict
- Strong workflow consolidation
- Limited analytical intelligence
- Good mid-size team solution, not a TestDino replacement
How to Compare TestDino Alternatives
| Feature Category | TestDino | Datadog | Zebrunner | PractiTest | TestRail |
|---|---|---|---|---|---|
| Role-Based Dashboards | |||||
| Flaky Test Analysis | |||||
| Test Case Management | |||||
| Environment Management | |||||
| CI/CD Optimization | |||||
| Rerun Failed Tests | |||||
| Test Reporting | |||||
| Evidence Collection | |||||
| Analytics & Insights | |||||
| AI Failure Recommendations | |||||
| Specs Explorer | |||||
| Pull Request / Commit Awareness | |||||
| GitHub CI Checks | |||||
| Jira / Linear / Asana | |||||
| Slack App & Webhooks | |||||
| Integrations (Dev + QA) | |||||
| Organization & Access Management |
How to Select the Proper TestDino Alternative
Selecting the right TestDino alternative starts with understanding how mature your CI workflows are today and how quickly they are evolving. TestDino is designed to support teams at multiple stages of CI maturity, which makes it a useful reference point when comparing other tools.
Below are the key areas you should evaluate, explained using how TestDino approaches each problem.
1. Start With Your CI Maturity Level
Before comparing tools, assess how your tests currently run in CI:
- Do you run Playwright tests occasionally or on every commit and pull request?
- Are test results reviewed manually, or do they actively block merges and releases?
- Are debugging failures becoming a bottleneck for developers and QA?
TestDino supports two reporting approaches, which highlight how alternatives often differ:
Reporting Option 1: Native Playwright JSON + HTML Reports
The first approach uses Playwright’s native JSON and HTML reports, which are uploaded to TestDino after the test run completes.
This option is ideal for:
- Small teams or startups
- Simple CI pipelines
- Teams that want zero disruption to their existing Playwright setup
In this mode, Playwright runs normally, generates its HTML and JSON output, and TestDino processes the completed report once execution finishes. Teams get centralized access to test results, screenshots, and traces without introducing additional runtime complexity.
Reporting Option 2: TestDino Custom Reporting
For more advanced CI teams, TestDino offers a custom TestDino reporting format. This option generates reports in TestDino’s own structure, which can capture significantly more metadata than
Playwright’s native HTML/JSON output.
This matters because Playwright’s default reports are designed mainly for “what happened in this run,” while TestDino’s custom format is designed for “what happened, why it happened, and how to optimize CI around it.”
What this option includes by default
- Richer metadata than native Playwright HTML/JSON (run context, execution signals, CI-level details, etc.)
- Real-time status updates during execution (no need to wait for the full HTML report to finish)
- Full CI controls that enable deeper workflow and pipeline optimization
- WebSockets-based live streaming for continuous updates as tests run
- Enables CI optimization use cases like smarter sharding, job/runner orchestration, and faster feedback loops
In short
- Native JSON/HTML upload = simple, post-run reporting with minimal change
- TestDino custom reporting = richer metadata + real-time updates + CI controls for teams operating at scale
2. Evaluate Reporting Depth and Debugging Intelligence
One of the biggest differentiators between TestDino and many alternatives is how failures are explained.
Look for tools that provide:
- AI-driven failure insights instead of raw logs
- Failure classification (bug vs UI change vs flaky test)
- Historical context across runs, branches, and environments
- Evidence-rich failure views with screenshots, videos, traces, logs, and steps in one place
If a tool only reports pass/fail outcomes without context, debugging time will grow as test volume increases.
3. Assess Flaky Test Handling and Stability Insights
Flaky tests are often the reason teams move away from basic reporting tools.
When comparing alternatives, check whether the platform:
- Detects flaky tests over time instead of per-run
- Tracks retry behavior and instability trends
- Differentiates unstable tests from real regressions
- Helps teams reduce CI noise rather than amplify it
TestDino’s approach emphasizes long-term stability analysis, which is critical once CI runs become frequent and shared across teams.
4. Look at CI/CD Optimization Capabilities
Not all reporting tools are CI-first.
A strong TestDino alternative should support:
- Rerunning only failed tests instead of entire suites
- Pull-request–level insights and comparisons
- Commit status updates and automated PR comments
- Faster feedback loops through real-time or near-real-time updates
If your pipeline cost or execution time is increasing, CI optimization features become just as important as reporting.
5. Consider Collaboration and Role-Based Visibility
Different roles consume test data differently.
Evaluate whether the tool provides:
- Role-based dashboards for QA, developers, and managers
- Clear summaries for non-QA stakeholders
- Easy sharing without exposing unnecessary noise
- Secure access controls, audit logs, and permission management
TestDino’s role-based dashboards highlight why a “one-size-fits-all” report often fails as teams grow.
6. Review Integration Ecosystem
Your test reporting tool should fit naturally into your existing workflow.
Check whether alternatives integrate with:
- GitHub and CI tools for automation and status checks
- Slack for notifications and alerts
- Jira, Linear, or Asana for issue tracking
- Email or webhooks for broader communication
Tight integrations reduce manual work and ensure test insights are acted on quickly.
7. Match the Tool to Your Team Size and Growth Path
Finally, consider where your team is today—and where it will be in 6–12 months.
TestDino tends to deliver the most value when:
- Teams have 50+ automated Playwright tests
- CI runs occur on every commit or pull request
- Multiple developers and QA engineers share responsibility for failures
- Flaky tests are becoming difficult to track manually
- Historical insights across branches and environments matter
If your team is very small or not yet CI-driven, simpler tools may suffice. As automation scales, tools designed for CI-first workflows become essential.
Conclusion
Choosing the right TestDino alternative ultimately comes down to how mature your CI workflows are and how quickly your team needs to understand and act on test failures.
Tools that offer intelligent reporting, flaky test detection, and CI-first workflows help teams move faster with greater confidence as automation scales.
As test suites grow and releases accelerate, relying on basic or post-run reporting can slow teams down. Modern platforms like TestDino show how AI-driven insights, deep CI integration, and role-based visibility can turn test results into clear, actionable decisions.
FAQs
A TestDino alternative usually provides test reporting, analytics, or CI/CD visibility features that help teams understand test results, debug failures, and manage automation at different levels of scale or complexity.
Teams usually explore alternatives when they require broader framework support, deeper infrastructure observability, or a different balance between reporting simplicity and advanced analytics.
TestDino currently works with Playwright test suites only, focusing on providing detailed reporting and CI integration for Playwright-based automation.
Unlike general observability platforms, TestDino is purpose-built for test reporting and debugging, focusing on failure analysis, flaky test detection, and CI optimization rather than logs and infrastructure metrics.
Yes, TestDino scales well for mid-size and enterprise teams running large Playwright suites with frequent CI executions, especially where multiple developers and QA engineers share responsibility for test failures.

Pratik Patel
Co-founder