Top 5 Playwright Test Management Tools
Discover the top 5 Playwright test management tools that help teams organize tests, track results, and scale QA with confidence.
Running Playwright tests can be tricky when it’s unclear which scenarios passed, which failed, or how results tie back to requirements and releases. As teams scale automated testing in CI/CD pipelines, keeping track of coverage and outcomes becomes increasingly complex.
Test management tools for playwright help both QA and development teams organize test suites, centralize results, and gain clear insights into test coverage and failures. They provide visibility across the entire testing lifecycle, making it easier to plan and prioritize fixes.
In Agile and DevOps workflows, these tools act as a central hub for Playwright automation. They integrate with CI/CD pipelines, reporting systems, defect trackers, and collaboration platforms to streamline testing and feedback loops.
In this guide, we’ll review the top 5 Playwright test management tools, compare their key features, and help you choose the right solution to improve efficiency, reliability, and confidence in your releases.
What are test management tools?
Test management tools are software platforms that help QA and development teams organize, execute, and track automated tests in a single, centralized system. They provide structure for managing Playwright test suites and replace spreadsheets or manual tracking with real-time visibility and automation support.
These tools give teams clear insight into test results, coverage, and quality, helping both QA and developers prioritize fixes and make informed decisions. By connecting test cases with CI/CD pipelines, defect tracking, and reporting dashboards, they improve collaboration, streamline workflows, and increase confidence in releases.
What Playwright test management software does
Playwright test management tools provide a complete set of features to help teams streamline automated testing and gain full visibility into their QA and development workflows. They centralize test cases, track results, and integrate with other tools to make testing more efficient and reliable.
These tools enable teams to:
- Centralize and maintain Playwright test cases and suites
- Plan and execute test runs efficiently
- Track test results, including passes, failures, and flaky tests
- Integrate with bug trackers like Jira and GitHub
- Collect automated test results directly from CI/CD pipelines
- Generate dashboards and reports for testing progress and coverage
Why Playwright teams need a test management tool
Playwright handles multi-browser testing, auto-waits, and parallel execution out of the box. It is the fastest-growing browser automation framework for good reason. But Playwright was built to run tests, not to manage them.
Once a test suite grows more than ~100 tests Playwright does not track which tests are flaky over the time. It does not connect test failures to specific pull requests.
It does not calculate how much CI time your test suite wastes. And it does not give your QA lead a clear picture of test coverage across sprints.
A test management tool designed specifically for Playwright fills these gaps by sitting on top of your existing Playwright setup, ingesting test results, and adding the intelligence layer that Playwright alone does not provide.
Teams that run 100+ Playwright tests without a dedicated tool tend to hit the same problems:
- Flaky tests erode trust. Developers start ignoring failures because "that test is always flaky." Real bugs slip through unnoticed.
- CI pipelines slow down. There is no visibility into which tests are slow, redundant, or need a different parallelization strategy.
- Manual triage burns hours. Engineers spend 30 to 60 minutes per day investigating failures that turn out to be infrastructure issues, not actual bugs.
- No link between tests and requirements. PMs ask "is feature X tested?" and nobody can give a quick answer.
- Reporting is an afterthought. Test results sit in CI logs. Getting a sprint review summary means exporting CSVs and building slides by hand.
The evolution of test management: From spreadsheets to AI-Native
The evolution of test management explains why many tools do not work well with modern Playwright workflows. Each phase fixed earlier problems but introduced new ones.
Phase 1: Spreadsheet
Early test management relied on Excel or Google Sheets. Teams tracked test names, steps, expected results, and pass or fail status. This worked for small teams with limited test coverage.
The limitations were clear. There was no version control, no CI integration, and no automated execution tracking. Updates were manual and error-prone. Spreadsheets only recorded past results and required humans to decide what to do next.
Phase 2: Cloud test management tools (2010–2022)
Cloud tools like TestRail, Zephyr, qTest, and PractiTest replaced spreadsheets with web interfaces. They added folders, dashboards, and APIs, but kept the same manual workflow.
Test cases had to be written, updated, and maintained by hand. In fast-moving agile teams, this quickly broke down. Playwright test code stayed accurate in Git, while test case records became outdated.
This created two sources of truth. The management tool stopped reflecting real coverage and lost trust.
Both Phase 1 and Phase 2 tools were reactive. They showed what already happened and waited for humans to respond.
Phase 3: AI-Native test management (2023–Present)
Phase 3 changes the model completely. AI-native Playwright test management platforms like TestDino treat Playwright test code as the single source of truth and apply intelligence on top of it.
TestDino does not wait for failures to pile up. It automatically classifies test failures, detects flaky tests across CI runs, and identifies coverage gaps before they become production risks. It also highlights weak assertions, slow tests, and CI bottlenecks.
Instead of just reporting results, TestDino recommends specific actions. Engineers know what to fix, where to add tests, and how to improve pipeline performance.
TestDino integrates directly into developer workflows through MCP integrations with Claude Code, Cursor, and GitHub Copilot. Test insights appear inside the IDE, without switching tools.
This shift turns test management from record-keeping into proactive guidance that improves code quality.
Top 5 Playwright test management tools
1. TestDino
TestDino is a Playwright-focused reporting and test visibility platform designed to support teams at different levels of CI maturity. It offers two reporting approaches,
- Native JSON/HTML upload = simple, post-run reporting with minimal change
- TestDino custom reporting = richer metadata + real-time updates + CI controls for teams operating at scale
allowing teams to start simple and adopt more advanced capabilities as their CI usage grows.
How test case management works in TestDino:
The Test Case Management tab in TestDino is a standalone workspace where teams can create, organize, and maintain all their manual and automated test cases within the project.
It acts as the foundation for structuring test coverage, grouping test cases under suites and subsuites, and managing classification, automation status, and metadata.
The layout prioritizes clarity and speed: a sidebar for suite hierarchy, a top bar for key actions, and a main panel for test cases in grid or list form.
Workspace overview
KPI tiles
At the top of the Test Case Management tab, four KPI tiles summarize the state of all test cases in the workspace:
- Total: The total number of test cases in the project
- Active: Test cases marked as Active and ready for use
- Draft: Test cases in a draft state, not yet finalized
Deprecated: Retired or outdated test cases kept for reference

These metrics update dynamically as test cases are added, deleted, or reclassified.
Views
The Test Cases page shows all test suites listed in a collapsible hierarchy. Clicking a suite expands it to show its test cases, and if that suite contains subsuites, those appear as nested sections as well.
You can switch between two ways to view all test cases: List View and Grid View.
- List view (Table layout)
A high-density table format, ideal for bulk operations and scanning. It includes columns for:
- Key
- Title & Priority
- Type
- Tags
- Status
- Automation
- Severity
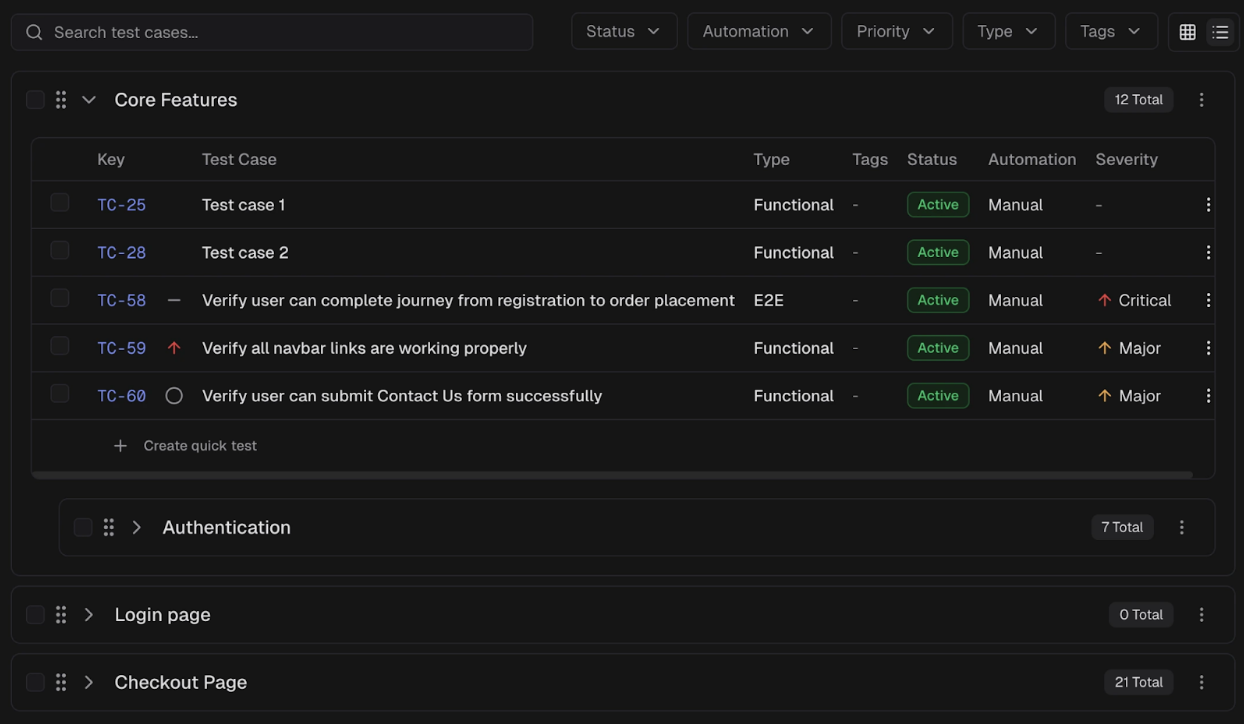
Use checkboxes for bulk selection or the action menu on each test case row for individual actions.
- Grid view (Card layout)
A visual, card-based layout. Each card shows:
- Key
- Title
- Priority
- Severity
- Status
- Automation
- Tags
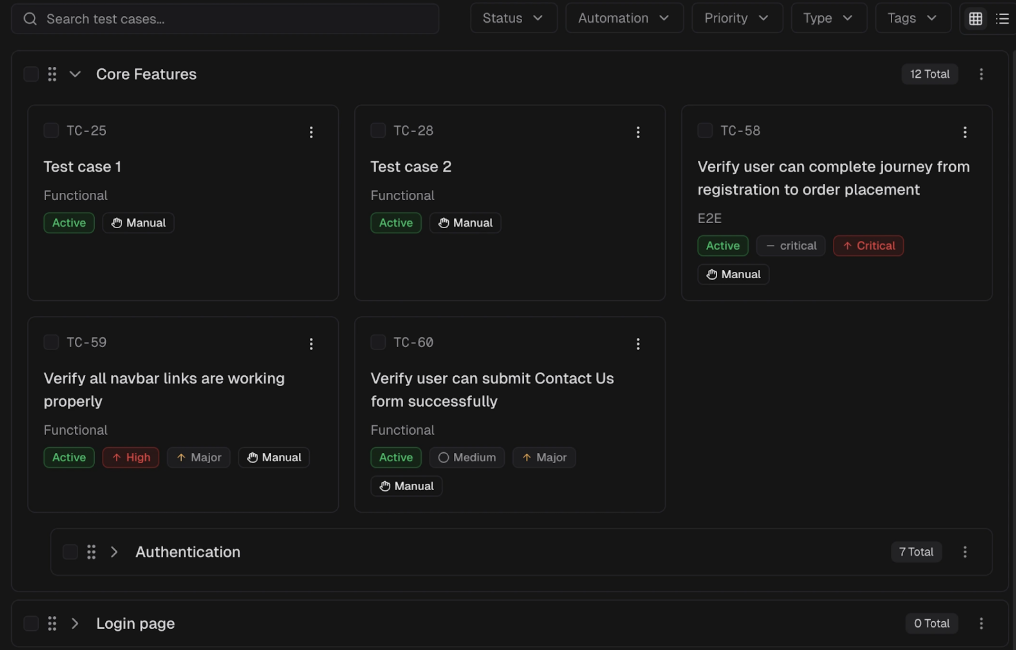
Search functionality
You can search by test case name (Title) or by its Key (ID) (for example: TC-6297). The list filters in real time as you type.
Available filters
Five filter dropdowns allow you to refine visible test cases:
- Status: Active, Draft, Deprecated
- Automation: Manual, Automated
- Priority: High, Medium, Low, Not Set
- Type: Functional, Smoke, and more
- Tags: One or more user-defined labels
Quick start steps
1. Open the test cases tab
Go to your project and select Test Cases from the navigation bar. This opens the Test Case Management workspace.
2. Create your first suite
In the Suite Sidebar, click the New Suite button to create a new suite or subsuite. Use suites to group related test cases under feature, module, or component names.
3. Add test cases
Use the New Test Case button in the toolbar to open the full creation form. You can also add test cases directly within a suite or from the suite's context menu.
Fill in Title, Priority, Status, and Tags. Add test steps or link to automated spec files. Save and organize into suites.
Key features
- Manual + automated test case management: manage test documentation and automation together.
- Historical run insights: compare test history across branches, environments, and releases.
- AI-powered failure insights: automatically analyzes logs, traces, and history to explain why tests failed.
- CI-first optimization: rerun only failed tests and reduce pipeline time + cost.
- Evidence-rich failure views: screenshots, videos, traces, logs, and steps all in one screen.
- PR + CI workflow automation: automatic PR comments, commit status updates, and base-branch comparisons.
- Role-based dashboards: tailored views for QA, developers, and managers with the right context.
- Flaky test detection: identifies unstable tests over time instead of marking everything as "failed.”
- Cross-environment insights: detect differences between staging, QA, and production behavior.
- Secure access & RBAC controls: granular permissions, time-limited sharing, audit logs, and secure storage.
- Adaptive failure classification: learns from project patterns and labels tests as UI change, bug, or unstable.
- Integrations: Slack, Jira, Linear, Asana, GitHub, CI tools, email, and bi-directional issue sync.
- Advanced analytics dashboards: visualize trends, performance, retry behavior, and failure hotspots.
Best use case
- Deals with flaky tests and unreliable results across CI environments
- Needs GitHub/CI automation (PR comments, commit statuses, workflow triggers)
- Prefers evidence-rich reports (screenshots, videos, traces, logs) in one place
- Wants deep integrations with Jira, Slack, Linear, Asana, and GitHub.
- Wants role-based dashboards for QA, developers, and managers
- Needs historical insights across branches, PRs, and environments
- Wants to rerun only failed tests instead of re-running everything
- Needs AI-driven insights to understand why tests fail, not just that they failed
- Runs large Playwright suites, and debugging failures slows releases
Pros
- Flaky test detection and history make CI more stable and predictable.
- CI-first workflows enable PR comments, reruns, and automation easily.
- Role-based dashboards give each team member the right level of detail.
- AI insights help teams debug faster by explaining real failure causes.
- Reports show traces, screenshots, videos, logs, and steps together.
Cons
- It is most useful for teams that already run tests in CI
- AI gets smarter over time as more test runs are collected
- Some teams may need a short walkthrough before they feel comfortable.
- Right now, it mainly works with Playwright, and other frameworks may come later.
Pricing
| Starter | Pro Plan | Team Plan | Enterprise |
|---|---|---|---|
| Free | $49 / month Billed monthly |
$99 / month Billed monthly |
Custom Pricing |
Ideal team size
TestDino works well for teams of almost any size, but the value grows as your Playwright tests and CI pipelines scale.
It is an especially good fit when:
- A team has 50+ automated tests, and debugging starts slowing people down
- CI runs happen on every commit or pull request
- Multiple developers or QA members share responsibility for failures
- Flaky tests are becoming harder to track manually
Best for
- startups growing their automation
- mid-size teams building serious CI pipelines
- enterprise teams managing large test suites across branches and environments
If you want to take a quick look without any setup, you can also check out our sandbox environment to see how it works in practice.
2. Xray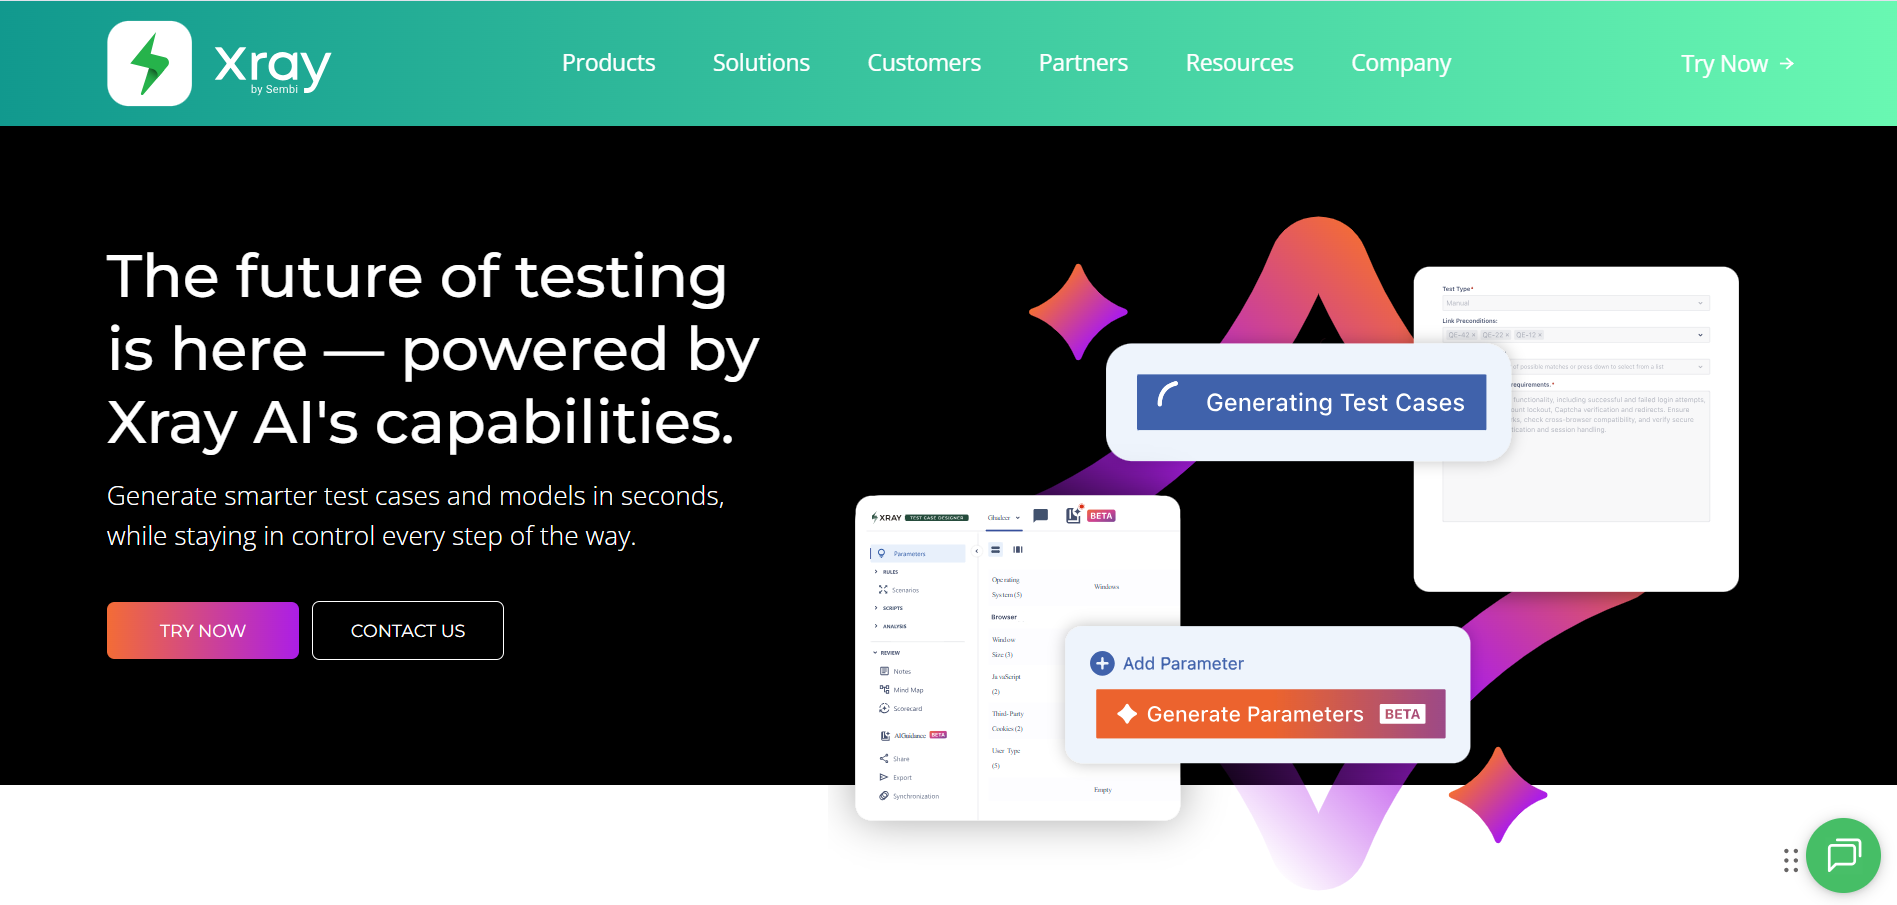
Overview
Xray is one of the most established test management tools in the Atlassian ecosystem. It integrates directly into Jira as a native add-on, which means test cases, test plans, and test executions live alongside your Jira issues.
How Playwright integration works
Xray does not offer a native Playwright reporter.
Instead, Playwright test results are:
- Exported to JUnit XML format (supported natively by Playwright)
- Uploaded to Xray using its REST API or CI plugin
Playwright configuration example:
export default defineConfig({
  reporter: [
    ['junit', { outputFile: 'results/junit-report.xml' }]
  ],
});
CI upload step:
curl -X POST \
  "https://xray.cloud.getxray.app/api/v2/import/execution/junit" \
  -H "Authorization: Bearer $XRAY_TOKEN" \
  -F "file=@results/junit-report.xml"
</code.
Key features
Xray’s strength is traceability and compliance, especially in Jira-centric organizations.
It provides:
- Native linking between requirements, test cases, executions, and defects
- Test executions represented as Jira issues
- Structured test plans and test cycles
- Environment tracking for browser and OS combinations
- Coverage reports showing which requirements are tested and passing
Limitations
Xray is not optimized for code-first, modern Playwright workflows.
Key limitations include:
- No AI-powered failure analysis: Failures show raw JUnit errors only. No flaky detection or root cause insights.
- No native Playwright data: Traces, screenshots, videos, and step-level details are lost.
- Setup complexity: Requires JUnit setup, API tokens, CI scripts, and test key mapping. Initial setup typically takes 30 to 60 minutes.
- Manual test case model: Built around manually written test steps. Playwright tests in code do not map cleanly, creating extra maintenance work.
- No proactive insights: No detection of coverage gaps, weak assertions, or slow tests.
- No MCP or AI assistant integrations: Engineers must rely on Jira or APIs instead of IDE-native workflows.
Pros
- Deep Jira integration
- Strong requirement-to-test-to-defect traceability
- Mature, enterprise-ready product
- Supports manual, automated, and BDD testing
Cons
- No native Playwright reporter
- Loss of Playwright-specific debugging data
- No AI-driven insights or flaky test detection
- Manual test case model adds overhead for code-first teams
- Complex setup and configuration
- No MCP server support
Best for
Agile and DevOps teams using Jira who want full traceability between requirements, test cases, automation, and defects.
Pricing
Atlassian Marketplace pricing (per user); enterprise options available.
Ideal for
Jira-native Agile teams and organizations using BDD.
3. Zephyr
Overview
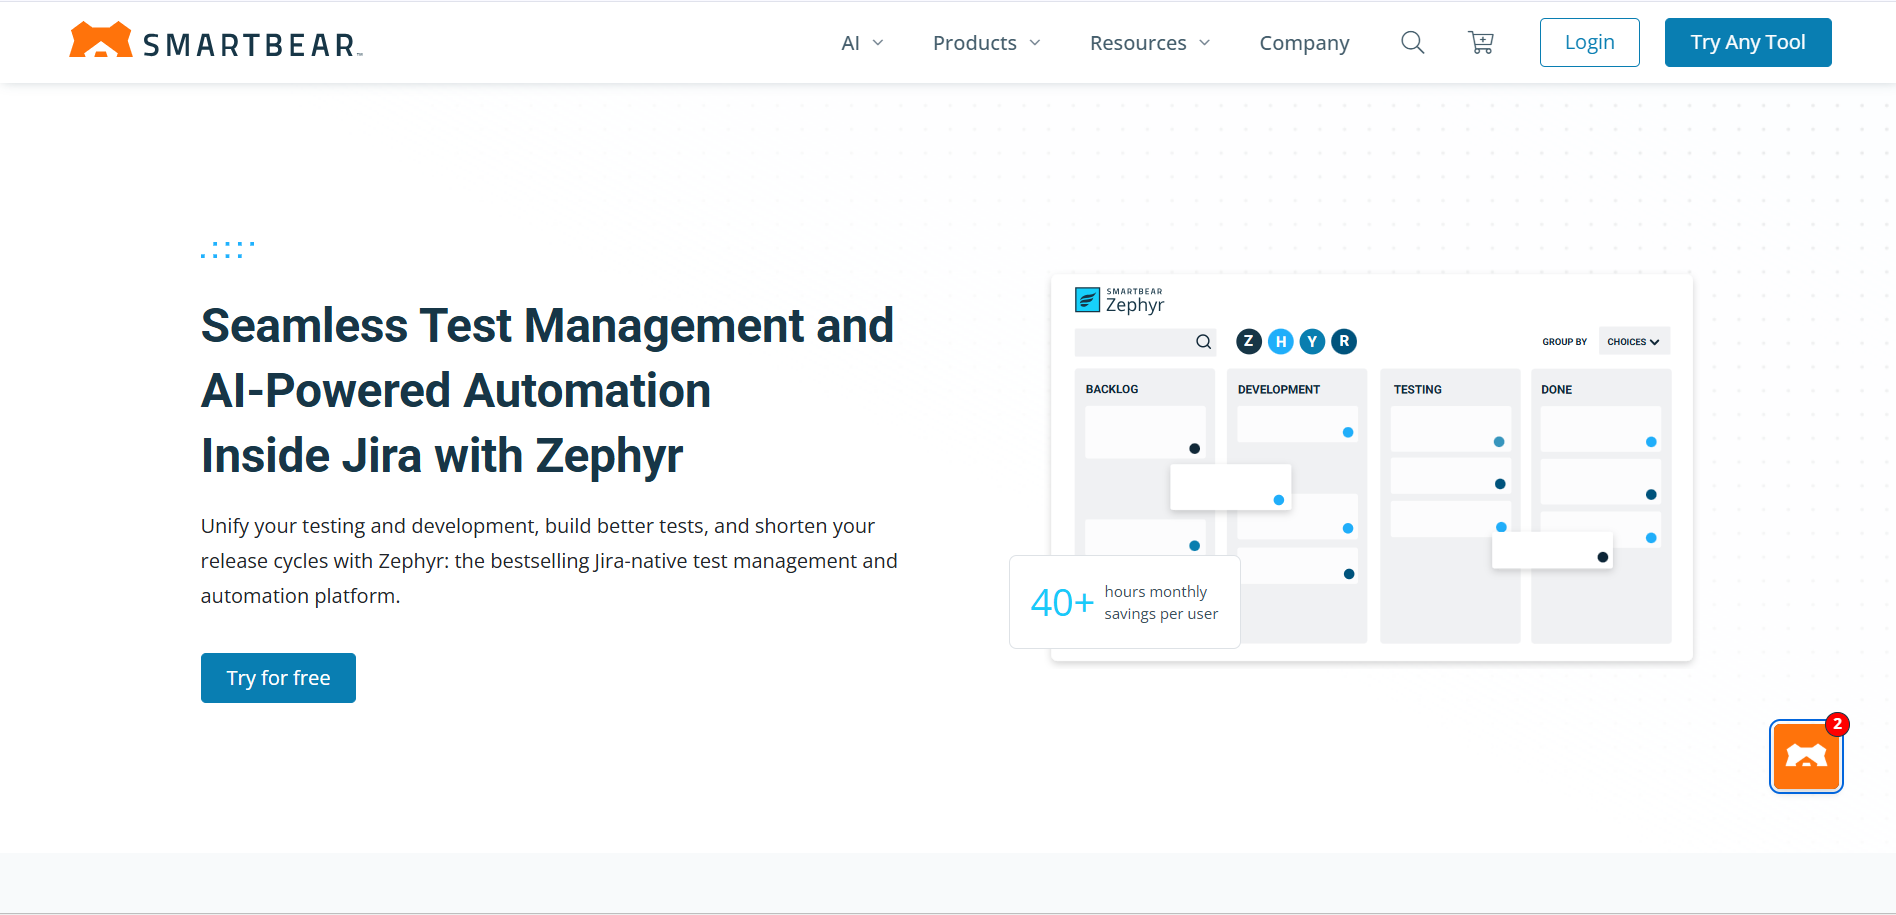
Zephyr is a family of test management solutions (including Zephyr Squad/Scale/Enterprise) known for deep Jira integration and enterprise capabilities for test planning and execution.
How Playwright Integration Works
Zephyr Scale integrates with Playwright using JUnit XML, similar to Xray.
The flow is simple:
- Configure Playwright to output JUnit XML
- Generate results during CI runs
- Upload the XML using Zephyr Scale’s REST API
CI upload example:
curl -X POST \
  "https://api.zephyrscale.smartbear.com/v2/automations/executions/junit" \
  -H "Authorization: Bearer $ZEPHYR_TOKEN" \
  -F "file=@results/junit-report.xml" \
  -F "projectKey=PROJ"
Key features
Zephyr Scale stands out for its lower barrier to entry.
Key strengths include:
- Clean and easy-to-use UI
- Faster setup compared to Xray
- Simple test cycles grouped by sprint, release, or environment
- Clear pass or fail charts and execution progress tracking
- Suitable for teams mixing manual and automated tests
Limitations
Zephyr Scale is limited when used with large or automation-heavy Playwright suites.
Main gaps include:
- No native Playwright data: Same JUnit XML limitations as Xray.
- No AI capabilities: No failure classification, flaky test detection, or intelligent triage.
- No proactive insights: Does not analyze coverage gaps, assertion quality, or performance issues.
- Limited automation intelligence: No CI cost analysis, retry insights, or parallelization recommendations.
- Folder-based organization: Test cases live in folders, which do not align with Playwright’s file and describe block structure.
- No MCP or AI assistant integrations
Pros
- Easy to adopt for Jira teams
- Clean UI with simple dashboards
- Works well for mixed manual and automated testing
- Lower cost than Xray for smaller teams
Cons
- No native Playwright reporter
- Loss of Playwright-specific debugging data
- No AI-powered insights or flaky test detection
- Limited automation-focused reporting
- Test organization does not match Playwright code structure
- No MCP server support
Best for
Teams working inside Jira that want to manage test cases, test execution, and traceability directly within their Atlassian ecosystem.
Pricing
Marketplace pricing (per user) for Jira plugins; enterprise pricing for Scale/Enterprise editions.
Ideal for
Organizations with Jira-centric development processes.
4. qTest
Overview
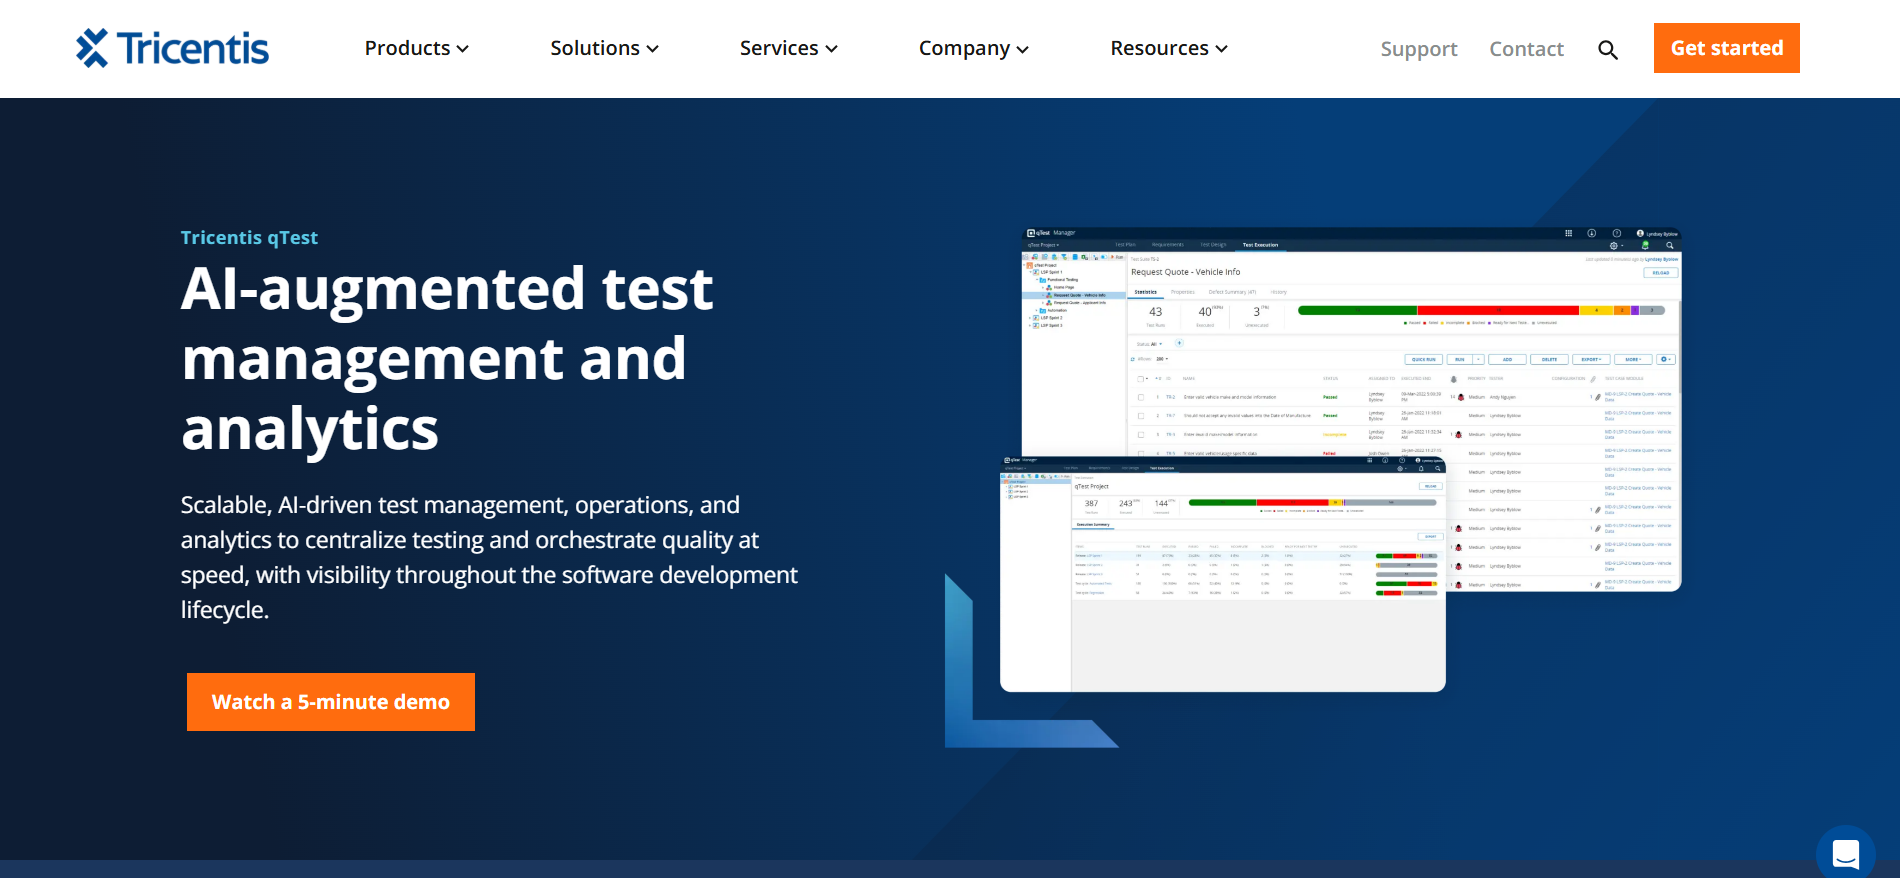
Test (now part of Tricentis) is an enterprise test management platform designed for large QA organizations with strong needs for automation integration, scalability, and DevOps alignment.
How Playwright integration works
qTest does not offer a native Playwright reporter.
Integration options include:
- Importing Playwright results via JUnit or TestNG XML
- Using qTest Launch to connect CI/CD tools such as Jenkins, GitHub Actions, or GitLab CI
qTest Launch can trigger Playwright test runs and pull results into qTest Manager. Setup requires configuring agents, mapping projects, and connecting CI pipelines through the qTest UI.
Key features
qTest’s strength is enterprise-scale governance.
Key capabilities include:
- Centralized test management across many teams
- Role-based access control and audit trails
- Cross-project analytics through qTest Insights
- Workflow automation with qTest Pulse, such as auto-creating Jira issues on failures
- Broad integrations across enterprise testing and DevOps tools
This works well in regulated environments with large QA organizations.
Limitations
qTest is not optimized for modern, developer-first Playwright workflows.
Main limitations:
- No native Playwright support: XML-based imports only.
- No AI capabilities: No failure classification, flaky test detection, or intelligent triage.
- No proactive insights: Does not analyze coverage gaps, assertion quality, or CI performance.
- Heavy setup and onboarding: Initial setup typically takes 2 to 4 hours or more.
- Enterprise pricing: Custom contracts and higher costs make it unsuitable for small or mid-size teams.
- Developer experience is secondary: Designed for QA professionals, not engineers working inside IDEs.
- No MCP or AI assistant integrations
Pros
- Enterprise-grade scalability and security
- Strong governance and compliance controls
- Deep workflow automation capabilities
- Part of the broader Tricentis testing ecosystem
Cons
- No native Playwright reporter
- Loss of Playwright-specific debugging data
- No AI-powered insights or flaky test intelligence
- Complex setup and long onboarding
- Expensive enterprise pricing model
- No IDE, PR, or MCP server integration
Best for
Large enterprises running complex automation pipelines and needing centralized QA governance and advanced analytics.
Pricing
Enterprise licensing / quote-based; contact Tricentis for details.
Ideal for
Enterprises and large engineering organizations.
5. PractiTest

Overview
PractiTest is a standalone test management platform that is not tied to Jira or any specific project management tool. It supports manual, automated, and exploratory testing and is often used by QA teams managing multiple projects and methodologies.
How Playwright integration works
PractiTest does not have a native Playwright reporter.
Integration is done by:
- Generating test results from Playwright using JUnit XML or JSON reporters
- Uploading those results via PractiTest’s REST API or custom scripts
- Optionally using the PractiTest Firecracker agent to pull results from CI/CD pipelines
This setup requires mapping Playwright tests to PractiTest entities and maintaining that mapping over time.
Key features
PractiTest’s biggest strength is reporting flexibility.
Key advantages include:
- Highly customizable dashboards
- Reports tailored for engineers, QA leads, PMs, and executives
- Ability to combine manual and automated test data
- Flexible test libraries with custom fields, tags, and filters
- Strong support for managing tests across multiple projects and environments
This works well for organizations that need broad visibility across teams.
Limitations
PractiTest is less suited for modern, automation-first Playwright teams.
Main limitations:
- No native Playwright integration: Requires API-based imports or Firecracker setup. Initial configuration typically takes 1 to 2 hours.
- No AI capabilities: No failure classification, flaky test detection, or CI cost analysis.
- No proactive insights: Does not surface coverage gaps, weak assertions, or performance issues.
- Manual-first design: Automation feels bolted onto a platform designed primarily for manual QA.
- Separate from developer workflow: No IDE integration, PR comments, or MCP server support.
- No Playwright-specific artifacts: Traces, videos, and browser context data are not available inside the tool.
Pros
- Standalone platform independent of Jira or other PM tools
- Supports manual, automated, and exploratory testing
- Strong reporting and dashboard customization
- Suitable for cross-project test management
Cons
- No native Playwright reporter
- API-based setup requires significant configuration
- No AI-powered insights or flaky test intelligence
- Manual QA-first workflow adds friction for automation teams
- No IDE, PR, or MCP server integration
Best for
QA teams that need strong visibility, analytics, and traceability across multiple projects and test types.
Pricing
Subscription SaaS (tiered); free trial available.
Ideal for
Mid-size and enterprise QA teams that value reporting and traceability.
Feature-by-Feature comparison:
| Feature | TestDino | Xray (Jira) | Zephyr Scale | PractiTest | qTest |
|---|---|---|---|---|---|
| Playwright Reporter | Native npm package | JUnit XML import | JUnit XML import | API-based import | API-based import |
| Setup Time | ~5 min | 30–60 min | 20–40 min | 1–2 hours | 2–4 hours |
| AI Failure Classification | Built-in (AI-native) | Not available | Not available | Not available | Not available |
| Flaky Test Intelligence | Automatic detection + trends | Manual tagging | Manual tagging | Manual tagging | Manual tagging |
| MCP Server Support | Yes (Claude Code, Cursor, Copilot) | No | No | No | No |
| Proactive Suggestions | Coverage gaps, assertions, performance | No | No | No | No |
| CI/CD Cost Attribution | Built-in | Not available | Not available | Not available | Limited |
| PR-Level Reporting | GitHub/GitLab comments | Jira links | Jira links | Webhook-based | Webhook-based |
| Best For | AI-first Playwright teams | Atlassian enterprises | Jira-native teams | Multi-methodology QA | Large enterprises |
| Pricing Model | Free tier + usage-based | Per-user/month | Per-user/month | Per-user/month | Custom enterprise |
| Ideal Team Size | 2–100 engineers | 20–500+ | 10–200 | 10–300 | 100–1000+ |
How to evaluate a test management Playwright tool
Before committing to a tool, run this simple evaluation framework against your shortlist. It focuses on real-world usability for Playwright-first teams.
Step 1: The 15-minute test
Install the tool’s Playwright reporter or integration and run your existing test suite.
What to look for:
- Can you see meaningful results in a dashboard within 15 minutes?
- Are tests automatically detected without manual mapping?
If setup takes longer, the tool likely introduces too much friction for day-to-day development.
Step 2: Verify what data gets captured
Force a test failure and open it in the tool.
Check whether you can see:
- Playwright traces
- Screenshots or videos
- Step-by-step execution details
If the tool only shows pass or fail status and a generic error message, it is not capturing Playwright-specific data.
Step 3: Test flaky detection
If you have known flaky tests, run the same suite multiple times.
Evaluate whether the tool:
- Automatically identifies flaky tests
- Shows flake rates or trends over time
- Differentiates between real failures and instability
Tools that only show pass or fail results without history offer limited value at scale.
Step 4: Look for proactive suggestions
Assess whether the tool goes beyond reporting.
Strong tools can:
- Highlight gaps in test coverage
- Flag weak or ineffective assertions
- Recommend CI or parallelization improvements
Reactive tools show what happened. Proactive tools help you decide what to fix next.
Step 5: Evaluate the developer workflow
Ask engineers to use the tool during a real sprint.
Key questions:
- Do they need to leave their IDE to access test data?
- Can they see failure details directly in pull requests?
- Is failure triage assisted by AI classification?
Lower context switching usually leads to higher adoption.
Step 6: Check for AI and MCP support
Ask a simple question: “Can engineers interact with the tool from Claude Code, Cursor, or GitHub Copilot?”
If the answer is no, the tool was built for a dashboard-first world.
MCP server support is a strong indicator that the tool is designed for AI-native workflows and how engineers work today.
Before selecting a tool, do checks for these evaluations first, whether it truly fits a Playwright-first workflow and can scale with your team as your test suite grows.
Benefits of using Playwright test management tools
Playwright test management tools help QA and development teams create a structured, scalable, and reliable automated testing workflow. They make it easy to organize Playwright test suites, monitor execution in real time, and maintain consistent quality across fast-moving releases.
These tools integrate seamlessly with CI/CD pipelines, providing faster feedback and better visibility into automated test results. They also improve collaboration between QA, developers, and product stakeholders by centralizing test cases and execution history.
Advanced dashboards and reporting give teams actionable insights into test coverage, flakiness, and quality risks. By reducing redundant tests and highlighting potential issues early, test management tools on Playwright increase release confidence and help prevent defects from reaching production.
Challenges solved by Playwright test management tools
As teams adopt modern architectures, fast release cycles, and automated testing with Playwright, QA and development teams often struggle to maintain quality and visibility.
Playwright test management tools help create a unified view of test activities and results, addressing challenges such as:
- Playwright test cases are scattered across different scripts, repositories, or spreadsheets
- Limited visibility into test execution progress and test results
- Missing links between requirements, test scripts, and reported defects
- Manual reporting and tracking of test runs
- Poor insight into Playwright automation results and flakiness
- Delayed feedback in CI/CD pipelines and slower bug detection
- Inconsistent Playwright testing practices across teams and projects
Conclusion
Test management Playwright tools help QA and development teams manage growing automated test suites with clarity and consistency. They make it easier to organize Playwright tests, track execution results, and maintain quality across fast moving release cycles.
By adding visibility and structure to Playwright based testing workflows, these tools support better collaboration and faster feedback in Agile and DevOps environments. Teams gain clear insight into test coverage, failures, and overall test health.
Choosing the right Playwright test management tool depends on team size, CI/CD maturity, and reporting needs. The right solution enables faster releases, fewer production issues, and greater confidence in every Playwright driven deployment.
Table of content
Flaky tests killing your velocity?
TestDino auto-detects flakiness, categorizes root causes, tracks patterns over time.


