Top 10 Test Intelligence Platforms that are Changing Test Automation
Test intelligence sits between your test runner and your team. These 10 platforms turn raw CI failures into prioritized, actionable fixes in 2026


Test automation has gone from Selenium scripts to Playwright suites running across sharded CI pipelines on every commit.
Playwright solved most execution problems: multi-browser support, auto-waiting, trace files, and parallel runs out of the box. CI pipelines matured alongside these tools, and running your full suite on every commit became the default, not the exception.
Then AI changed the speed of test creation. AI tools now generate test code faster than teams can review it. But the reporting side hasn't kept up. Most teams still stare at pass/fail lists and manually triage failures.
Test intelligence platforms exist to fill that gap: classify failures, detect flaky tests, group errors by root cause, and tell you what actually needs fixing.
What it is not:
-
Not a test automation tool (it doesn't write or run tests)
-
Not a test management tool (it doesn't store manual test cases as its primary function)
-
Not a test runner (it doesn't execute anything)
-
Not a CI tool (it doesn't trigger builds or manage pipelines)
What it is:
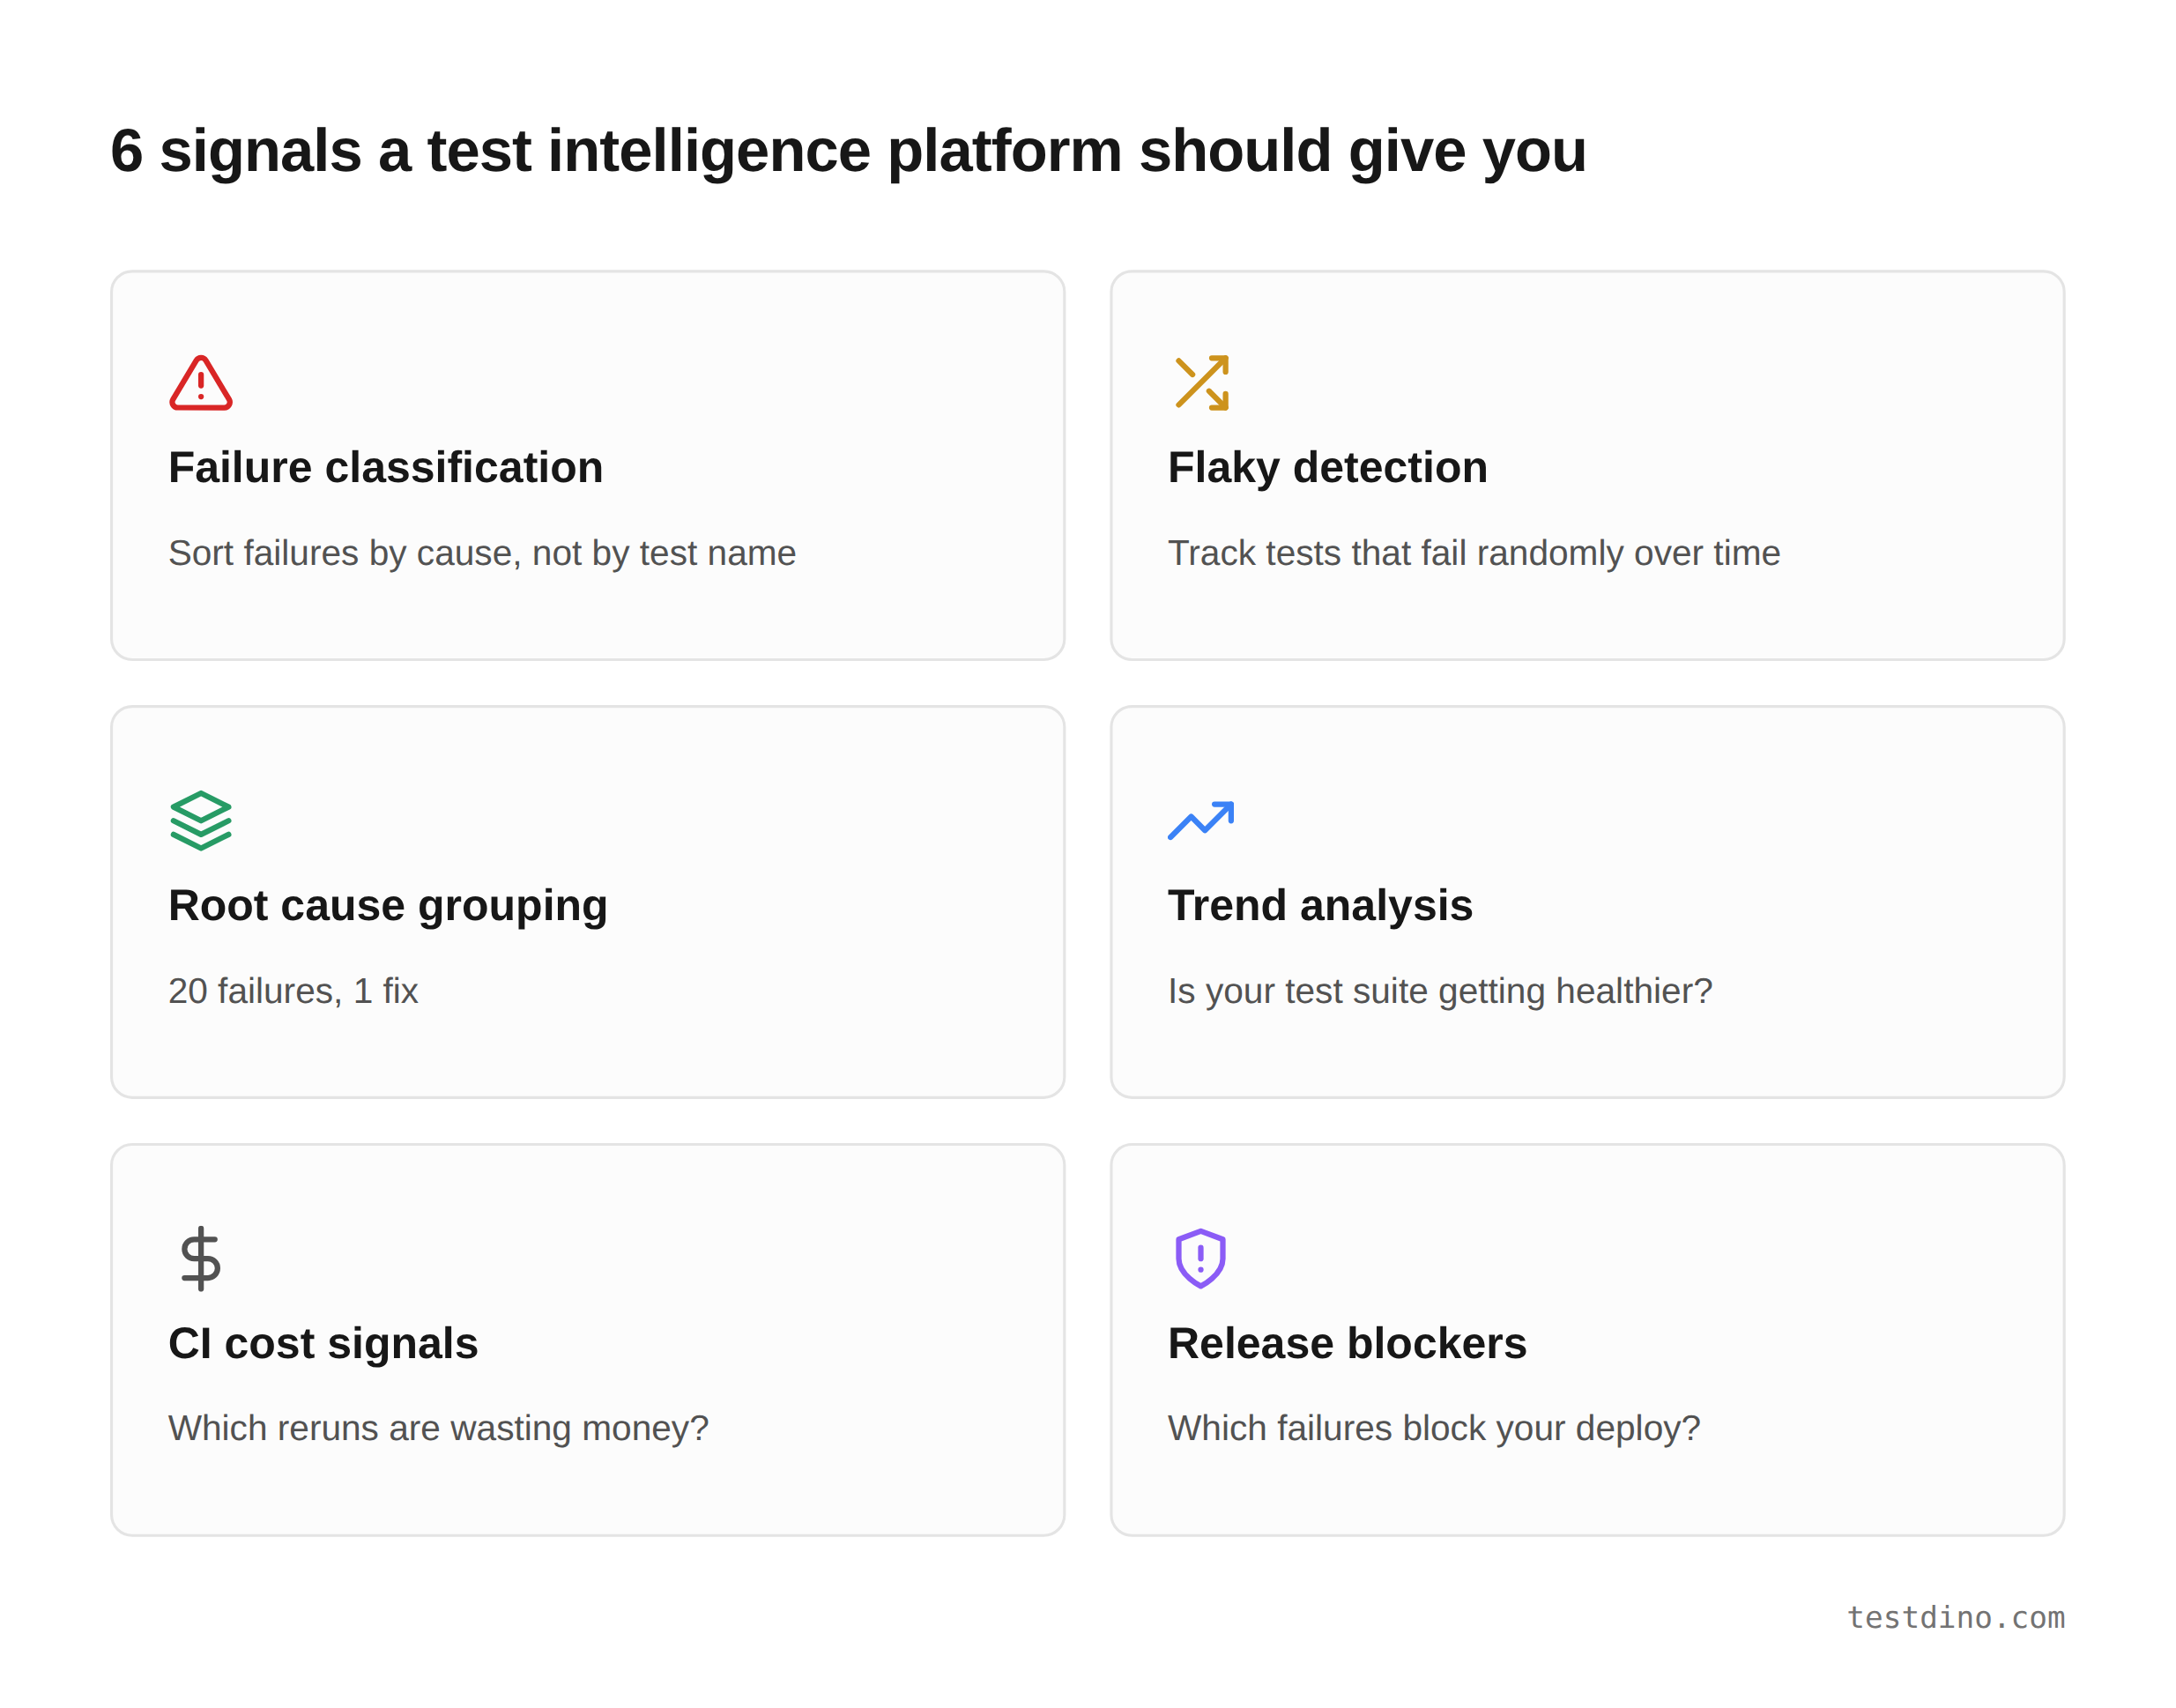
The analysis and insights layer takes raw pass/fail data from your CI runs and turns it into prioritized, actionable information. Failure classification. Flaky detection. Root cause grouping. Trend analysis. Release readiness signals.
If your CI pipeline runs hundreds of tests on every commit, a test intelligence platform helps you figure out which of those failures deserve your attention right now, and which ones you've seen 50 times before.
Here are the 6 core signals a test intelligence platform should give you:
We looked at each tool's ability to classify failures, detect flaky tests, integrate with CI systems, and provide insights from execution data.
Quick comparison
| Platform | Standalone layer? | Failure classification | Flaky detection | Playwright support | Pricing |
|---|---|---|---|---|---|
| TestDino |  |
AI, 4 categories |
|
Native (traces, shards) | Free / $49/mo |
| Applitools | (visual only) |
Visual diffs only |
 |
Via SDK | Free trial / contact sales |
| CloudBees Smart Tests | |
Pattern grouping |
|
Via CLI reporter | Free trial / contact sales |
| BuildButler | |
AI chat queries |
|
Via JUnit XML | Free / contact sales |
| Keysight Eggplant | |
Coverage heatmaps |
|
|
Contact sales |
| Virtuoso QA | |
Execution reports |
|
|
Contact sales |
| Functionize | |
Screenshot diffs |
|
|
Contact sales |
| ContextQA | |
Root cause analysis |
 |
Export only | Contact sales |
| Qyrus | |
Step-level reports |
|
|
Contact sales |
| Pcloudy (Performance Intelligence) | |
Device-level logs |
|
|
Starts at: $239/month |
"Standalone layer" means you can plug it into your existing test suite without adopting the platform's test execution.
The 10 test intelligence platforms worth evaluating
1. TestDino
$45
Best for
Playwright-first teams that need test reporting, test management, and CI/CD optimization in one platform.
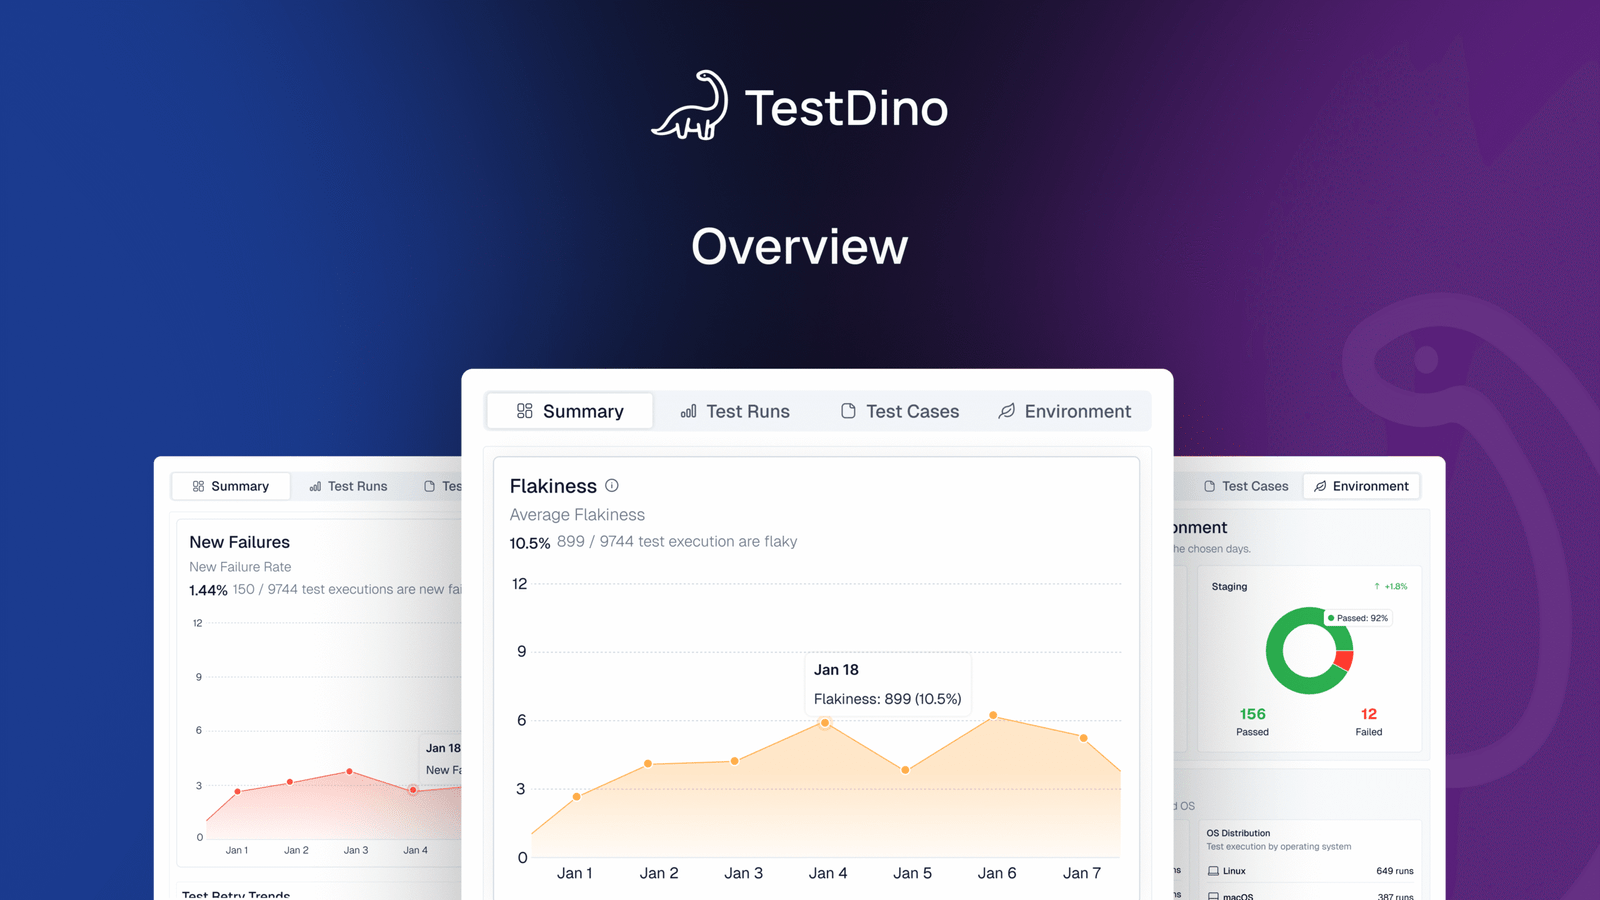
Overview
TestDino is a Playwright-native test intelligence platform that combines test reporting, test management, and CI observability in one place. It automatically groups test failures by root cause and gives your team AI-powered analysis, so you fix the issue once instead of triaging 20 identical CI failures.
Key capabilities:
-
AI failure classification into 4 categories
-
Error grouping by message and stack trace
-
Flaky detection with root cause labels
-
Test management with manual suites up to 6 levels
-
PR summaries on CI tools like GitHub, GitLab, etc.
-
Real-time results streaming via WebSocket
-
Smart reruns (failed tests only, shard-aware)
-
GitHub CI Checks as merge quality gates
-
MCP server for AI agent queries
-
Embedded trace viewer with DOM snapshots
-
Code coverage per file breakdown
-
1-click bug filing to Jira, Linear, Asana
-
Scheduled Playwright PDF reports in your email (daily, weekly, monthly)
Flaky test detection that classifies the root cause
Flaky test detection classifies unstable tests by cause: timing-related, environment-dependent, network-dependent, or assertion-intermittent. Each test gets a stability percentage. You can compare flaky rates across environments to spot infrastructure problems vs code problems.
Debugging that saves you from re-running locally
Each failed test comes with screenshots, video, browser console logs, and a trace viewer you can step through action by action. DOM snapshots, network request logs, and source context are all available right after the CI run finishes. No file downloads needed.
Error grouping, clusters failures by message and stack trace, reducing a long failure list to a short list of root causes. This is the part that saves the most triage time.
Bug filing is 1-click into Jira, Linear, Asana, or monday, pre-filled with error details, stack trace, failure history, and links to the run.
CI/CD speed and merge safety
Smart reruns re-execute only failed tests, not the full suite. Works across sharded runs and different CI runners. GitHub CI Checks adds quality gates to your PRs: set a minimum pass rate, mark critical tags as mandatory, and configure rules per environment. AI-generated summaries are posted to GitHub commits and GitLab merge requests.
MCP server for AI-assisted workflows
The MCP Server connects your AI assistant (Cursor, Claude Code, Copilot) to your test data. List test runs, pull debugging context, perform root cause analysis, and manage test cases through natural language. No other platform on this list offers this natively.
Pricing
| Community | Pro Plan | Team Plan | Enterprise |
|---|---|---|---|
| Free | $39 /month
(billed annually) |
$79 /month
(billed annually) |
Custom |
Limitations
Purpose-built for Playwright. Multi-framework support is on the roadmap.
Trusted by
OpenObserve (case study), Franklin (case study), Penpot, Monument, Speechify.
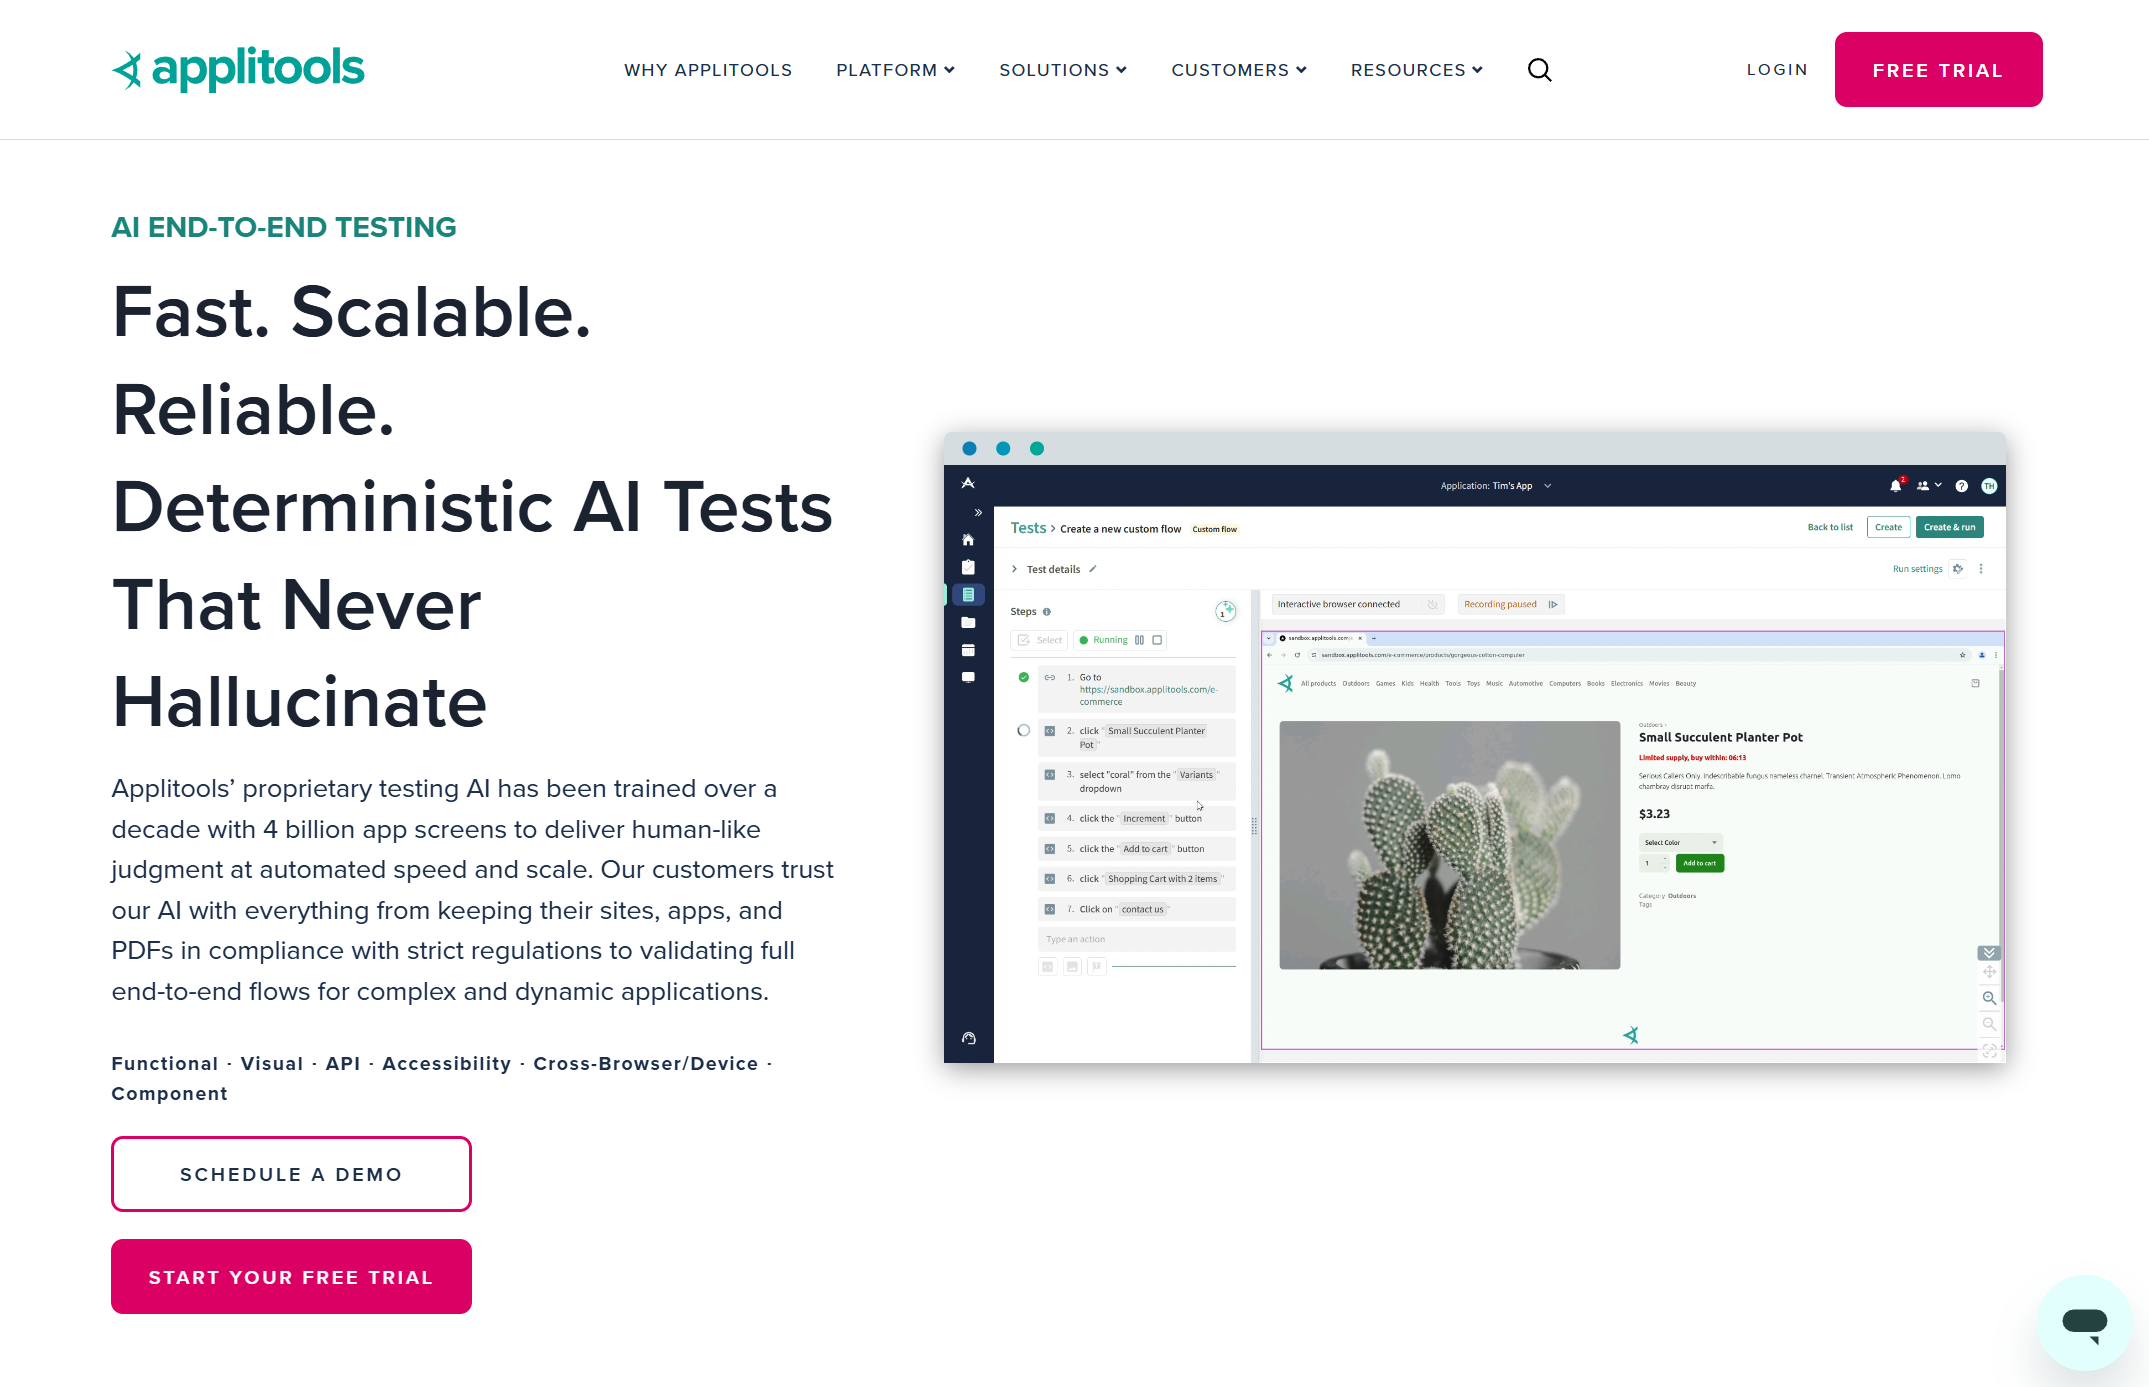
2. Applitools
Best for
Teams that need visual regression intelligence
Overview
Applitools uses Visual AI to detect UI regressions across browsers and devices. You add the Applitools Eyes SDK to your existing test scripts, wrap pages in visual checkpoints, and the platform compares each screenshot against a stored baseline. Its AI filters out noise like dynamic content and anti-aliasing differences, flagging only meaningful visual changes.
Key capabilities
-
Visual AI with smart diffing
-
Cross-browser baseline comparison
-
Root cause analysis for visual bugs
-
Works with Playwright, Selenium, and Cypress
The pain point it solves: Functional tests pass, but the UI is visually broken, buttons overlap, layout shifts on mobile, and CSS regression after a dependency update. Applitools catches what expect(locator).toBeVisible() never will.
Languages: Java, JavaScript, Python, Ruby, C#, PHP
Frameworks: Playwright, Selenium, Cypress, Appium, WebdriverIO
CI: Jenkins, GitLab, GitHub Actions, CircleCI
Pricing: Free tier with 100 checkpoints/month. Paid plans are contact-sales only.
Limitations: Focused on visual testing only, not functional failure analysis. No flaky test detection or failure classification for non-visual results. Paid pricing is not publicly listed.
Verdict: Strong pick if visual regression is your primary pain. Not useful for functional failure triage.
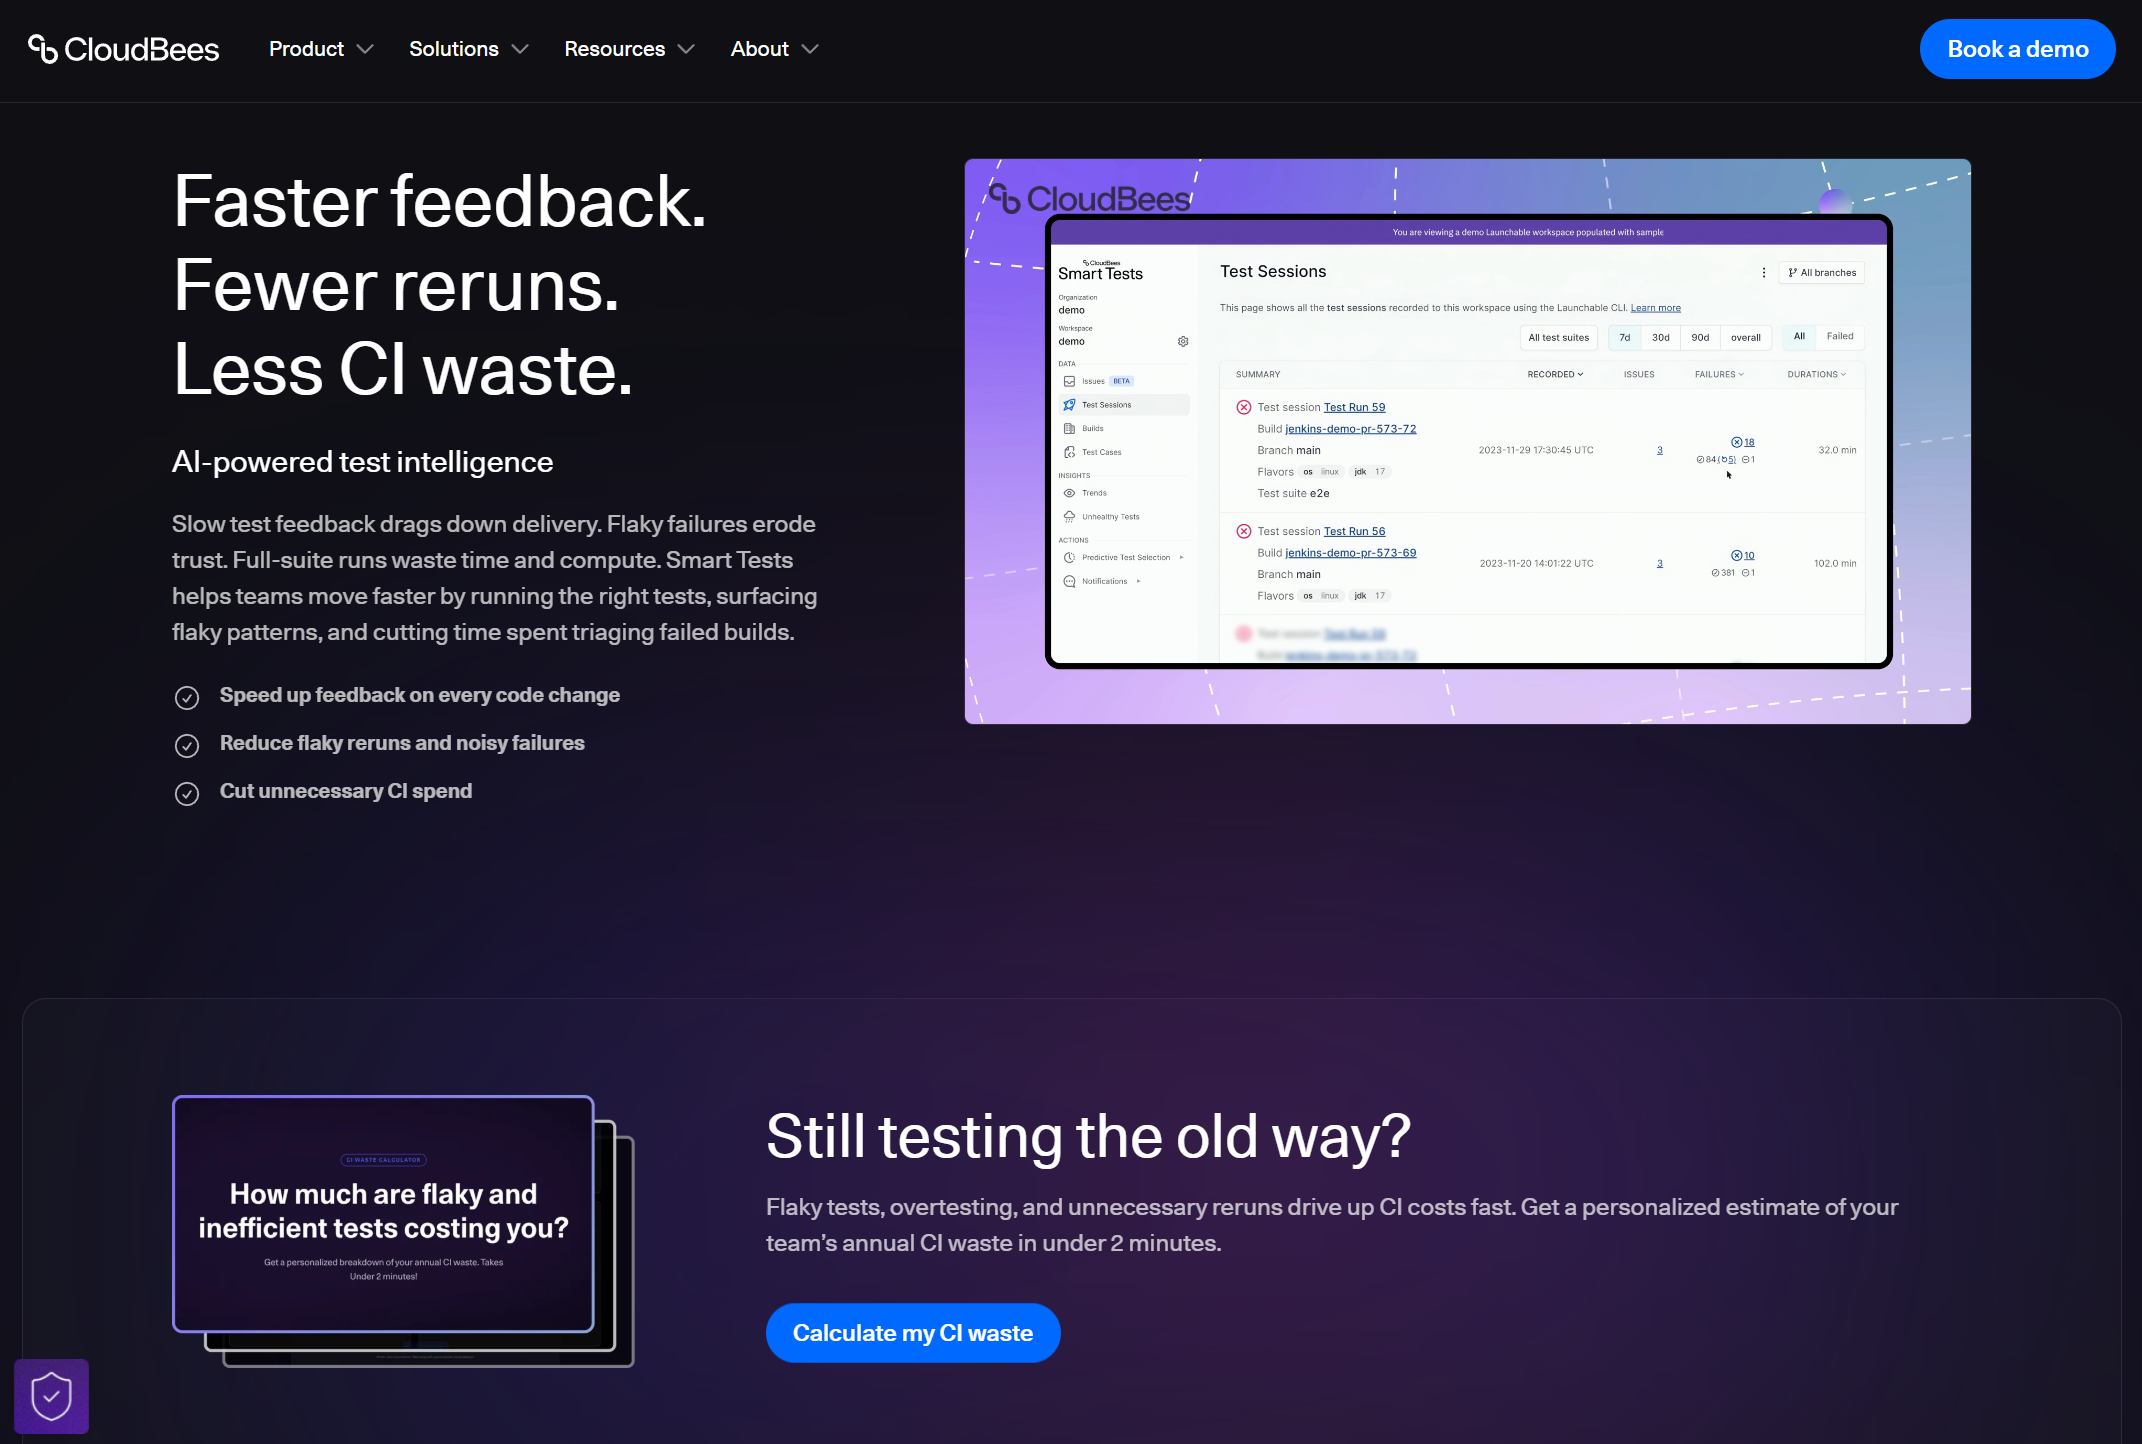
3. CloudBees Smart Tests (formerly Launchable)
Best for
Large CI pipelines with slow test feedback loops
Overview
CloudBees Smart Tests uses ML-based predictive test selection to run only the tests relevant to each code change. It also groups failures by root cause and identifies flaky and long-running tests.
Key capabilities
-
Predictive test selection via ML
-
Failure pattern grouping
-
Flaky test identification
-
CI-agnostic (Jenkins, GitHub Actions, GitLab)
The pain point it solves: Your test suite takes 45 minutes on every push. Most of those tests are irrelevant to the code you just changed. Smart Tests cuts that to the subset that matters.
Languages: Python, Java, Ruby, Go, JavaScript (framework-agnostic via CLI)
Frameworks: pytest, JUnit, RSpec, Go test, Playwright, Cypress, Selenium (via CLI)
CI: Jenkins, GitHub Actions, GitLab CI, CircleCI, Azure DevOps
Pricing: Free tier available. Paid plans require contacting sales.
Limitations: Part of the larger CloudBees ecosystem, which adds procurement overhead. Does not parse Playwright trace files or provide embedded trace viewing. Stronger on test selection than post-execution debugging.
Verdict: The closest to a pure test intelligence play on this list after TestDino. But the CloudBees ecosystem can be heavy for smaller teams.
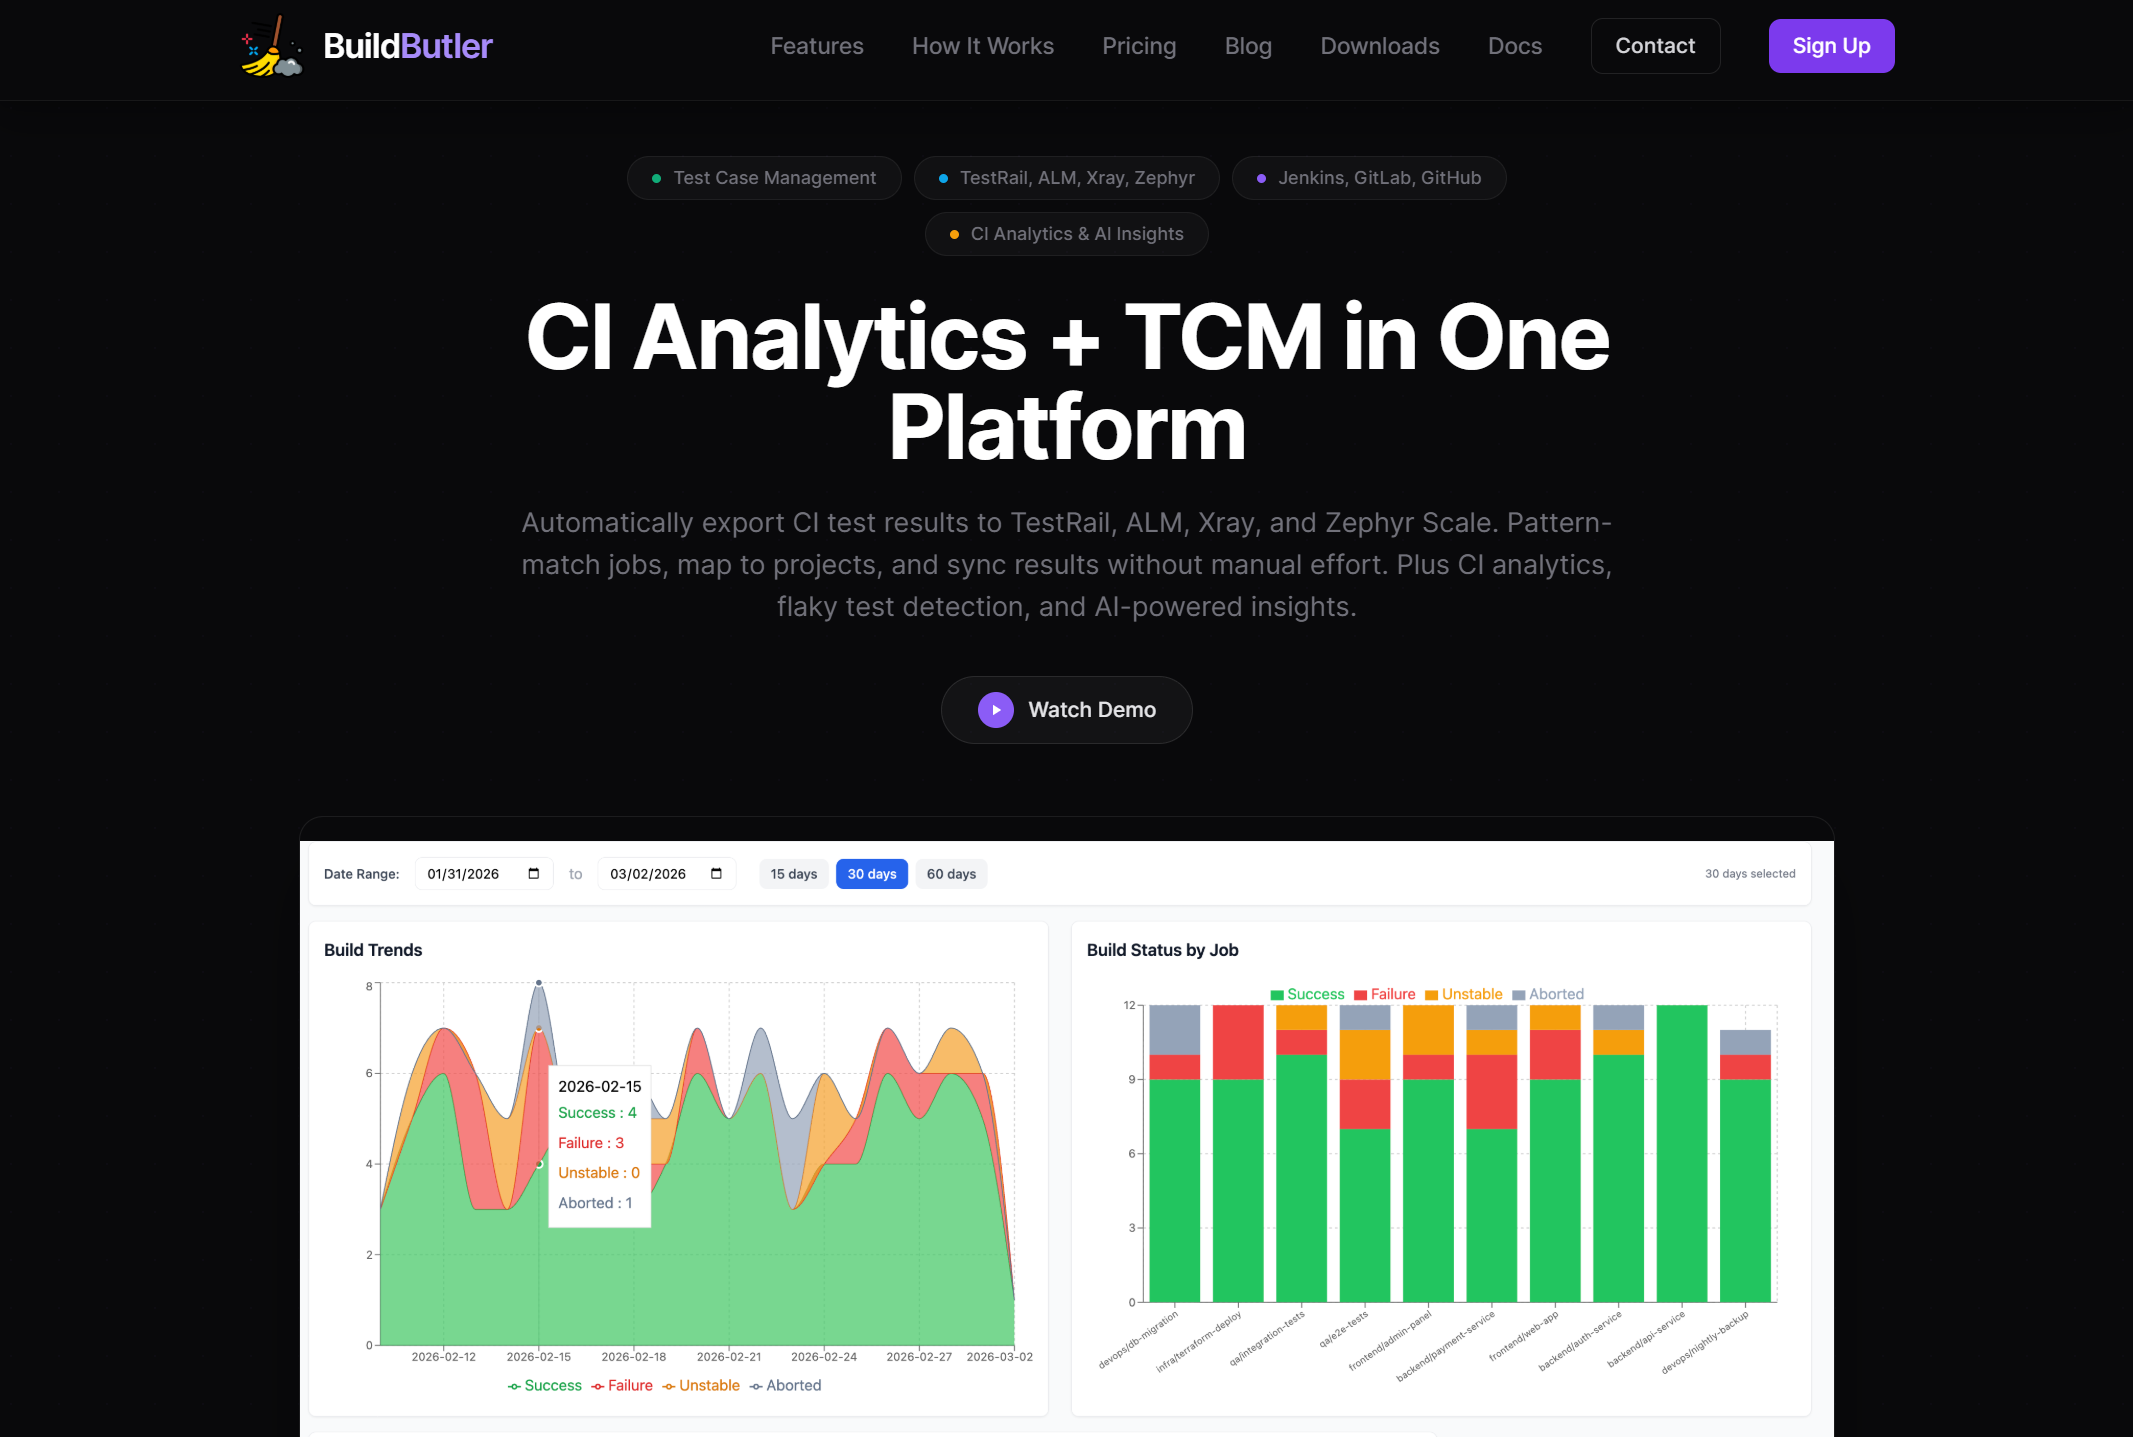
4. BuildButler
Best for
Jenkins teams that sync results to TCM tools
Overview
BuildButler sits on top of Jenkins (also supports GitLab and GitHub) and automatically exports test results to TestRail, Xray, Zephyr Scale, and HP ALM using pattern-matched JSON rules. It also provides build analytics, flaky test detection, and an AI chat interface for querying build failures in natural language.
Key capabilities
-
Auto-sync to TestRail, Xray, Zephyr, ALM
-
Flaky test detection with history
-
AI-powered build failure queries
-
Pipeline stage duration tracking
The pain point it solves: You run tests in Jenkins but track test cases in TestRail. Someone manually copies results between the two. BuildButler eliminates that step.
Languages: Framework-agnostic (reads JUnit XML output)
Frameworks: Any framework that produces JUnit XML
CI: Jenkins (primary), GitLab CI, GitHub Actions
Pricing: Free for 20 builds/day. Paid plans require contacting sales.
Limitations: Strongest with Jenkins. GitHub Actions and GitLab support are secondary. No embedded trace viewer or framework-specific failure debugging for Playwright or Cypress.
Verdict: Useful if your workflow depends on syncing CI results to a test case management tool. Not a deep intelligence layer on its own.
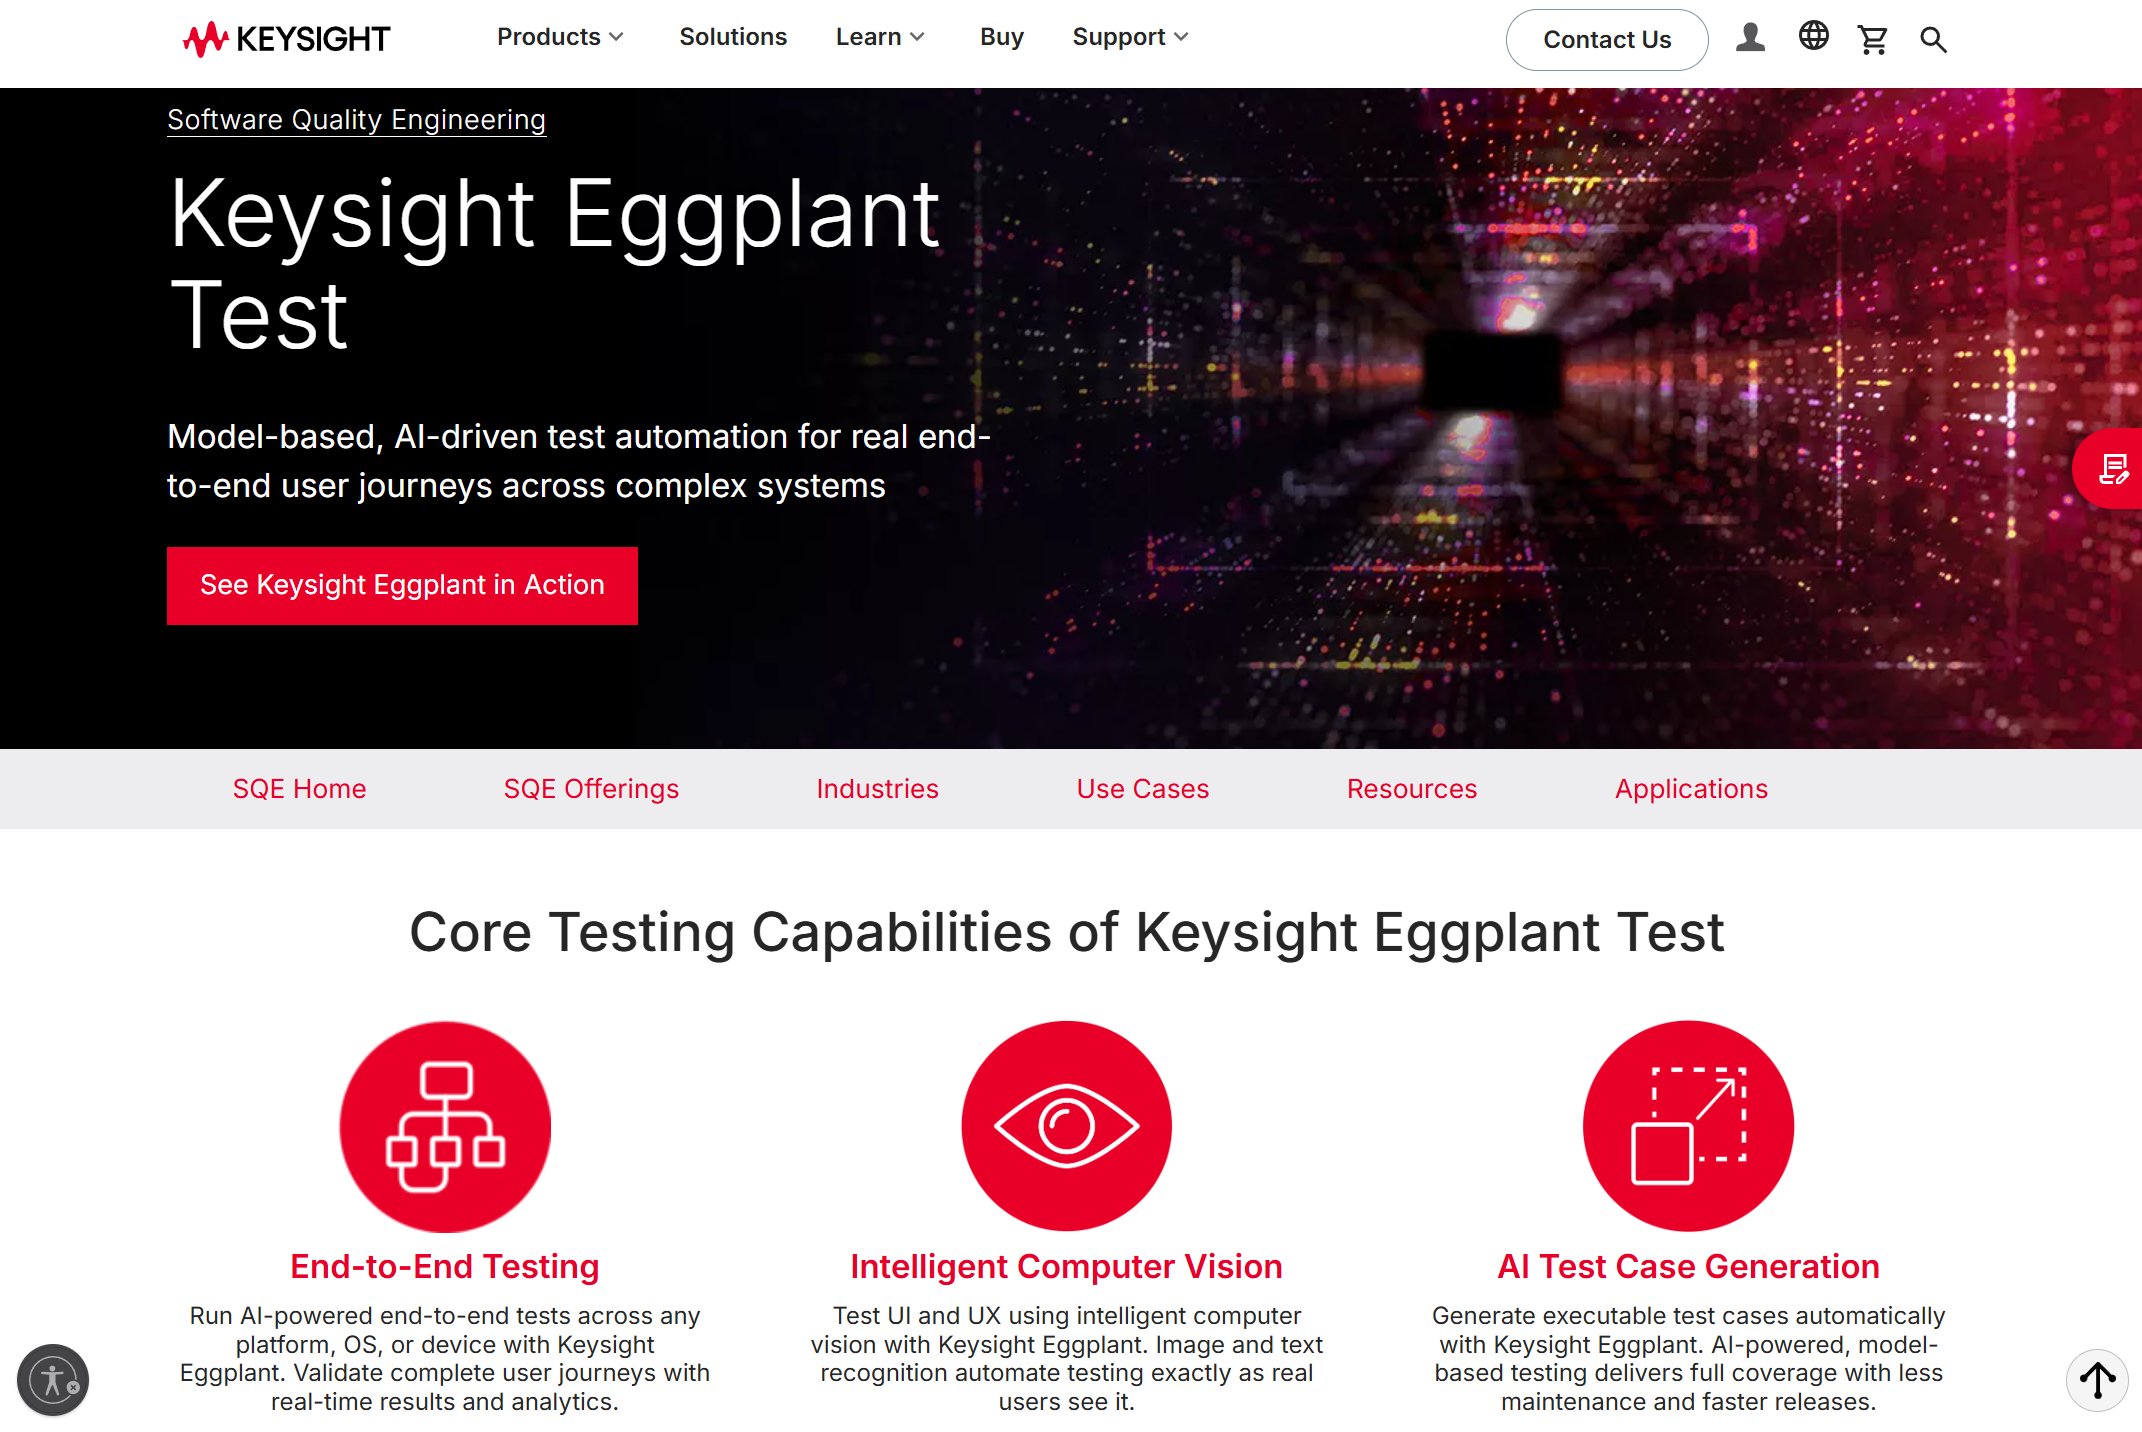
5. Keysight Eggplant
Best for
Enterprises testing across legacy and modern apps
Overview
Keysight Eggplant tests applications using image recognition and OCR instead of DOM selectors. You build models of user flows, and the platform generates and executes tests from those models. Its analytics dashboard provides coverage heatmaps that show which paths have been tested and which haven't, plus failure correlations by environment and build.
Key capabilities
-
Model-based test coverage heatmaps
-
Cross-platform execution analytics
-
Image and OCR-based interaction
-
CI integration (Jenkins, Bamboo, GitHub)
The pain point it solves: Your organization tests Citrix apps, mainframes, embedded systems, and web apps. Traditional selectors don't work across all of them. Eggplant's image-based approach does.
Languages: SenseTalk (proprietary scripting)
Frameworks: Framework-independent (image-based, not DOM-based)
CI: Jenkins, Bamboo, GitHub, Azure DevOps
Pricing: Subscription-based with multiple tiers. Contact sales.
Limitations: Does not support Playwright, Selenium, or Cypress natively. The OCR approach can produce false positives per G2 reviews. Heavy setup and expensive compared to lighter tools. Not suited for teams working exclusively with modern web frameworks.
Verdict: Built for enterprises testing mainframes and Citrix alongside web apps. Overkill if you're a Playwright-only team.
6. Virtuoso QA
Best for
No-code teams that want built-in reporting
Overview
Virtuoso QA combines natural-language test authoring with self-healing automation and a reporting layer. Tests are written in plain English and executed across browsers with built-in analytics.
Key capabilities
-
Natural-language test creation
-
Self-healing test scripts
-
Execution analytics and reports
-
Cross-browser cloud execution
The pain point it solves: Your QA team doesn't write code, but you need automated regression coverage with some level of reporting on what passed and failed.
Languages: Natural language (no-code)
Frameworks: Proprietary execution engine
CI: Jenkins, Azure DevOps, GitLab, GitHub Actions
Pricing: Contact sales. No public pricing.
Limitations: Analytics are secondary to test creation. No standalone intelligence layer for existing Playwright or Selenium suites. Requires adopting Virtuoso's authoring to access reporting.
Verdict: Good for teams starting automation from zero. Not a fit if you already have a Playwright suite and need smarter reporting.
7. Functionize
Best for
Enterprise QA teams with cloud-scale needs
Overview
Functionize uses ML and NLP to create, run, and maintain tests in the cloud. Its analytics layer provides failure diagnostics, screenshot comparisons, and test health trends.
Key capabilities
-
NLP-based test creation
-
Self-healing with ML
-
Test failure diagnostics
-
Cloud-based parallel execution
The pain point it solves: Your enterprise QA team maintains thousands of tests and spends more time fixing broken scripts than finding bugs. Functionize automates the maintenance.
Languages: Low-code / NLP (no traditional language required)
Frameworks: Proprietary cloud execution
CI: Jenkins, Azure DevOps, GitLab, GitHub Actions
Pricing: Custom pricing only. No free tier.
Limitations: Enterprise pricing is inaccessible for smaller teams. No Playwright-native support. Analytics bundled with execution, not available standalone.
Verdict: If your problem is test maintenance at scale, Functionize addresses that. If your problem is understanding test failures, the intelligence layer is not its strongest feature.
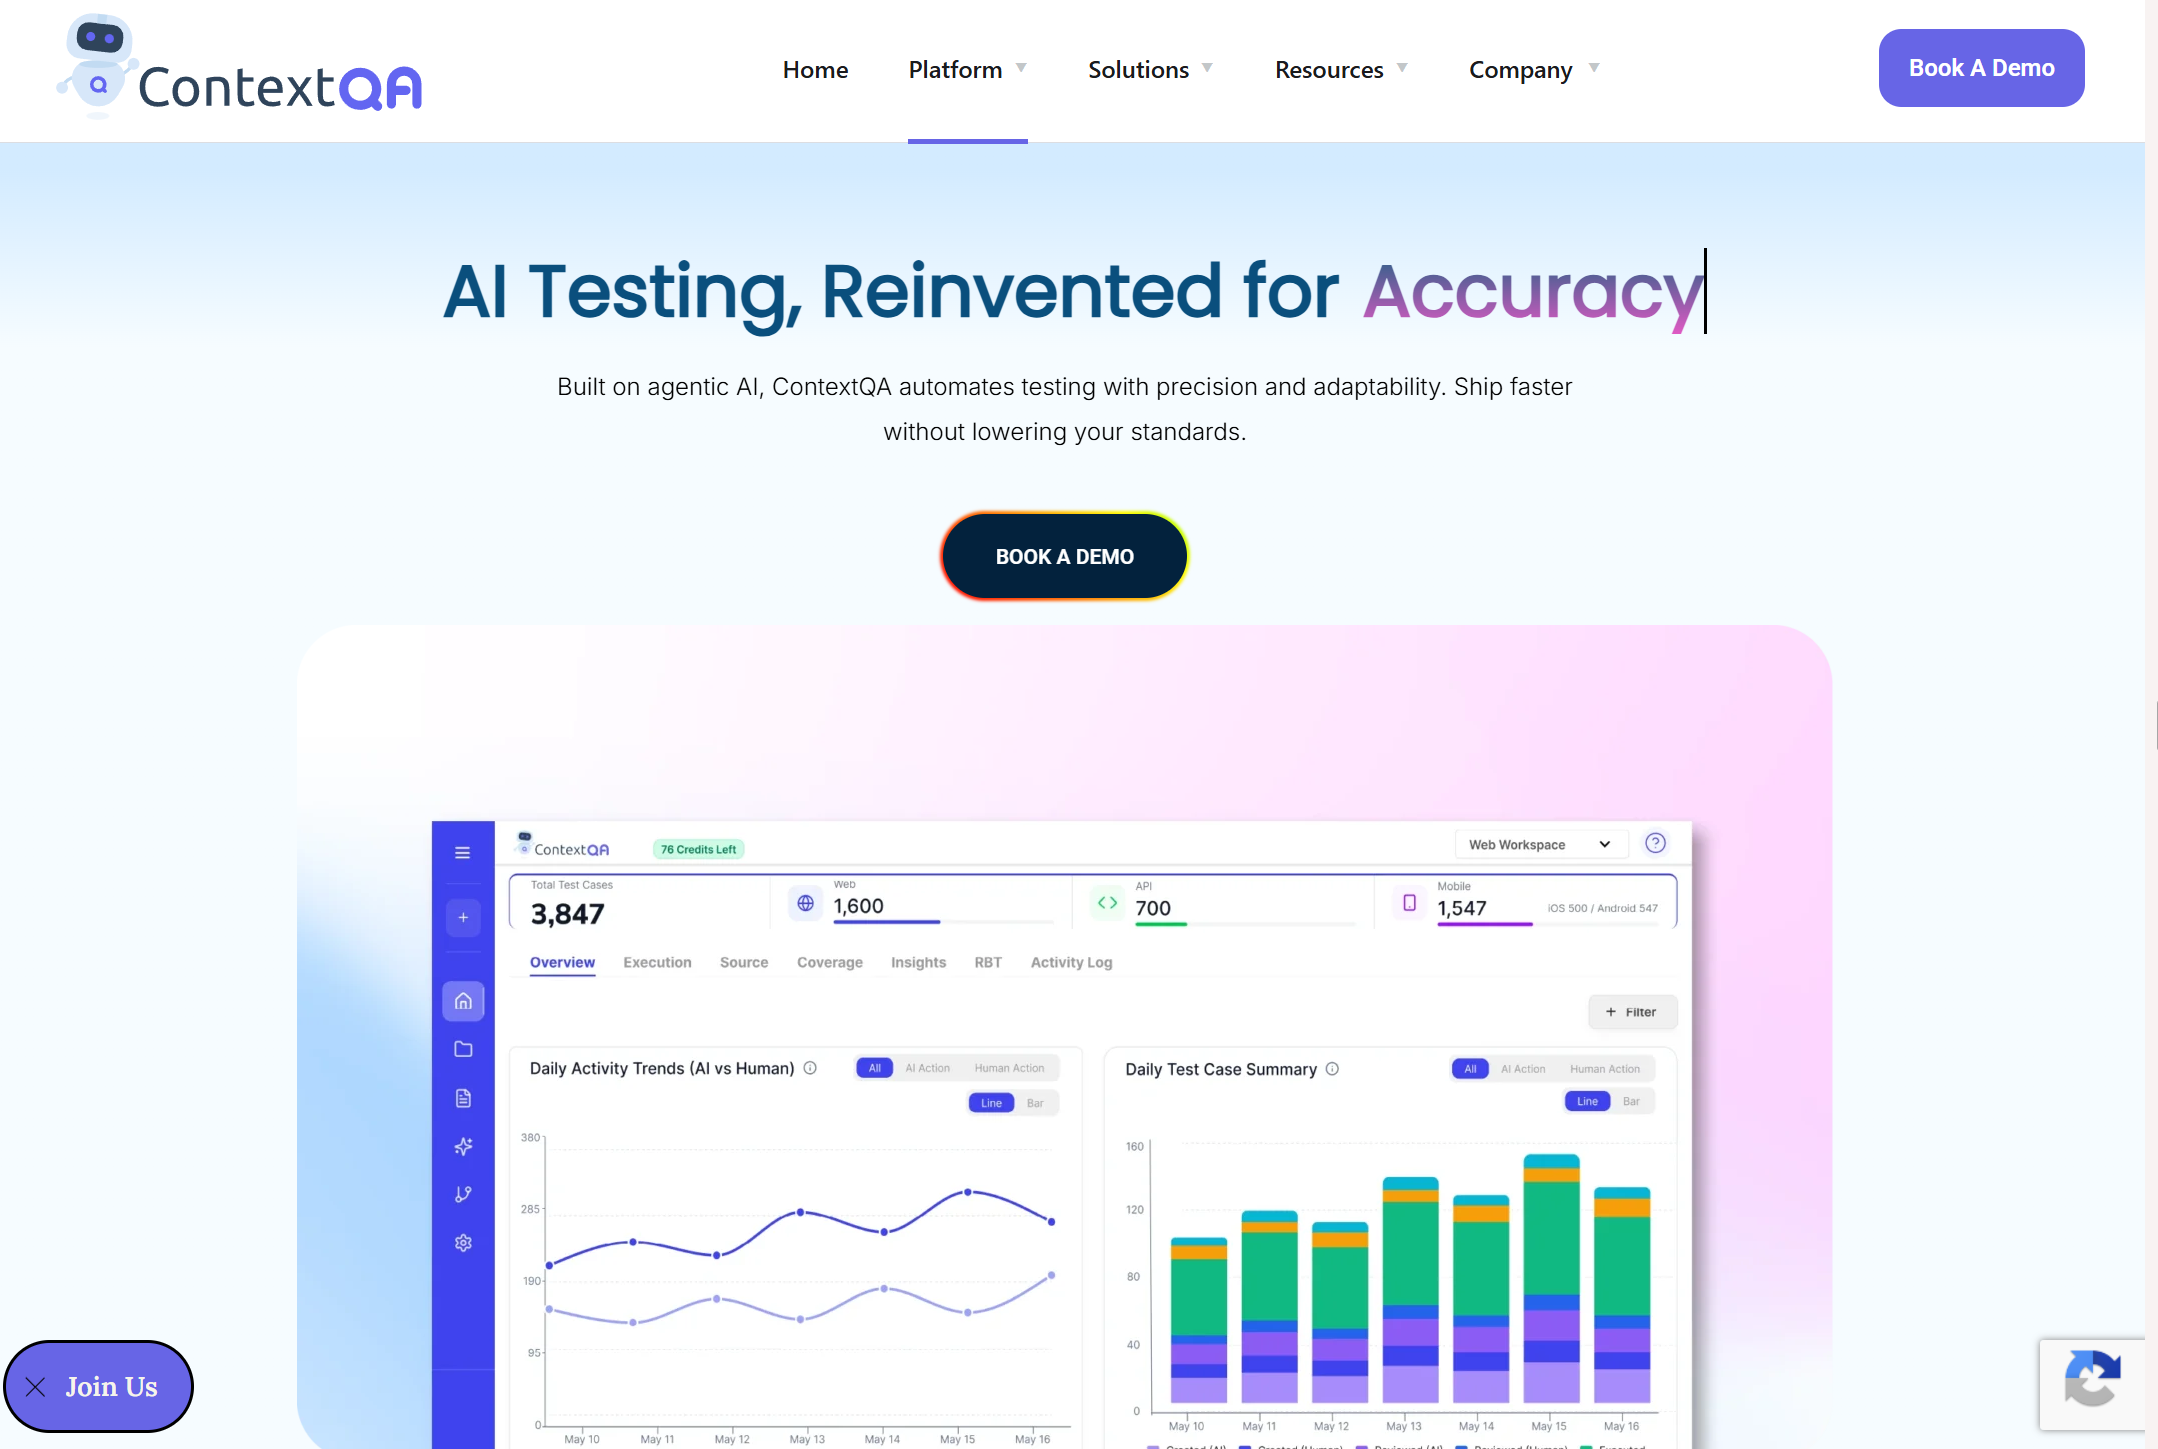
8. ContextQA
Best for
No-code teams want root cause analysis
Overview
ContextQA is an AI-powered test automation platform with built-in root cause and impact analysis. It auto-heals broken tests and provides failure diagnostics with video, trace logs, and error reports.
Key capabilities
-
Root cause and impact analysis
-
Auto-healing broken selectors
-
Test export as Playwright code
-
CI integration (Jenkins, CircleCI, Azure)
The pain point it solves: You have a backlog of untested features and no automation engineers to clear it. ContextQA's AI generates the tests and tells you why they fail.
Languages: No-code (exports to JavaScript/Python via Playwright, Selenium)
Frameworks: Proprietary engine, exports to Playwright, Selenium, WebDriverIO, Robot Framework
CI: Jenkins, CircleCI, Azure DevOps, GitHub Actions
Pricing: Starts at $499/month.
Limitations: Intelligence features are tied to ContextQA's test-creation workflow. Not designed as a standalone analytics layer over existing Playwright suites. Smaller community than established tools.
Verdict: The root cause analysis is genuinely useful, but you need to use ContextQA's test authoring to access it. It's a full platform commitment.
9. Qyrus
Best for
Teams needing unified web, mobile, and API analytics
Overview
Qyrus is a codeless testing platform covering web, mobile, API, and SAP testing. It includes step-by-step execution reports with screenshots, video recordings, and result indicators. Named a Leader in The Forrester Wave for Autonomous Testing Platforms, Q4 2025.
Key capabilities
-
Execution reports with screenshots/video
-
Agentic test orchestration (SEER)
-
Cross-platform test coverage
-
Test data management built in
The pain point it solves: Your team tests across web, mobile, and API layers using 3 different tools. Qyrus consolidates them onto a single platform with unified reporting.
Languages: No-code / low-code
Frameworks: Proprietary (web, mobile, API, SAP)
CI: Jenkins, GitHub Actions, Azure DevOps, CircleCI
Pricing: Contact sales. Not publicly listed.
Limitations: Reporting is part of a larger all-in-one platform. No Playwright-specific trace viewing or framework-level failure debugging. Requires adopting the full Qyrus stack.
Verdict: Impressive platform if you need everything in one place. You're buying the whole kitchen to get the oven.
10. Pcloudy
Best for
Mobile-first teams that need device cloud analytics
Overview
Pcloudy is a cloud-based testing platform with access to real Android and iOS devices and browsers. Beyond device access, it includes a Performance Intelligence module that monitors multiple metrics (CPU, memory, battery, network) with AI-driven anomaly detection and live dashboards.
Key capabilities
-
Real device cloud (5,000+ Android and iOS)
-
Live performance dashboards and trend analysis
-
Session video, device logs, and crash reports
-
CI integration (Jenkins, GitHub Actions, Azure)
The pain point it solves: Your mobile app crashes on a Samsung Galaxy A14 running Android 13, but you don't own that device. Pcloudy lets you test it remotely.
Languages: Java, Python, JavaScript, Ruby (via Appium/Selenium)
Frameworks: Appium, Selenium, Espresso, XCUITest
CI: Jenkins, GitHub Actions, Azure DevOps
Pricing: Device cloud starts at $23/month billed annually (min 2 users). Performance Intelligence starts at $239/month. Custom plans for enterprises.
Limitations: Primarily a device cloud and mobile performance platform. Performance Intelligence adds AI anomaly detection, but there's no failure classification for functional test results and no flaky test detection. No Playwright trace viewer support. Best suited for mobile and performance testing, not web-focused test suites.
Verdict: Covers device access and performance monitoring well. If your bottleneck is mobile device availability and app performance metrics, Pcloudy handles that. For functional test failure analysis on Playwright or Selenium suites, you'll need a separate tool.
Test intelligence vs test management: A quick comparison
| Category | Test intelligence platform | Test management tool |
|---|---|---|
| Primary input | CI execution data, traces, logs | Manual and automated test cases |
| Core function | Failure analysis, pattern detection | Test case organization, run tracking |
| AI usage | Failure classification, flaky detection | Test case suggestions (some tools) |
| Output | Root cause signals, prioritized fixes | Coverage reports, pass/fail counts |
| Examples | TestDino, CloudBees Smart Tests | TestRail, Zephyr, Qase |
Some platforms combine both. TestDino includes test management alongside its intelligence features. Most tools on this list focus on one or the other.
What to look for when picking a test intelligence platform
1. Standalone vs bundled
Can you plug it into your existing Playwright or Selenium suite? Or do you need to rewrite your tests on their platform? Only 3 tools on this list work as a standalone layer. The rest need a full platform adoption.
2. Framework-specific debugging
A tool that parses Playwright traces gives you DOM snapshots, network logs, and step-by-step replay. A tool that reads JUnit XML reports a test name and pass/fail status. The debugging experience is not comparable.
3. Failure classification depth
Does it sort failures into categories or show pass/fail? The difference between "47 tests failed" and "3 are real bugs, 12 are flaky, 32 are the same infrastructure timeout" is the entire value of this category.
4. Flaky test detection
One-run detection is unreliable. Look for historical tracking across multiple runs with root cause labels, not just a "flaky" tag.
5. Time to first insight
How fast from CI failure to root cause? Some tools need days of data. Others classify on your first run.

Conclusion
These 11 tools approach test intelligence from different angles. Some focus on failure classification, others on predictive test selection, visual validation, or device-level analytics. The right pick depends on your stack, your team size, and which part of the post-execution problem is costing you the most time.
If you're on Playwright, TestDino is the most direct fit. It reads your traces, classifies your failures, and works as a standalone layer without asking you to rewrite a single test.
FAQs
Table of content
Flaky tests killing your velocity?
TestDino auto-detects flakiness, categorizes root causes, tracks patterns over time.
Follow Us