Playwright Screencast: Record Tests
Playwright screencast records browser test runs as video for debugging and CI reporting. This guide covers setup, configuration, on-failure capture, and using video artifacts in your pipeline.


A test fails in CI. The log says "element not visible." You check the screenshot, but it only shows the final state. The button is clearly there. So what happened in the three seconds before the failure?
That is the exact gap Playwright screencast fills. It records what the browser actually rendered frame-by-frame during your test, producing a .webm video you can replay, share with your team, or attach to a bug report.
And as of Playwright v1.59, screencast recording is no longer just a passive dump. The new page.screencast API lets you start and stop recordings mid-test, annotate interactions visually, insert chapter markers for narration, stream frames to AI vision models in real time, and produce video receipts that coding agents can hand off for human review.
This guide covers every angle: basic configuration, the new v1.59 API, CI pipeline integration across GitHub Actions, GitLab CI, and Jenkins, along with the practical trade-offs between video, traces, and screenshots.
Requires: Playwright ≥ 1.59 for the page.screencast API. Config-based video recording (video: 'on') works on all recent versions. Supported across Chromium, Firefox, and WebKit.
What is Playwright screencast?
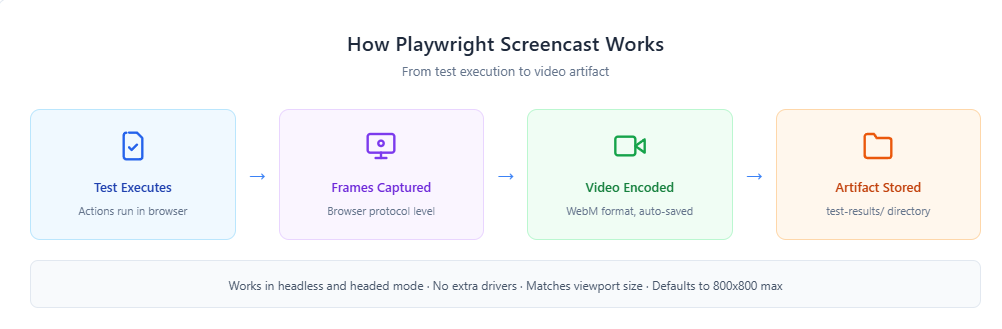
Playwright screencast is the built-in capability that records the browser viewport during test execution and saves it as a WebM video file. It captures frames directly from the browser rendering engine at the protocol level, which means it works identically in headless and headed modes, requires no external tools, and matches your test's actual viewport dimensions.
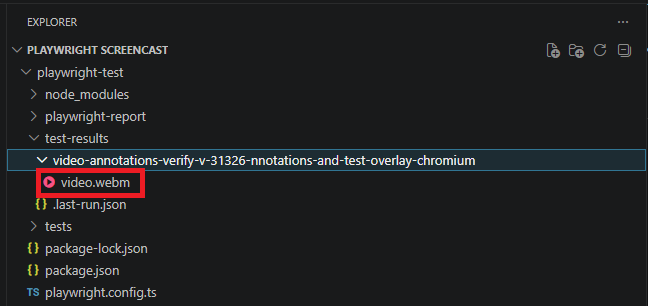
The output lands in your test-results/ folder as a .webm file. You can enable it two ways:
- Globally via config — Set video: 'on' in playwright.config.ts for automatic lifecycle-based recording.
- Programmatically via the screencast API — Use page.screencast.start() and page.screencast.stop() for precise, mid-test control (v1.59+).
Here is the simplest config-based setup:
import { defineConfig } from '@playwright/test';

export default defineConfig({
  use: {
    video: 'on',
  },
});
Run any test with this config, and Playwright automatically captures a video recording of the browser from the moment the browser context opens until it closes. The resulting video lives alongside your other test artifacts.
How to enable Playwright video recording
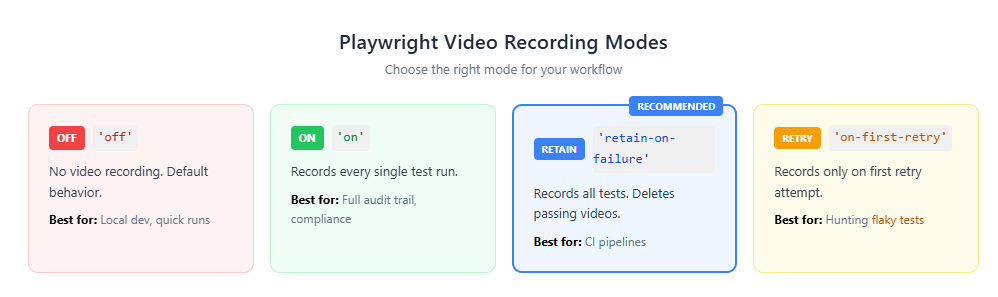
Playwright gives you four recording modes through the video option in your config. Each mode controls when test videos are captured and whether they are deleted afterward.
For most CI setups, 'retain-on-failure' strikes the best balance: you get video evidence for every failure without burning storage on recordings of passing tests.
Setting the mode globally
import { defineConfig } from '@playwright/test';

export default defineConfig({
  use: {
    video: 'retain-on-failure',
  },
});
Customizing video size and enabling action annotations via config
Starting with v1.59, you can pass an object instead of a string to control video dimensions and enable visual overlays directly from the config. The show property adds action annotations and test info overlays without writing any screencast API code.
import { defineConfig } from '@playwright/test';

export default defineConfig({
  use: {
    video: {
      mode: 'on',
      size: { width: 640, height: 480 },
      show: {
        actions: {
          position: 'top-left',
        },
        test: {
          position: 'top-right',
        },
      },
    },
  },
});
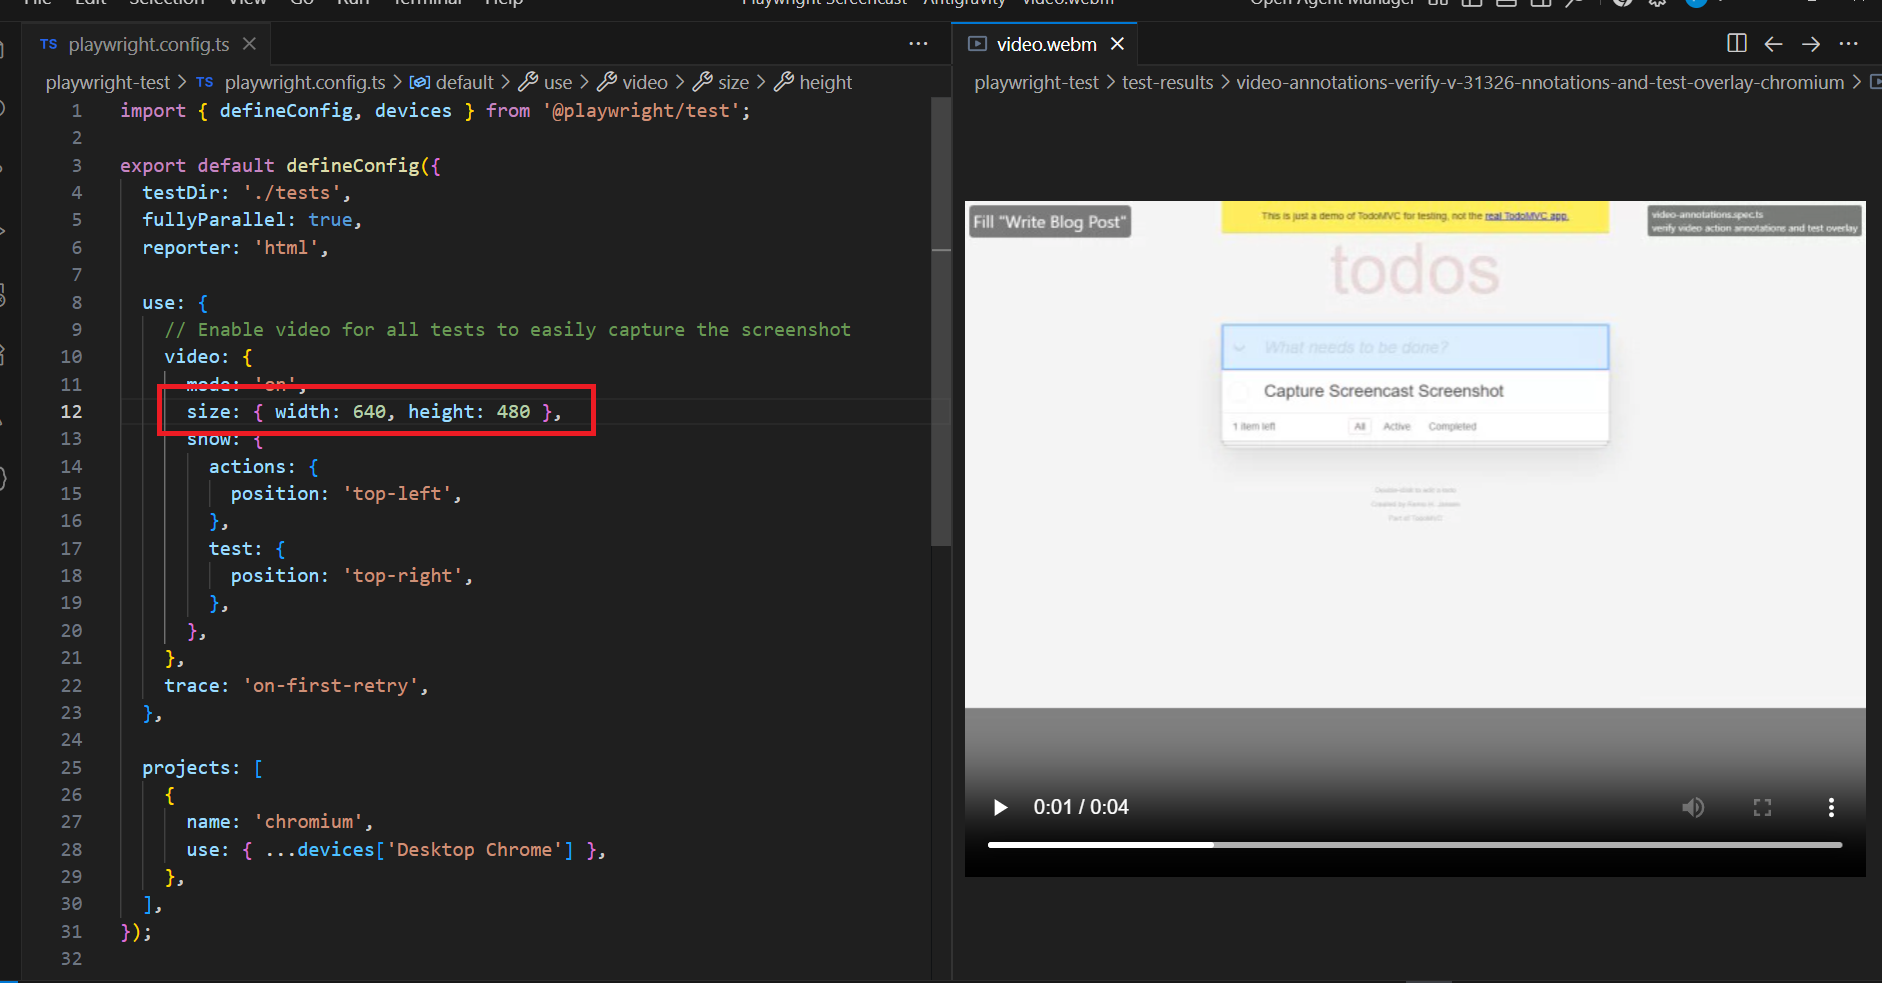
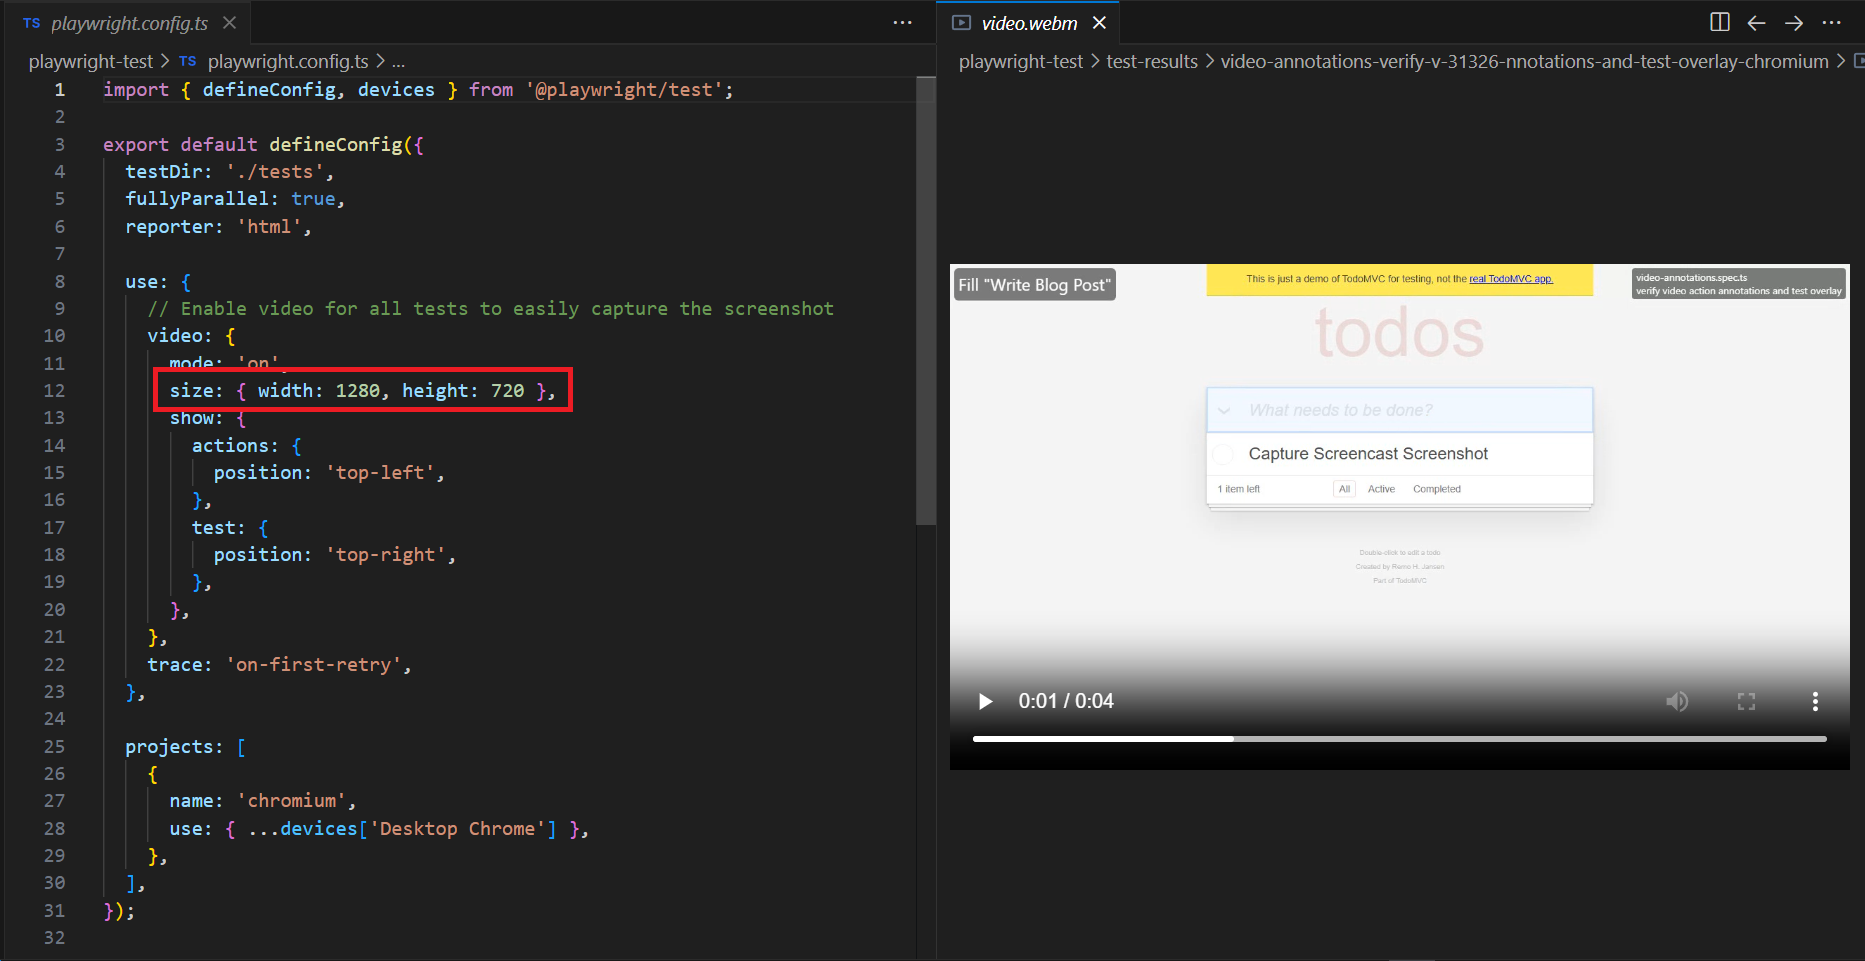
The show.actions property highlights interacted elements and displays action titles during the recording. The show.test property overlays the current test name and step information. This is particularly useful when your team reviews video artifacts from Playwright CI/CD runs and needs to quickly identify which step caused a failure.

Tip: If your videos ever come out as 0-byte files, you probably forgot to close the browser context. Playwright only finalizes video files after context.close() is called. This is the single most common screencast issue teams hit.
Recording video per test (Library API)
If you are using Playwright as a library rather than via @playwright/test, configure recording when creating a browser context:
const { chromium } = require('playwright');

async () => {
  const browser = await chromium.launch();
  const context = await browser.newContext({
    recordVideo: {
      dir: 'videos/',
      size: { width: 1280, height: 720 },
    },
  });

  const page = await context.newPage();
  await page.goto('https://example.com');

  // Video is ONLY saved after context closes
  await context.close();
  await browser.close();
})();
Accessing video paths in tests
You can retrieve the video file path for any page, which is useful when attaching recordings to your test report or uploading them to external storage:
const videoPath = await page.video().path();
console.log('Video saved at:', videoPath);

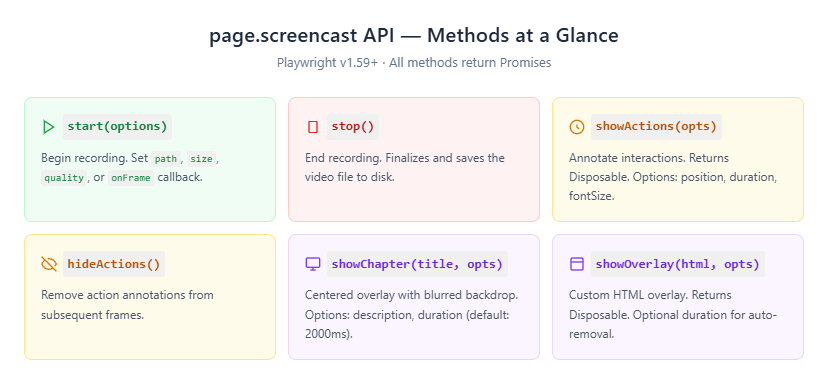
The new page.screencast API in Playwright v1.59
This is the headline feature of the v1.59 release. While the config-based video option records automatically for the entire test lifecycle, page.screencast gives you programmatic control. You can start a recording at any point, stop it wherever you want, and layer on visual annotations while the test runs.
The practical implication: you no longer have to record the entire test just to capture a 5-second checkout flow.
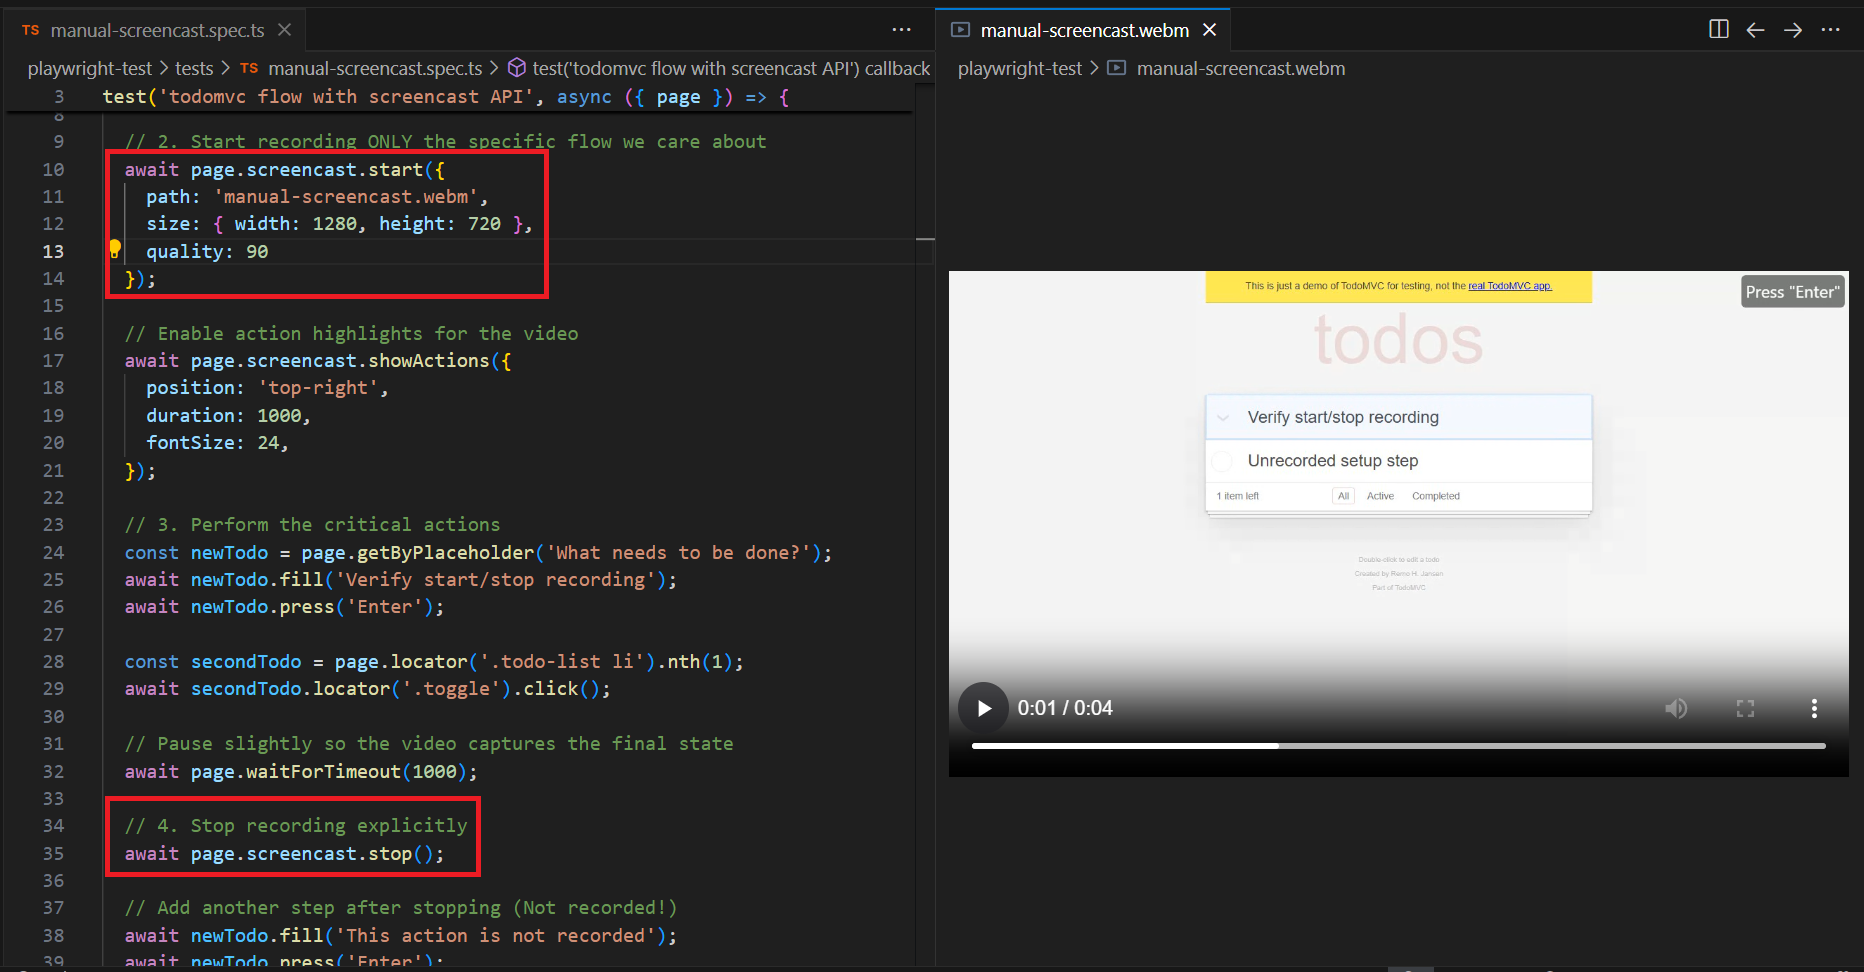
Screencast recording with start/stop control
import { test } from '@playwright/test';

test('checkout flow with screencast', async ({ page }) => {
  await page.goto('https://shop.example.com');

  // Start recording from this specific point
  await page.screencast.start({ path: 'checkout-flow.webm' });

  await page.locator('#add-to-cart').click();
  await page.locator('#checkout').click();
  await page.locator('#pay-now').click();

  // Stop recording — video is saved now
  await page.screencast.stop();
});
The video is saved to checkout-flow.webm only after stop() is called. You can optionally control dimensions and compression quality:
await page.screencast.start({
  path: 'checkout-flow.webm',
  size: { width: 1280, height: 800 },
  quality: 80,  // 0-100, controls JPEG frame quality
});
If you omit size, it defaults to the page viewport scaled down to fit within 800×800.
Action annotations with showActions()
showActions() enables built-in visual annotations that highlight every element your test interacts with. Clicks, fills, and hovers get visually marked in the video with element outlines and action titles.
await page.screencast.start({ path: 'annotated-flow.webm' });

await page.screencast.showActions({
  position: 'top-right',   // 'top-left' | 'top' | 'top-right' | 'bottom-left' | 'bottom' | 'bottom-right'
  duration: 500,            // how long each annotation stays visible (default: 500ms)
  fontSize: 24,             // annotation label size in pixels (default: 24)
});

// Every interaction below is now annotated in the video
await page.locator('#username').fill('testuser');
await page.locator('#password').fill('secure123');
await page.locator('#login').click();

await page.screencast.stop();
When you watch the video back, each interaction shows which element was targeted and what action was performed. To disable annotations mid-recording, call hideActions(). Since showActions() returns a Disposable, you can also use await using for automatic cleanup when the scope ends.
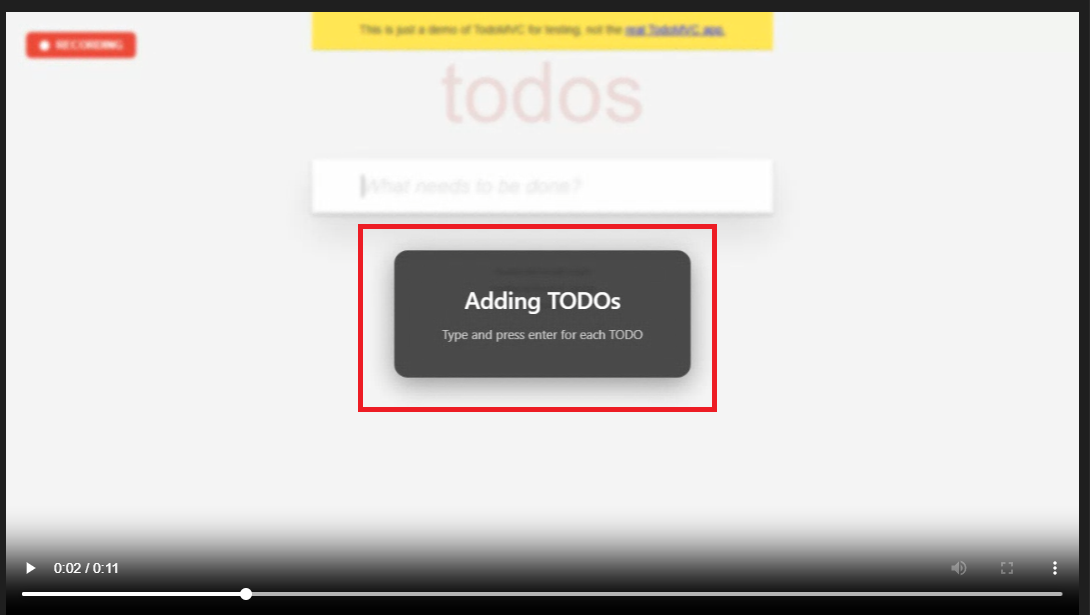
Chapter markers and custom overlays
showChapter() displays a centered overlay with a title, optional description, and blurred backdrop. It is perfect for segmenting long recordings into logical sections:
await page.screencast.showChapter('Step 1: Adding TODOs', {
  description: 'Type each item and press Enter',
  duration: 2000,   // auto-removed after 2 seconds (default: 2000ms)
});
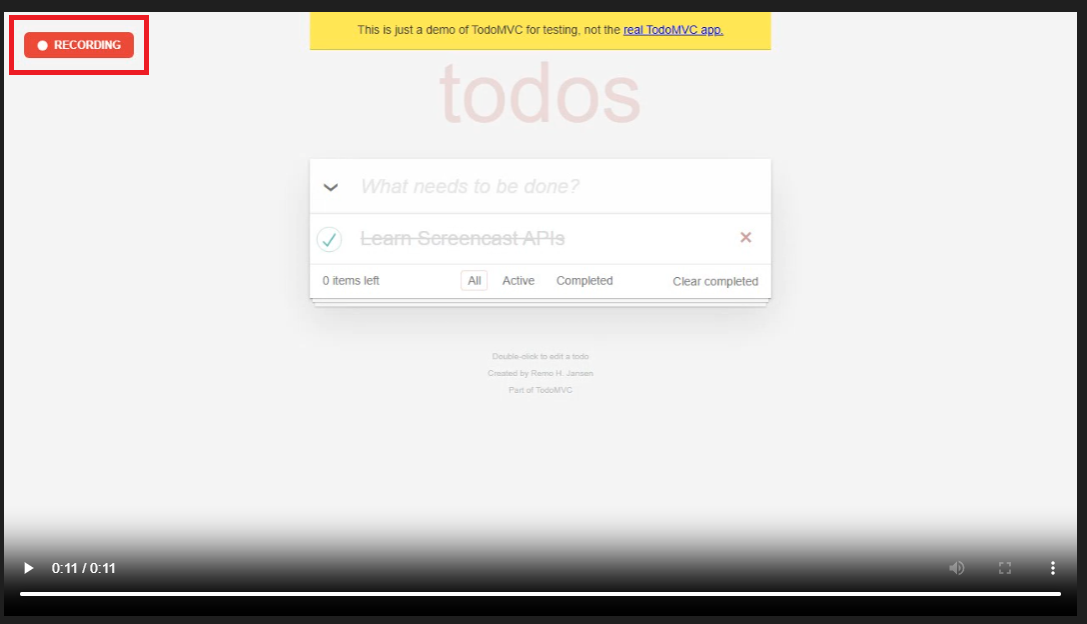
For fully custom overlays, use showOverlay() with raw HTML. The overlay persists until you dispose it or set a duration:
const indicator = await page.screencast.showOverlay(
  '<div style="background:rgba(220,38,38,0.9);color:#fff;padding:8px 16px;border-radius:6px;font-family:sans-serif;font-weight:bold;">● RECORDING</div>'
);
// ... perform test actions ...

// Remove the overlay when done
await indicator.dispose();
You can toggle all overlays at once with showOverlays() and hideOverlays().
Real-time frame capture for AI vision
Instead of saving to a file, you can stream JPEG-encoded frames to a callback. This unlocks workflows like live previews, thumbnail generation, and feeding frames to AI vision models:
await page.screencast.start({
  onFrame: ({ data }) => sendToVisionModel(data),
  size: { width: 800, height: 600 },
});

// ... perform actions ...

await page.screencast.stop();
You can use path and onFrame together: save the video file while simultaneously streaming frames for analysis.
Agentic video receipts
This is a workflow the Playwright team specifically designed for coding agents. After completing a task, an agent records a narrated walkthrough video as a "receipt" for human review:
await page.screencast.start({ path: 'receipt.webm' });
await page.screencast.showActions({ position: 'top-right' });
await page.screencast.showChapter('Verifying checkout flow', {
  description: 'Added coupon code support per ticket #1234',
});

// Agent performs verification
await page.locator('#coupon').fill('SAVE20');
await page.locator('#apply-coupon').click();
await expect(page.locator('.discount')).toContainText('20%');

await page.screencast.showChapter('Done', {
  description: 'Coupon applied, discount reflected in total',
});
await page.screencast.stop();
The resulting video is a receipt. Chapter titles provide context, action annotations show each interaction, and the visual walkthrough is faster to review than scanning text logs. This ties directly into the broader v1.59 agentic improvements: browser.bind() for connecting agents to running browsers, --debug=cli for terminal-based debugging, and npx playwright trace for CLI trace analysis.
Using Playwright screencast in CI pipelines
Recording videos locally is straightforward. The challenge is making those videos available from CI, where the machine gets destroyed after the job finishes. The workflow:
- Set video: 'retain-on-failure' in your Playwright config
- Run tests in CI
- Upload the test-results/ folder as a pipeline artifact
- Download and review videos when a test fails
Here is how this looks across the three most common CI platforms.
GitHub Actions
name: Playwright Tests

on: [push, pull_request]

jobs:
  test:
    runs-on: ubuntu-latest
    steps:
      - uses: actions/checkout@v4
      - uses: actions/setup-node@v4
        with:
          node-version: 20
      - run: npm ci
      - run: npx playwright install --with-deps

      - name: Run Playwright tests
        run: npx playwright test

      - name: Upload test artifacts
        uses: actions/upload-artifact@v4
        if: ${{ !cancelled() }}
        with:
          name: playwright-report
          path: |
            playwright-report/
            test-results/
          retention-days: 14
Why `!cancelled()` instead of `failure()`?
The !cancelled() condition uploads artifacts whether tests pass or fail. When using 'retain-on : failure', Playwright handles video cleanup internally, it deletes passing test videos before the upload step runs. Using failure()would skip the upload entirely when all tests pass, which breaks 'on' mode.
GitLab CI
playwright_tests:
  stage: test
  image: mcr.microsoft.com/playwright:v1.59.0-jammy
  script:
    - npm ci
    - npx playwright test
  artifacts:
    when: always
    paths:
      - playwright-report/
      - test-results/
    expire_in: 14 days
Jenkins
pipeline {

    agent any

    stages {

        stage('Test') {

            steps {

                sh 'npm ci'

                sh 'npx playwright install --with-deps'

                sh 'npx playwright test'

            }

        }

    }

    post {

        always {

            archiveArtifacts artifacts: 'test-results/**/*', allowEmptyArchive: true

            archiveArtifacts artifacts: 'playwright-report/**/*', allowEmptyArchive: true

        }

    }

}
When running hundreds of tests across multiple shards, video artifacts can add up fast. Teams handling Playwright parallel execution at scale often pair video recording with centralized reporting to avoid digging through zip files. Playwright's merge-reports command can consolidate results across shards into a unified report.
Security note: Video recordings may capture sensitive data visible in the browser — login credentials, personal information, API keys in URLs. Treat video artifacts with the same access controls you apply to your application logs. Encrypt CI artifact storage and restrict download permissions.
Playwright trace vs video: when to use which
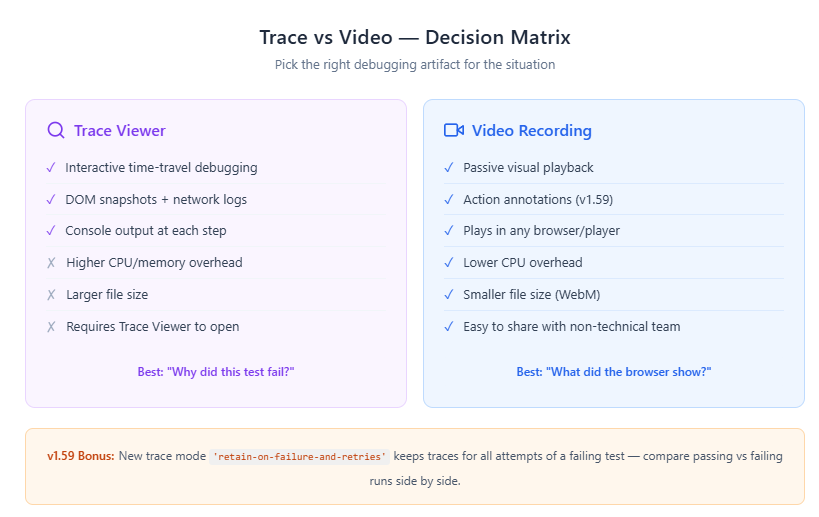
This is where most teams get confused. Playwright offers both Trace Viewer and video recording, and they solve fundamentally different problems.
Use traces when you need to understand why : The Playwright Trace Viewer gives you interactive time-travel debugging: DOM snapshots, network logs, console output, and source code at every step. When "the button click did nothing," a trace lets you inspect the DOM and discover the button was covered by a modal overlay.
Use video when you need to confirm what happened visually : Layout shifts, animation glitches, unexpected pop-ups, and race conditions that cause elements to briefly flash on screen are all easier to spot in a video than in DOM snapshots. With v1.59 action annotations, Playwright screencast videos now carry significantly more context than raw recordings.
The recommended production CI config enables both:
import { defineConfig } from '@playwright/test';

export default defineConfig({
  use: {
    trace: 'on-first-retry',
    video: 'retain-on-failure',
    screenshot: 'only-on-failure',
  },
});
This gives you deep debugging for retried tests (traces), visual evidence for all failures (video), and a lightweight fallback for every failure (screenshots). This is the setup most Playwright best practices guides recommend.
For teams investigating flaky tests, the new 'retain-on-failure-and-retries' trace mode (v1.59) keeps traces for every retry attempt. You can compare a passing trace with a failing one side-by-side to spot the exact divergence point.
Performance tips for Playwright screencast recording
Playwright video capture adds CPU overhead and disk I/O. On resource-constrained CI runners this can become a bottleneck. Here is how to keep it under control.
1. Never use video: 'on' in CI. Recording every test — including passing ones — generates massive storage. A 500-test suite averaging 15 seconds each can produce 15-25 GB of video per run. Use 'retain-on-failure' or 'on-first-retry' instead.
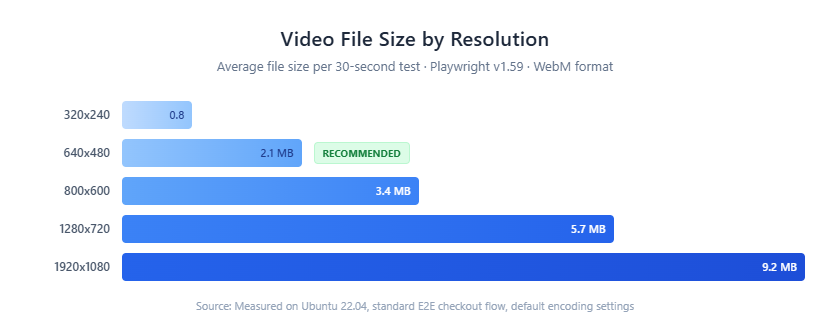
2. Reduce video resolution. A 640×480 recording is usually sufficient for debugging and produces files roughly 60% smaller than 1280×720:
use: {
  video: {
    mode: 'retain-on-failure',
    size: { width: 640, height: 480 },
  },
},
3. Use the screencast API for focused recordings. With page.screencast, you only record the section you care about. Skip the setup and teardown:
await page.goto('https://shop.example.com');
await loginAsTestUser(page); // Not recorded

await page.screencast.start({ path: 'checkout.webm' });
await page.locator('#checkout').click();
await page.locator('#pay-now').click();
await page.screencast.stop();  // Only checkout is in the video
4. Use headless mode. You get a 10-30% performance boost because the browser skips on-screen UI rendering. This does not affect video quality — Playwright captures frames from the rendering engine, not the display.
5. Set artifact retention policies. 14 days is a reasonable CI default. Video artifacts older than two weeks rarely get reviewed.
6. Tune parallel workers. If video recording causes timeouts, you may have too many workers competing for CPU and disk bandwidth. Reduce workers to match your CI runner capacity. The TestDino guide on optimizing Playwright workers has benchmarks for different machine sizes.
Teams dealing with Playwright slow tests often find that switching from video: 'on' to video: 'retain-on-failure' cuts CI run time by 15-20% simply by reducing the disk I/O overhead of persisting videos for passing tests.
v1.59 bonus: With the new await using syntax, many Playwright APIs now return async disposables for automatic cleanup. Screencast overlays, routes, and init scripts are cleaned up automatically when they go out of scope - reducing resource leaks in long test suites.
When your suite grows beyond a few hundred tests, managing video artifacts manually becomes unsustainable. Teams at that scale typically use a Playwright observability platform to centralize videos, traces, and logs in one searchable dashboard.
Conclusion
Playwright screencast turns CI test failures from guesswork into evidence. The config-based approach (video: 'retain-on-failure') covers most CI use cases with no extra code. The page.screencast API in v1.59 takes it further with focused recordings, action annotations, chapter markers, custom overlays, and real-time frame streaming for AI workflows.
The production setup most teams land on combines three artifact types: video for visual replay, traces for deep debugging, and screenshots as a lightweight fallback. Start with learning Playwright fundamentals, then layer on screencast recording as your suite moves into CI.
What matters is not capturing everything. It is capturing the right thing at the right time. Use 'retain-on-failure' to keep storage lean, reduce resolution for CI, leverage the screencast API for focused recordings, and clean up artifacts on a schedule.
FAQs
Table of content
Flaky tests killing your velocity?
TestDino auto-detects flakiness, categorizes root causes, tracks patterns over time.
Follow Us