Complete guide to Playwright reporting
Learn how Playwright's reporting ability improve test visibility and debugging. This article covers built-in and third-party reporters, including HTML and Trace Viewer, plus best practices to get faster feedback and actionable insights from every test run.


Playwright reporting is the difference between knowing a test failed and understanding why it failed. For teams managing test automation reporting, this is the core challenge.
Modern test suites generate thousands of assertions across browsers, environments, and CI pipelines. Without clear reporting, failures turn into guesswork, making Playwright failure analysis difficult, debugging slow, and releases unreliable.
This guide explains Playwright reporting from first principles through advanced, production-scale setups.
By the end, you'll know what Playwright reports contain, how reporters work, when to use traces, and how to choose the right reporting strategy for your team.
Why Test Automation Reports are Needed?
Once tests start running, the next challenge is understanding the results. A failing CI job only shows that something broke; it does not explain what failed or why. Test automation reports solve this by turning raw test runs into clear, actionable information the whole team can use.
With proper reporting, failures come with context. Teams can see the exact step that failed, along with timing data and supporting artifacts such as screenshots or traces when enabled. This reduces back-and-forth and helps issues get fixed faster.
Over time, good reporting also makes test suites easier to manage. It helps teams track tests flaky , identify slow or unstable specs that impact CI time, and spot failures that repeat across branches or pipelines.
In CI environments, reports act as a shared source of truth that developers, QA, and leads can rely on to make consistent decisions.
From a reporting perspective, Playwright is especially strong. When a test fails, the report links directly to the exact step that broke and can include screenshots, videos, and traces.
This allows teams to inspect the DOM state, review network activity, and understand failures from a single place, making debugging faster and more reliable across local runs and CI pipelines.
What Makes Playwright Reporting Different
Playwright reporting stands out because reporting and debugging are built directly into the framework rather than added through plugins.
Test results, execution steps, and debugging artifacts are generated as part of the normal test run, which keeps reporting consistent across local environments and CI pipelines.
Compared to other test frameworks, Playwright reporting offers a few practical advantages. It provides step-level visibility into test execution, integrates natively with traces, screenshots, and videos, and supports parallel test runs without losing clarity in reports. These features work out of the box and require minimal configuration.
Most importantly, Playwright reporting shortens the path from failure to root cause. When a test breaks, teams can inspect the exact step, application state, and supporting artifacts from a single report, reducing guesswork and speeding up debugging.
Different types of Playwright Reporters
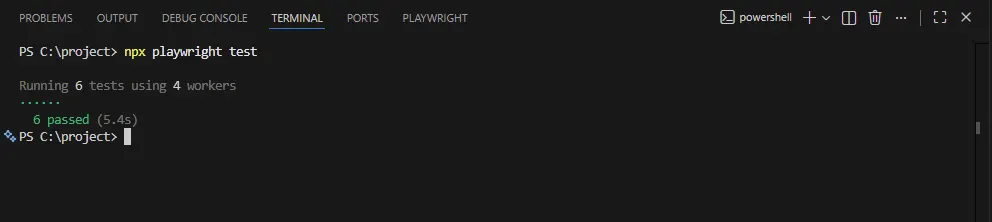
When you run Playwright tests without explicitly configuring a reporter, Playwright uses the list reporter by default. You can customize reporting by specifying one or more reporters in the playwright.config file. In many setups, the HTML reporter is commonly enabled to provide a detailed, interactive view of test results.
You can also configure reporters directly from the command line using the --reporter flag. For example, to run tests with a specific reporter:
npx playwright test --reporter=line
After the test run completes, Playwright generates the report output in the configured directory, such as the default playwright-report folder or a custom path if specified. These reports make it easier to review test results and choose the reporting format that best fits your locament or CI needs.
Built-In Playwright Reporters
Playwright includes several built-in reporters that work out of the box and cover most reporting needs, from local development to CI pipelines.
These reporters require no additional installation and can be configured directly in the Playwright configuration file.
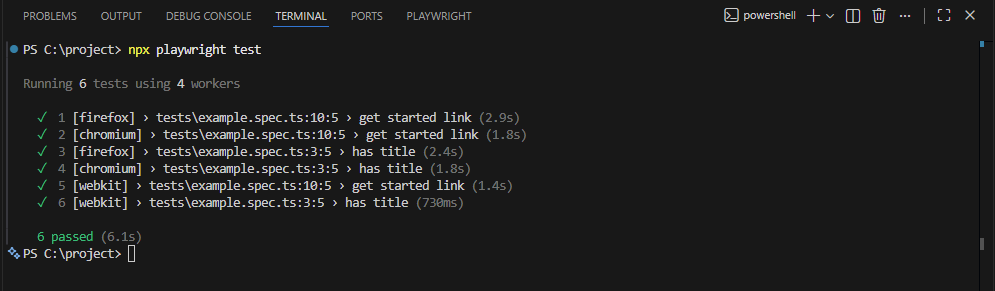
List Reporter
The List reporter is the default reporter in Playwright. It prints each test name along with its status as the run progresses, making it ideal for local development where readability matters. Failed tests include error details, which helps developers quickly understand what went wrong.
export default {
  reporter: 'list',
};
Line reporter
The Line reporter outputs one line per test, making it more compact than the List reporter. It works well for medium to large test suites where verbose output can become noisy, while still providing a clear summary of test execution.
export default {
  reporter: 'line',
};
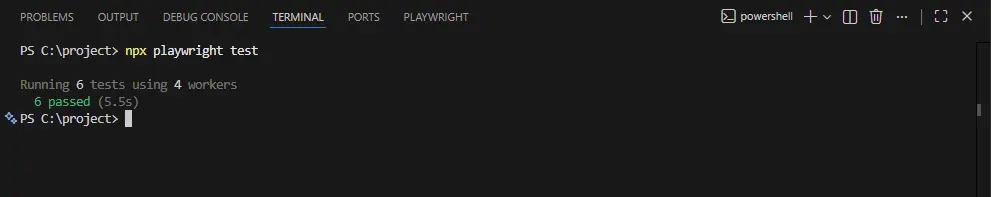
Dot reporter
The Dot reporter displays a dot for each test. Green for passes and red for failures, and is best suited for CI pipelines where minimizing log size is more important than detailed output.
For example, the output might look like .....F.. in the command line, making it easy to spot failures at a glance.
This concise format is especially useful for parallel test execution in CI environments, where multiple test runs are happening simultaneously and quick identification of issues is critical.
export default {
  reporter: 'dot',
};
HTML reporter
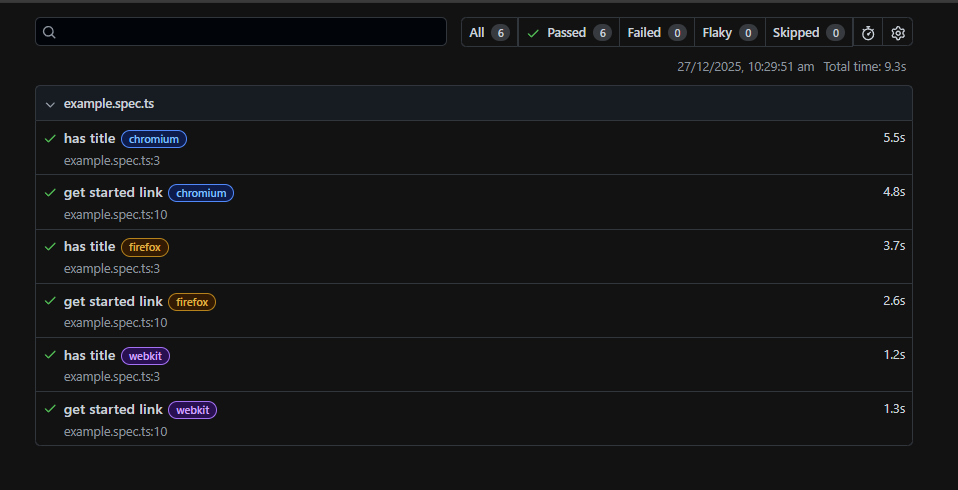
The HTML reporter creates an interactive and detailed HTML report that displays test suites, steps, retries, screenshots, videos, and traces (when enabled), making it ideal for debugging failures and sharing comprehensive test results with the team.
The generated report is saved in the default 'playwright-report' folder, which organizes your test artifacts and allows for easy access and analysis of your detailed HTML reports.
export default {
  reporter: 'html',
};
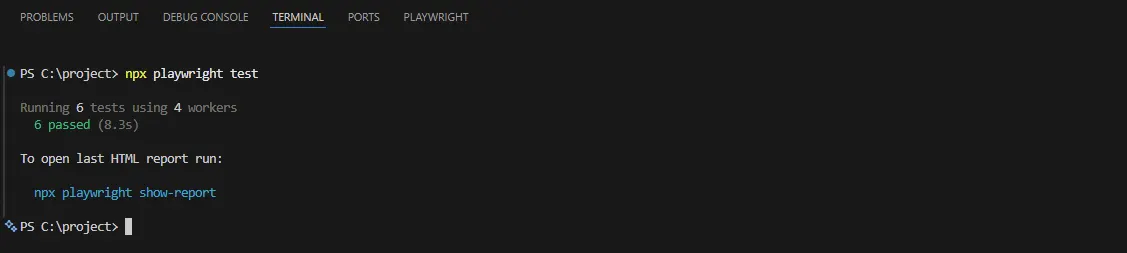
Open the report
npx playwright show-report
JSON reporter
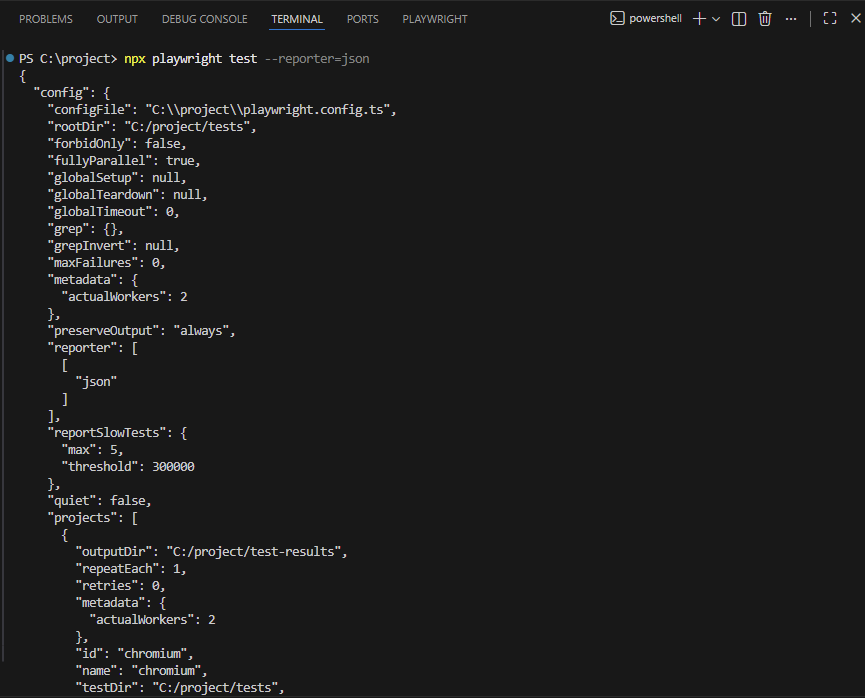
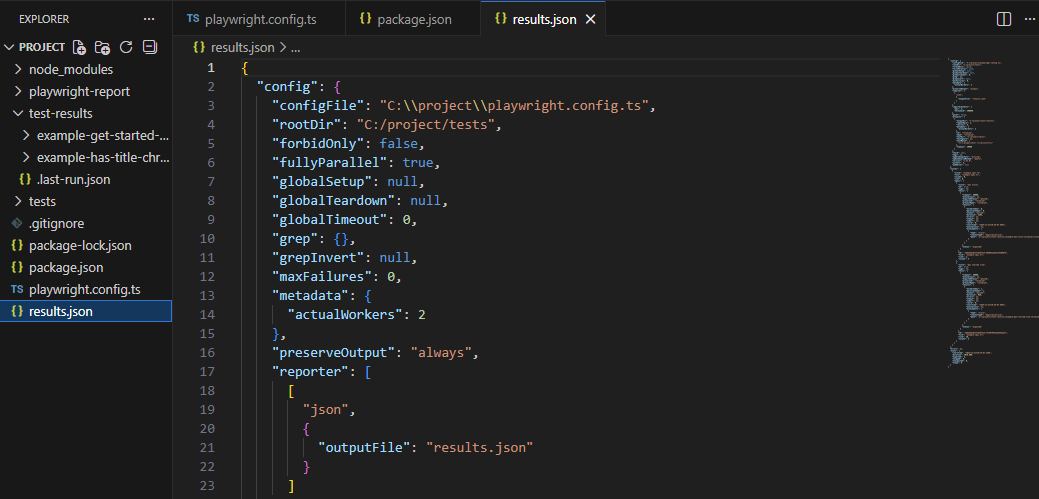
The JSON reporter outputs detailed test data, including timing and metadata, in JSON format, and is best used for custom dashboards, analytics, or integrations that consume structured test results.
You can generate a JSON report in terminal with playwright CLI command npx playwright test --reporter=json
You can save this report by adding following command in your config file
export default {
  reporter: [['json', { outputFile: 'results.json' }]],
};
JUnit reporter
The JUnit reporter outputs test results in XML format that is widely supported by CI systems, making it ideal for CI dashboards that track test summaries and trends over time.
You can get JUnit report in terminal using the Playwright CLI command npx playwright test --reporter=junit
And if you want to save the XML file, you can add this to your config file
export default {

  reporter: [['junit', { outputFile: 'junit.xml' }]],

};
Using Multiple Playwright Reporters
One of the strengths of Playwright reporting is that you are not limited to a single reporter. You can configure multiple reporters in the same test run, with each one serving a different purpose for developers, CI systems, or reporting tools.
A common real-world setup looks like this:
export default {
  reporter: [
    ['dot'],
    ['html', { outputFile: 'index.html' }],
    ['list'],
  ],
};
In this setup, the List reporter provides clear and readable output during local runs, the Dot reporter keeps CI logs compact, and the JSON reporter generates structured data that CI systems or dashboards can consume. All reports are produced from a single test run, so there is no need to rerun tests for different audiences.
This approach scales well from local development to CI pipelines and is suitable for most teams.
Playwright Traces
Reports tell you what failed. Traces show you how it failed.
A Playwright trace is a recorded timeline of a test run. It captures everything that happened during execution, including page actions, DOM state, network requests, console logs, and screenshots. When a test fails, traces let you replay the failure step by step instead of guessing from logs.
Traces are especially useful when:
-
A test fails only in CI but passes locally
-
A failure depends on timing or async behavior
-
Screenshots alone do not explain what went wrong
Instead of re-running tests with extra logging, you open the trace and see the exact sequence of events that led to the failure.
When and How to Enable Traces
When enabled, Playwright records trace data during test execution and saves it as an artifact that can be opened in the Playwright trace viewer.
Traces capture the full execution flow of a test and provide deeper context than logs, screenshots, or videos alone, making them especially useful for debugging complex or CI-only failures.
What a Playwright trace includes:
-
Actions and assertions executed during the test
-
DOM snapshots before and after each step
-
Network requests, responses, and console logs
-
Screenshots tied to execution steps
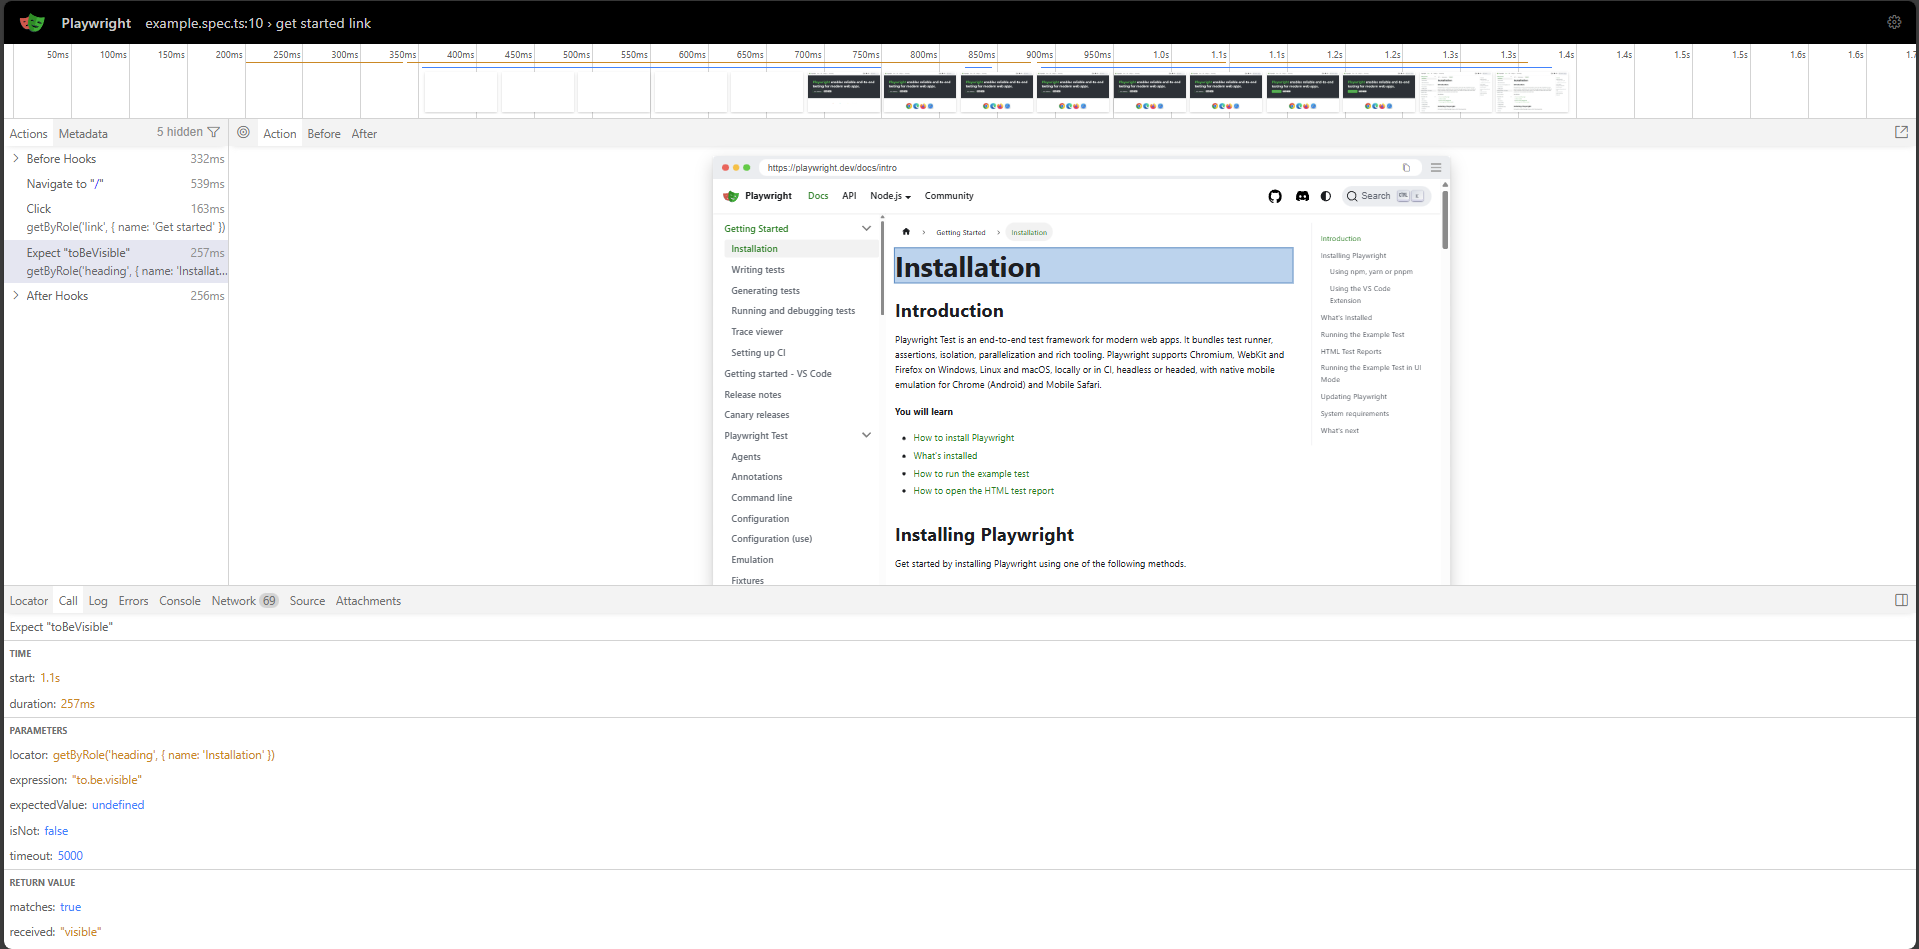
Traces work alongside reporters, not as a replacement. Reporters identify which test failed, screenshots and videos show what the page looked like, and traces explain why the failure occurred by replaying the exact sequence of events.
In CI, traces are usually stored as artifacts or uploaded to reporting tools as part of a complete debugging workflow.
Custom Playwright Reporters
Built-in reporters are usually enough, but when teams need custom output or integration with internal systems, Playwright allows you to create custom reporters. A custom reporter hooks into the test run and lets you process results in your own way without changing how tests are written or executed.
Simple Custom Reporter Example
import type { Reporter, TestCase, TestResult } from '@playwright/test/reporter';
import fs from 'fs';

class SimpleReporter implements Reporter {
  onTestEnd(test: TestCase, result: TestResult) {
    fs.appendFileSync(
      'Report.txt',
      `${test.title} ${result.status} in ${result.duration}ms\n`
    );
  }
}

export default SimpleReporter;
Register the Custom Reporter
export default {
  reporter: [['./custom-reporter.ts']],
};
Output:
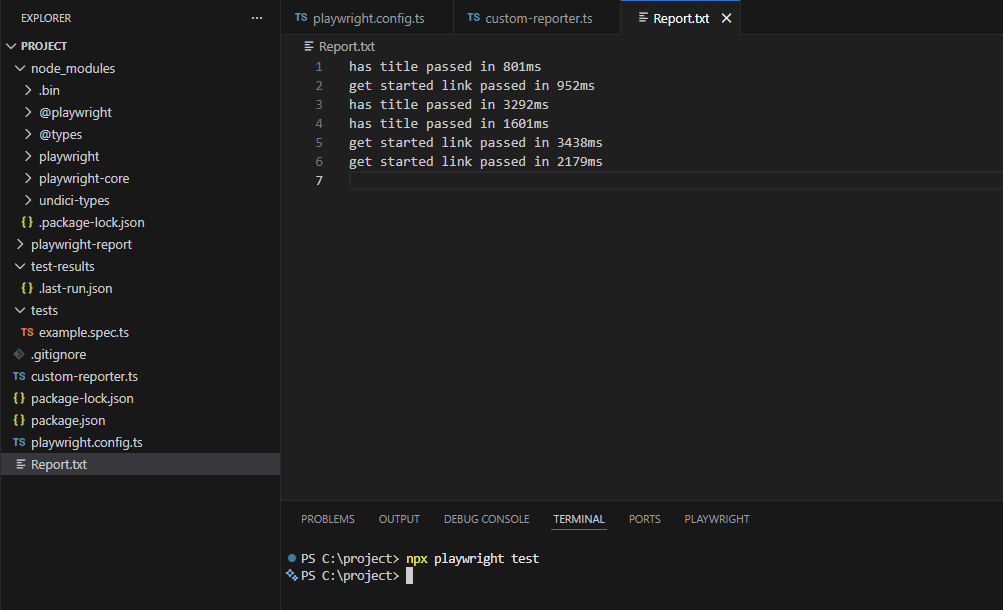
custom-reporter
When tests run, the custom reporter writes one line per test to Report.txt, including the test name, status, and execution time.
Third-Party Reporters in Playwright
Built-in and custom reporters work well for individual runs and single pipelines, but as test suites grow, teams often need more visibility. Third-party Playwright reporters focus on long-term insights such as test history, trends across branches, and overall test health.
Playwright has a strong reporting ecosystem, with community tools curated in the Awesome Playwright repository. These tools build on top of Playwright's existing outputs rather than replacing them.
Tools like TestDino consume Playwright's JSON or HTML reports and turn them into centralized dashboards showing test runs, failures, screenshots, and trends over time.
TestDino is a Playwright test reporting and analytics platform that turns raw test results into an interactive web dashboard for streamlined test management and access to detailed test reports for each run.
Your team can view test runs, failures, screenshots, and AI insights in one place instead of relying on console logs or local HTML files.
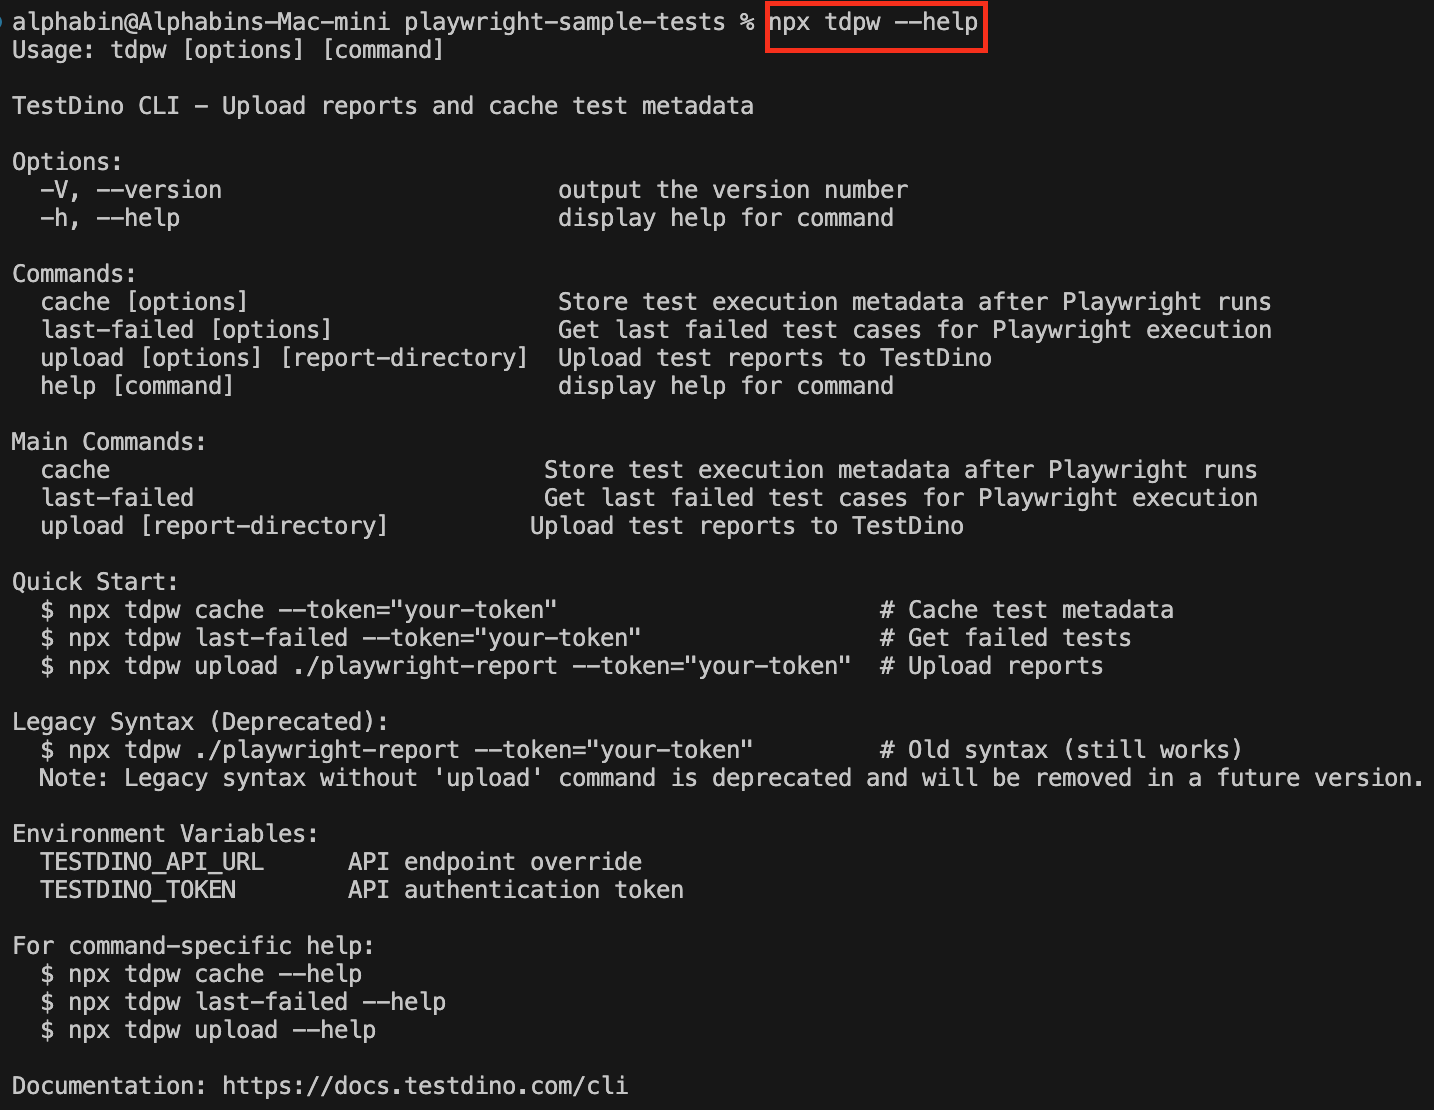
1. Install & Check the TestDino CLI
TestDino provides a CLI called tdpw. You can use it via npx.
npx tdpw --help
2. Configure Playwright Reporters
TestDino uses Playwright's JSON report (HTML is optional but recommended).
Add this to playwright.config.js or playwright.config.ts:
reporter: [
  ['json', { outputFile: './playwright-report/report.json' }],
  ['html', { outputDir: './playwright-report' }],
],
This creates:
-
JSON report: ./playwright-report/report.json
-
HTML report & assets: ./playwright-report/
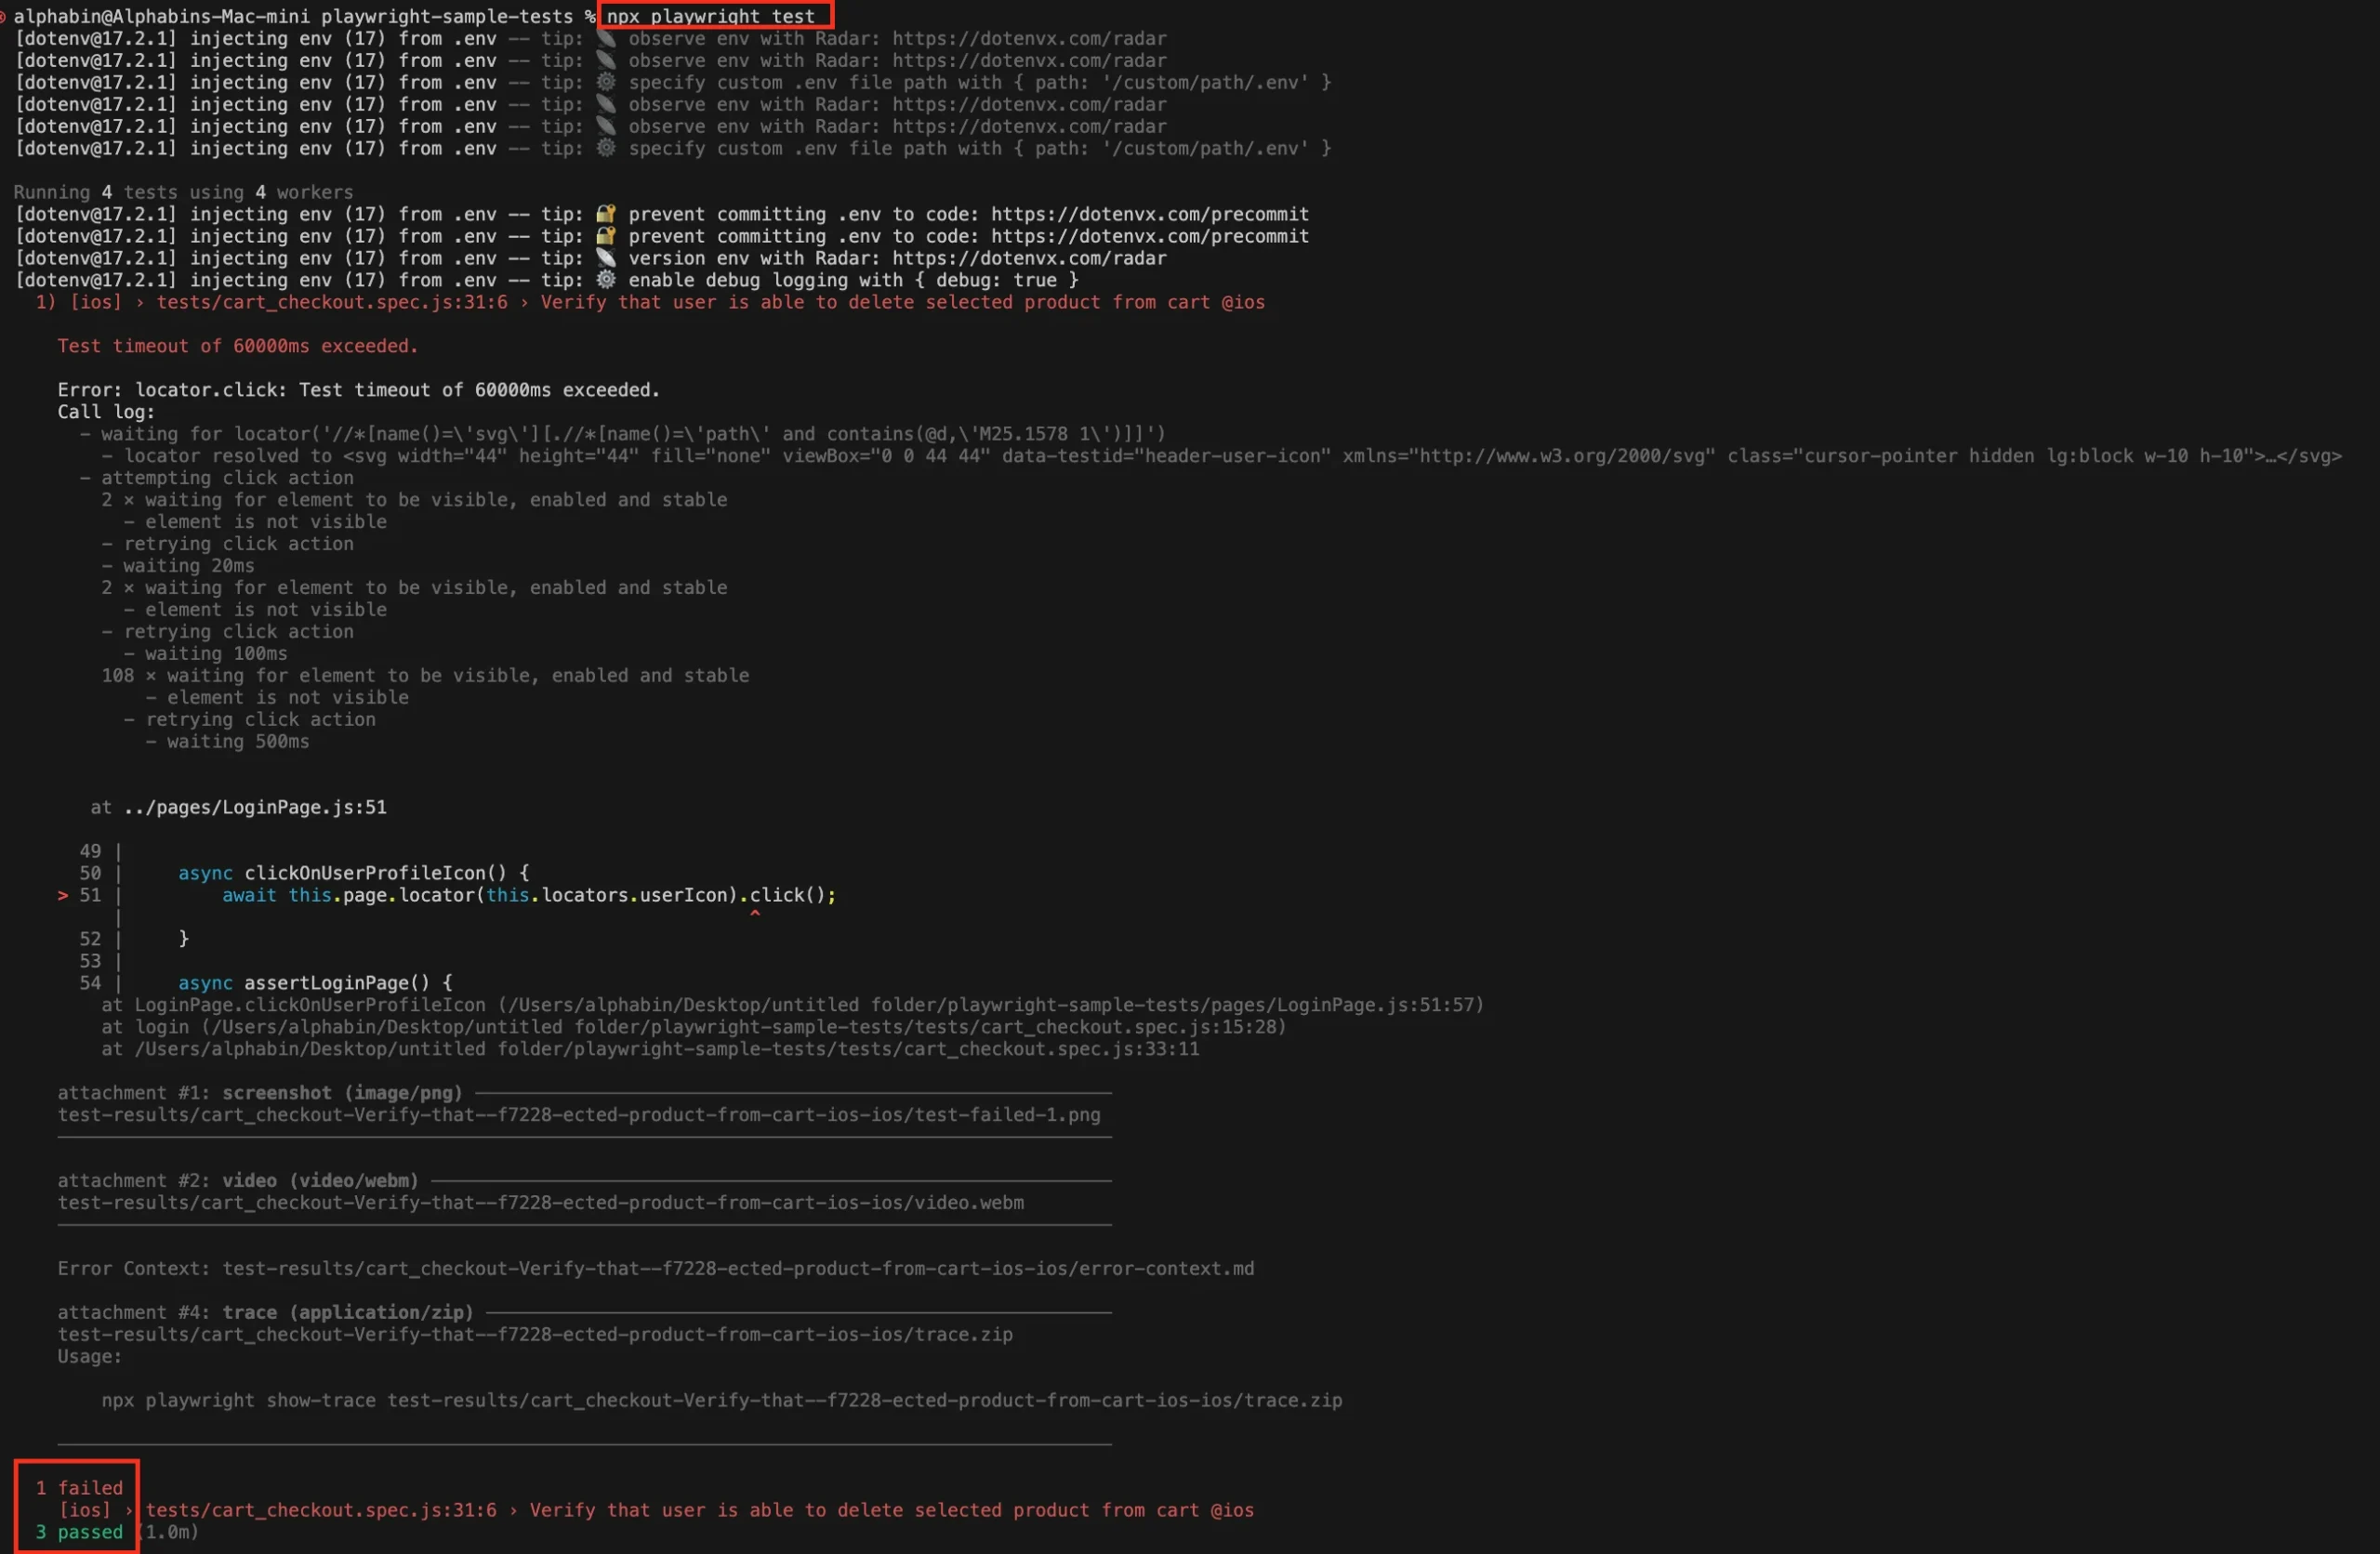
3. Run Tests Locally
Run Playwright as usual:
npx playwright test
4. Upload Reports from your machine
Upload the report directory to TestDino:
npx tdpw upload ./playwright-report --token="your-token" --upload-html
-
--token → your TestDino project token
-
--upload-html → uploads screenshots and HTML assets
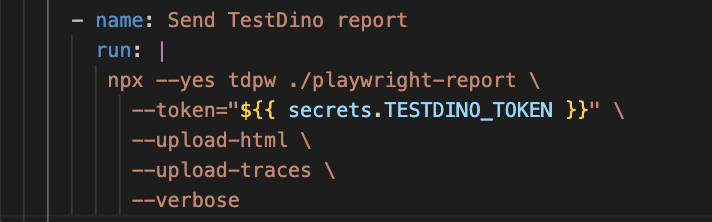
5. Upload Reports from CI
Store the token as a secret (TESTDINO_TOKEN).
name: Playwright Tests
on:
  push:
  workflow_dispatch:

jobs:
  test:
    runs-on: ubuntu-latest
    container: mcr.microsoft.com/playwright:latest

    steps:
      - uses: actions/checkout@v4

      - uses: actions/setup-node@v4
        with:
          node-version: '22.x'

      - run: npm ci
      - run: npx playwright install --with-deps
      - run: npx playwright test

      - name: Upload to TestDino
        if: always()
        run: npx tdpw upload ./playwright-report --token="${{ secrets.TESTDINO_TOKEN }}" --upload-html
if: always() ensures reports upload even if tests fail.
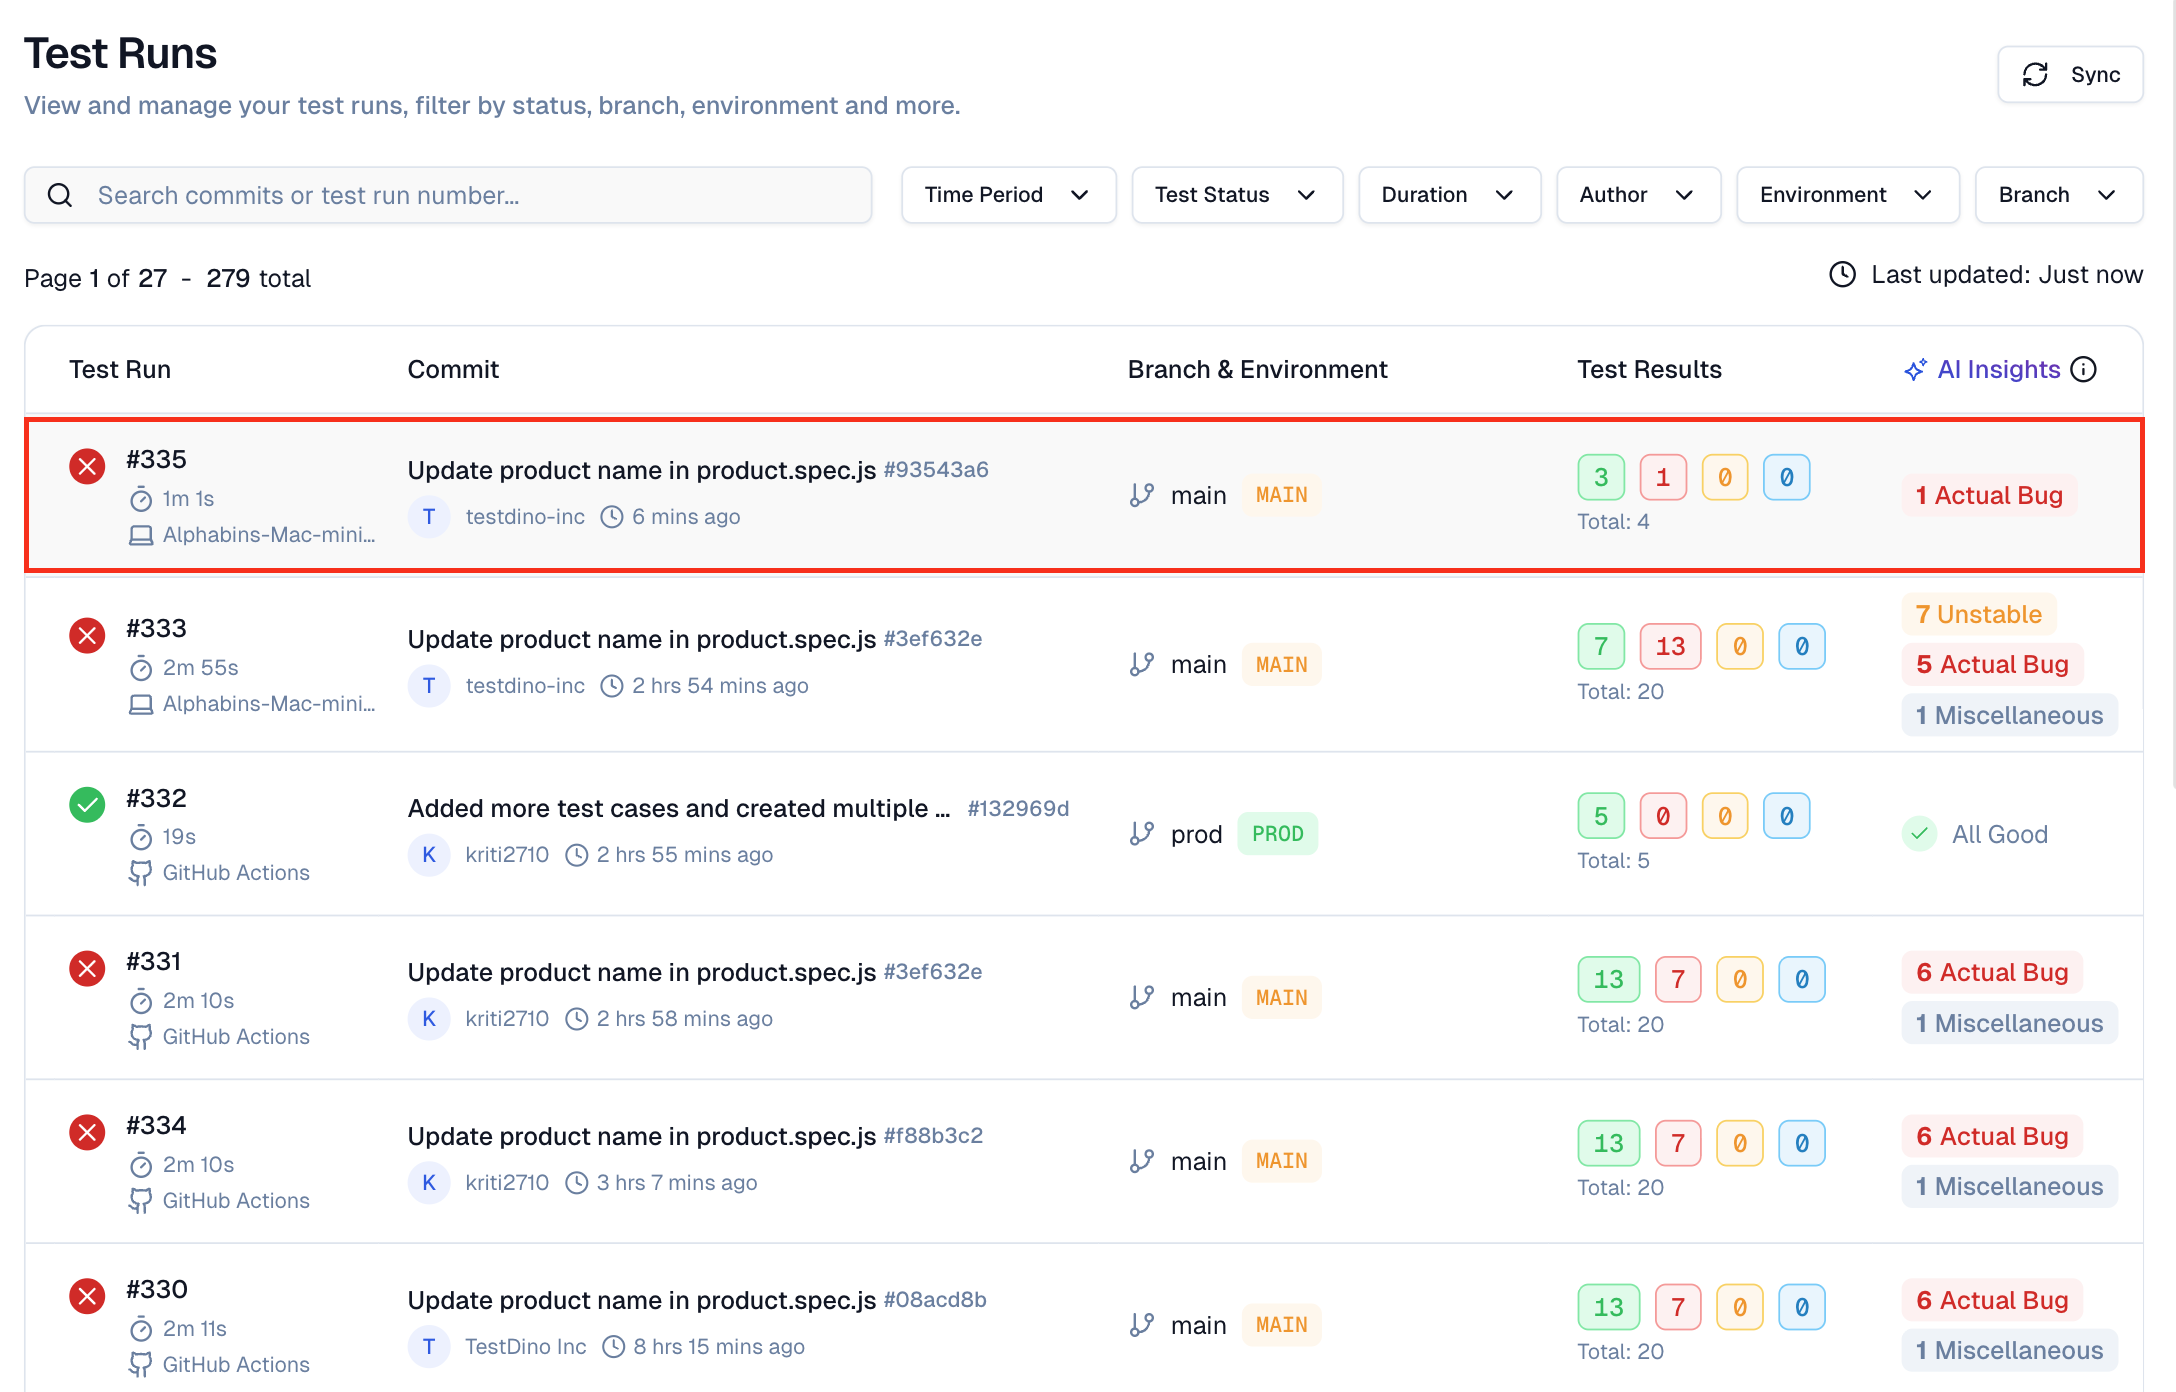
6. View Results in TestDino
In the TestDino dashboard, you'll see:
-
Test runs with pass/fail counts and duration
-
Filters by branch, author, or environment
-
Detailed test case results
-
Failure details: errors, stack traces, screenshots, traces
-
AI hints to identify flaky tests vs real issues

Over time, TestDino becomes a single source of truth for Playwright test health, turning reporting into a shared engineering signal rather than a local debugging artifact.
Choosing the Right Playwright Reporting Setup
The right Playwright reporting setup depends on where tests run and how results are consumed. Reporting should stay lightweight during development, structured in CI, and expandable as test suites grow.
A practical way to choose a setup:
-
Local development: Use List or Line reporters for readable output; enable the HTML report only when debugging.
-
CI pipelines: Use a compact console reporter like Dot and always generate JSON or JUnit for CI dashboards.
-
Larger test suites: Store HTML reports and traces as artifacts, usually only on failure.
-
Long-term visibility: Use tools like TestDino that consume Playwright's JSON or HTML reports to track history and trends.
This approach keeps reporting simple at the start and allows teams to scale visibility without changing how tests are written.
Common Mistakes in Playwright Reporting
Playwright provides powerful reporting features out of the box, but teams often lose their benefits due to poor configuration or over-engineering. Most reporting issues are not caused by the framework itself, but by how reports are generated, stored, or reviewed.
Common mistakes to avoid:
-
Relying only on HTML reports: HTML reports are great for debugging but insufficient for CI dashboards or automation without JSON or JUnit outputs.
-
Enabling all artifacts for every test: Recording traces, screenshots, and videos for every run increases storage usage and slows pipelines unnecessarily.
-
Hiding flaky tests behind retries: Retries can keep CI green but often mask unstable tests if failures are not reviewed regularly.
-
Not reviewing reports consistently: Reports provide value only when teams actively check failures and trends.
-
Overcomplicating reporting too early: Adding custom or third-party tools before they are needed creates noise without clear benefits.
Avoiding these mistakes helps keep Playwright reporting fast, reliable, and genuinely useful as test suites scale.
Troubleshooting Playwright Reporting Issues
When Playwright reports are missing or incomplete, the issue is usually related to configuration or CI behavior rather than the tests themselves.
Start by confirming that the correct reporters are enabled and that no CLI flags or environment variables are overriding your playwright.config settings.
In CI, reports may be generated but written to unexpected locations or removed before artifacts are collected. Checking the working directory after test execution and verifying artifact upload steps often reveals the problem.
Differences between local and CI environments can also affect reporting, so running the same command locally with CI settings helps isolate issues quickly.
Best Practices for Playwright Reporting at Scale
-
Keep local reporting simple so developers get quick feedback while running tests.
-
Always generate JSON or HTML reports in CI so tools and pipelines can read the results.
-
Don't enable screenshots, videos, and traces for every run; turn them on only when needed to avoid slow builds.
-
Make sure reports are saved or uploaded in CI even when tests fail, so failure details are not lost.
-
Review failed and flaky tests regularly instead of relying only on retries.
-
Use the same reporting setup in local and CI environments to avoid confusion.
-
Use Playwright reports to debug individual test runs.
-
When test suites grow and you need history, trends, or flaky test tracking, use a tool like TestDino to centralize and analyze Playwright reports over time.
Conclusion
Playwright reporting turns test runs into clear signals your team can trust. With the right mix of built-in reporters, custom logic, and CI-friendly outputs, failures become easier to understand and faster to fix.
Start simple, then scale your reporting as your test suite grows. Use Playwright for accurate run-level insight, and bring in tools like TestDino when you need centralized visibility, trends, and long-term test health.
When reporting is done right, tests stop being noise and start guiding confident releases.
FAQs
Table of content
Flaky tests killing your velocity?
TestDino auto-detects flakiness, categorizes root causes, tracks patterns over time.
Follow Us