9 Best Flaky Test Detection Tools QA Teams Should Use in 2026
Explore the best flaky test detection tools of 2026. Learn how to identify and resolve flaky tests quickly to improve QA reliability.


Flaky tests waste 6 to 8 hours of engineering time every week. They block CI pipelines, trigger false alarms, and force teams to rerun builds multiple times just to get a green light.
Poor software quality costs US organizations an estimated $319 billion, with testing identified as the weakest link. When teams can't trust their tests, they either waste time investigating false failures or, worse, ignore real issues that slip through.
In this guide, we’ll compare the best flaky test detection tools available in 2026, highlighting which ones will help you ship faster.
Why Flaky Test Detection Matters?
A flaky test is any test that passes and fails intermittently without code changes. Simple definition, expensive problem.
Why does this matter?
- You can't trust them. Neither the system under test nor the test itself is reliable.
- They block CI/CD pipelines. A random failure can hold up an entire release.
- They're expensive. Engineering time spent investigating false failures adds up fast.
- Real issues hide behind them. When everything looks flaky, actual bugs get ignored.
Most flaky test detection tools work by tracking retries. When a test fails on the first attempt but passes on retry, it gets flagged as flaky. To reduce flaky tests, some software tracks patterns across multiple runs or correlates failures with environment signals.

Top Flaky Test Detection Tools
These nine platforms represent the most effective solutions for detecting and managing flaky tests in 2026. Each brings unique strengths to the challenge of identifying intermittent test failures.
9 Best Flaky Test Detection Tools
1. TestDino
Best for:
Playwright teams, startups, and QA teams looking to optimize CI time with reliable flaky test detection and role-based dashboards.
About TestDino:
TestDino is a Playwright-first test reporting and test management platform designed to support teams at different levels of CI maturity. It offers two reporting approaches, allowing teams to start simple and adopt more advanced capabilities as their CI usage grows.
- Native JSON/HTML upload = simple, post-run reporting with minimal change
- TestDino custom reporting = richer metadata + real-time updates + CI controls for teams operating at scale
What makes TestDino different is that it doesn't just flag tests as "flaky." Its flaky test detection tells you why they're flaky and helps you fix them faster with MCP support.
How TestDino detects flaky tests:
TestDino's flaky test detection identifies unstable tests in two ways:
- Within a single run: When a test that fails initially but passes on retry is marked flaky. The retry count appears in the test details.
- Across multiple runs: Tests with inconsistent outcomes on the same code are flagged. TestDino's flaky test detection tracks pass/fail patterns and calculates a stability percentage.
TestDino then classifies flaky tests by root cause:
- Timing-related: Race conditions, animation waits, polling intervals
- Environment dependent: CI runner differences, resource constraints
- Network dependent: API timeouts, rate limits, service availability
- Assertion intermittent: Dynamic data, timestamps, random values
- Other: Unstable for reasons outside the above
Where to find flaky tests:
| Location | What it shows |
|---|---|
| Dashboard → QA View | Most flaky tests in the selected period |
| Dashboard → Developer View | Flaky tests by the author |
| Analytics Summary | Flakiness trends over time |
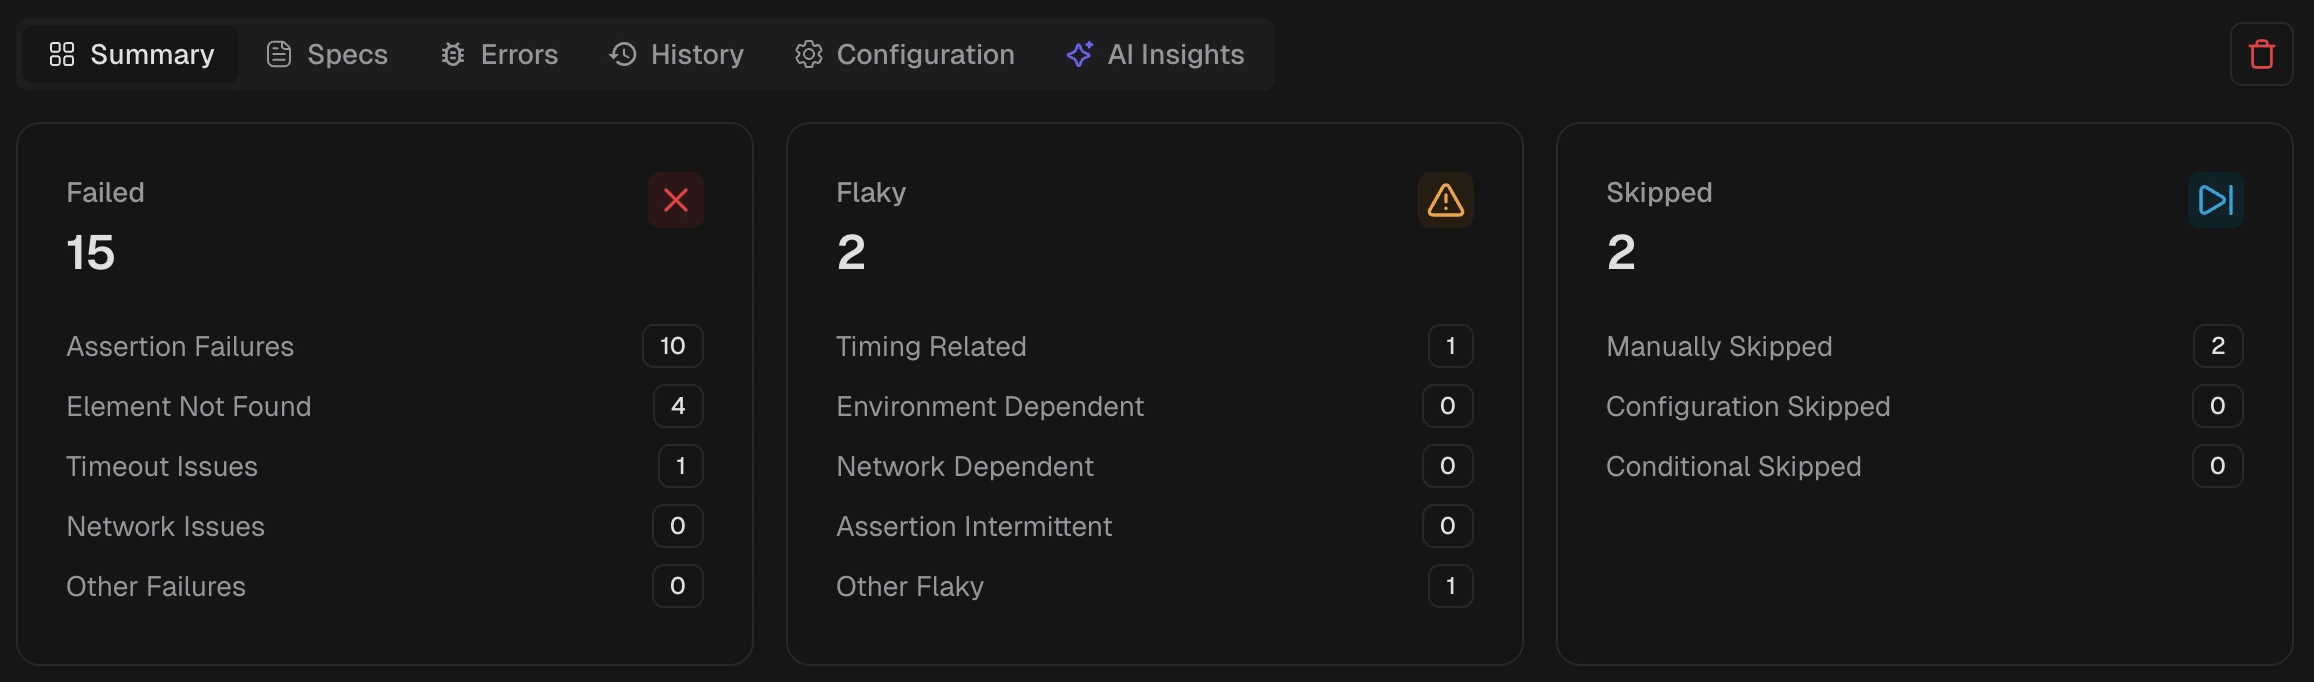
| Test Runs Summary | Flaky counts by category |
| Test Case History | Stability percentage |
| Specs Explorer | Flaky rate per spec file |
Key features:
- Role-based dashboards: QA sees flaky tests ranked by impact. Developers see tests they authored. Managers see trends.
- PR-aware workflow: Shows test status per pull request with AI-generated summaries posted to GitHub. You can filter to view only the PRs with test runs.
- Evidence collection: Screenshots, traces, videos, logs, and console output for each attempt.
- MCP server: Ask your AI assistant to debug failures, find flaky tests, or create test cases.
- Smart Rerun Detection: Groups reruns by branch & commit with full attempt history tracking, so you see the complete picture across retries.
- Scheduled PDF reports: Automated reports delivered by email with flexible scheduling, multiple recipients, and customizable time windows.
- Execution Pool Allocation: Organization-level execution limits with automatic borrowing between projects, real-time usage tracking, and a pool dashboard to reduce wasted capacity.
- Integrations: GitHub, Slack, Jira, Linear, Asana, monday, Azure DevOps, TeamCity.
- CI optimization: Rerun only failed tests to reduce CI pipeline time & cost.
- Branch Environment Mapping: Map branches to environments (dev, staging, production) so trends and failures stay comparable across your workflow.
- Adaptive failure classification: Categorizes failures as Actual Bug, UI Change, Unstable Test, or Miscellaneous.
- Test case management: Manual and automated test documentation in one system.
For more on debugging flaky tests, see our guide on root cause analysis.
Strengths:
- Simple setup: enable Playwright's JSON reporter and upload from CI.
- AI classifies failures by type, not just "flaky" or "not flaky."
- Role-based views give each team member the right context.
- PR comments with AI summaries keep reviewers and developers informed.
- GitHub CI Checks with Quality Gates let you block merges when flaky rate exceeds your threshold, preventing unstable code from shipping
- One-click issue creation with prefilled context.
- Calculates each test's failure rate and flaky rate over recent runs, surfacing intermittent failures before they pile up
Areas to improve:
- Currently supports Playwright only. Other frameworks coming later.
Standout Capability:
ML-based failure categorization with smart fix suggestions. Essentially a "senior developer in a box" that learns from test logs to instantly identify flaky tests and provide actionable next steps.
Pricing:
| Community (Free) | Pro | Team | Enterprise |
|---|---|---|---|
| 5,000 executions/mo | $49/mo | $99/mo | Custom |
| 1 project, 1 user | 25,000 executions, 5 users | 75,000 executions, 30 users | Custom limits + SLA |
Try it: Check out the sandbox to see how it works.
2. Currents
Best for:
Teams running large Playwright suites that need speed and stability.
About Currents:
Currents is a cloud-based reporting solution for Playwright that stores and visualizes all test artifacts. It provides historical analysis and debugging tools while offering intelligent test orchestration for faster execution.
How it detects flaky tests:
- Currents uses Playwright's built-in retry mechanism for instant flaky detection.
- When a test fails on the first attempt but passes on retry, Currents immediately badges it as flaky.
- When a test fails on the first attempt but passes on retry, Currents immediately badges it as flaky.
Strengths:
- Comprehensive artifact storage with logs, screenshots, and traces in one place.
- Native parallel test orchestration balances test chunks across runners for 50% speed improvement.
- Quarantine capability isolates flaky tests from blocking pipelines.
Areas to Improve:
- Supports only JavaScript-based frameworks (Playwright/Cypress) with no support for other languages.
- No free tier or self-hosted option available, which may deter smaller teams or those with strict data residency requirements.
- Limited integrations beyond CI/CD - lacks native connections to popular issue trackers like Jira or project management tools.
Standout Capability:
Integration of cloud dashboard with built-in Playwright orchestration and flaky test quarantining. Few tools combine instant flaky detection with test balancing and rich trace capture.
Pricing:
It offers two plans: Team ($49/month for 10k test results and up to 10 users; $5 per extra 1k) and Enterprise (custom). This fits Playwright/Cypress teams that outgrow basic storage; it might not suit you if costs need to stay flat as volume spikes.
3. Trunk.io
Best for:
Large codebases that need to keep CI green while fixing flaky tests.
About Trunk.io:
Trunk is a language-agnostic test stability platform for eliminating flaky tests. It aggregates results from multiple CI systems and provides analytics on test stability trends with ticketing system integration.
How it detects flaky tests:
- Trunk detects flaky tests through statistical analysis of CI results across multiple runs of the same commit.
- When a test's final status differs between runs on stable branches, Trunk flags it as flaky.
- The system needs approximately 10 historical runs per test to establish confidence.
Strengths:
- Universal support works across all languages, test frameworks, and CI providers.
- AI-powered failure clustering groups similar failures and tracks stability score trends.
- Auto-quarantine feature with automatic GitHub issue creation ensures flakes are tracked and fixed.
Areas to Improve:
- Requires significant historical data (10+ runs per test) before accurate flaky detection begins, delaying initial value.
- No built-in test execution capabilities - only analyzes results from other tools, requiring additional infrastructure
- A complex pricing model based on test volume and team size that can become expensive for large test suites.
Standout Capability:
Flaky-test focus that detects, quarantines, and auto-triages flakies for any test suite. The combination of AI clustering and seamless issue integration across all languages and frameworks is unique.
Pricing:
Three tiers - Free ($0 for up to 5 committers), Team ($18 per committer/month), and Enterprise (custom). Per-committer pricing scales with team size, which may not be ideal if you prefer fixed org-level fees.
4. Datadog
Best for:
Organizations that need policy, alerts, and trends across many repos.
About Datadog:
Datadog CI Visibility extends Datadog's observability platform into CI/CD testing. It correlates test results with logs, metrics, and traces across services for comprehensive debugging and monitoring.
How it detects flaky tests:
- Datadog automatically tags tests as flaky when they show both passing and failing statuses for the same commit across multiple runs.
- Its Early Flake Detection feature proactively retries new tests up to 10 times. Any failure during these retries immediately marks the test as flaky.
- The system distinguishes between new flaky tests (just started flaking) and known flaky tests (recurring issues).
Strengths:
- Quality Gates prevent flaky or failing code from shipping automatically.
- Enterprise-scale monitoring across multiple repositories and services.
Areas to Improve:
- Enterprise pricing can exceed $100K annually for large organizations, making it inaccessible for smaller teams.
- Steep learning curve with complex setup requiring instrumentation across multiple services and frameworks.
- Limited standalone value, most effective when already using Datadog's full observability suite, increasing total cost.
Standout Capability:
Unifying testing with full-stack observability. Test failures tie back into Datadog's metrics and tracing, providing end-to-end linkage of tests with production telemetry.
Pricing:
Datadog has Usage-based pricing, API tests start at $5 per 10,000 runs/month, browser tests at $12 per 1,000 runs/month, and mobile app tests at $50 per 100 runs/month (annual billing; higher on-demand). This suits data-driven teams already on Datadog; it might not be the best option if you want a simple seat price.
5. BrowserStack Test Observability
Best for:
Teams already on BrowserStack who want flaky detection and rich artifacts.
About BrowserStack Test Observability:
BrowserStack Test Observability is an analytics layer that aggregates results from all test frameworks and environments. It provides cross-browser/device visibility and integrates results from disparate CI systems into customizable dashboards.
How it detects flaky tests:
- BrowserStack uses AI-driven Smart Tags to automatically detect flaky tests by examining result histories across real devices and browsers.
- Any test showing inconsistent pass/fail outcomes over time gets tagged as "Flaky" automatically.
- The system analyzes patterns across different environments, browser versions, and device combinations.
Strengths:
- Tracks all automated tests (UI, API, or unit) in one place, not just BrowserStack runs
- Timeline debugging helps identify exactly when tests became flaky
- Quality gates and metrics let teams set pass/fail criteria on stability trends
Areas to Improve:
- Requires SDK integration for each test framework, adding maintenance overhead and potential compatibility issues.
- Separate pricing from BrowserStack's testing cloud means additional costs even for existing customers.
- Performance impact is reported when uploading large test suites with extensive logs and screenshots.
Standout Capability:
AI-powered failure diagnostics with enforceable quality gates. Not only highlights flaky tests but lets teams build custom gates that block merges based on stability criteria.
Pricing:
Free start plus paid tiers; exact prices are not public, so contact sales. Good fit if you already use BrowserStack and want a unified contract; less handy if you need published numbers for quick procurement.
6. TestMu AI
Best for:
Formerly known as LambdaTest. Teams running Selenium/Cypress/Playwright on LambdaTest that want AI flaky analytics.
About LambdaTest Test Analytics:
It utilizes machine learning to detect flaky tests within the TestMu AI cloud platform. It provides dashboards for flakiness trends, severity summaries, and error patterns.
How it detects flaky tests:
TestMu AI offers test intelligence with two ML-powered detection modes:
- Command Logs Mapping: Compares step-by-step logs across runs and flags tests with inconsistent command outcomes
- Error Message Comparison: Flags tests that fail with different error messages on separate runs
Tests need at least 10 runs to qualify for detection.
Strengths:
- Rich visualization with customizable dashboards for trends, severity, and group views.
- Integrated with TestMu AI’s testing cloud for cross-browser coverage
- Automatic prioritization of flaky tests based on impact and frequency.
Areas to Improve:
- Locked to the TestMu AI platform - cannot analyze tests run outside their cloud infrastructure.
- A minimum of 10 test runs is required before flaky detection activates, which delays insights for new or infrequently run tests.
- Limited customization options for flakiness thresholds and detection rules compared to dedicated tools.
Standout Capability:
End-to-end integration with the LambdaTest environment and AI insights. Automated flaky detection with trending dashboards inside the testing platform.
Pricing:
Overall platform pricing scales by parallel sessions; specific pricing for Test Intelligence/Analytics is not posted, so request a quote. Works well for teams standardizing on LambdaTest; may not suit buyers seeking analytics as a separately priced add-on.
7. ReportPortal
Best for:
Teams that want self-hosted analytics and ML triage.
About ReportPortal:
ReportPortal is an open-source automation dashboard that unifies historical test data across frameworks. It features customizable widgets and provides granular tracking of ongoing suite health with AI-assisted failure analysis.
How it detects flaky tests:
- ReportPortal identifies flaky tests through its Flaky Test Cases Table widget, which tracks status switches across launches.
- A test appears as flaky when its final status flips between Passed and Failed within your specified launch window (2-100 launches, default 30).
- The widget only considers the last retry status of each test. Once configured, the widget auto-updates to show your most unstable tests based on their flip frequency.
Strengths:
- Machine learning automatically triages failures and categorizes them by type.
- Easy integration with common CI tools and frameworks with strong automation support.
- Self-hosted deployment gives teams full control over data and customization.
Areas to Improve:
- Browser compatibility issues with UI working properly only on Chrome and Firefox, limiting accessibility.
- Performance degradation with large parallel test suites (1000+ concurrent tests) requires infrastructure scaling.
- Manual test support is incomplete, with missing features for test case management and environment configuration.
Standout Capability:
Open-source nature and customizability. It has dashboard customization and AI-assisted analysis with self-hosted flexibility.
Pricing:
SaaS offers Startup ($569/month), Business ($2,659/month), and Enterprise (custom); a free self-hosted community edition and on-prem support packages are also available. Managed SaaS suits teams that want hosting and SLAs, while small teams may find the Startup tier more than they need.
8. Microsoft Playwright Testing Preview
Best for:
Teams in the Microsoft/Azure stack running Playwright at scale.
About Microsoft Playwright Testing Preview:
Microsoft Playwright Testing Preview is a managed Azure service that abstracts away test infrastructure. It handles browser provisioning and artifact storage automatically while providing massive parallelization across browser/OS combinations.
How it detects flaky tests:
- Microsoft's service automatically marks tests as flaky using Playwright's native retry logic.
- Microsoft's service automatically marks tests as flaky using Playwright's native retry logic.
- Detection works automatically when you send run results to the service, with no additional setup beyond standard Playwright retries.
Strengths:
- No code modifications needed for existing Playwright suites.
- Built-in reporting captures failure details, videos, and traces automatically.
- Seamless integration with Azure DevOps and other Microsoft tooling.
Areas to Improve:
- Preview status with planned retirement on March 8, 2026, creating uncertainty about long-term viability and migration paths.
- Azure lock-in with no support for other cloud providers or on-premise deployment options.
- Limited features compared to mature tools - basic reporting without advanced analytics or AI-powered insights.
Standout Capability:
A cloud-native Playwright execution service. Scale Playwright tests in Azure by offloading execution to the cloud and managing all browsers/OS combinations automatically.
Pricing:
Their 30-day free trial includes 100 test minutes and 1,000 test results; afterward, pay-as-you-go per test minute and per 1,000 results. Best for Azure-centric teams; not ideal if you require a fixed monthly price cap.
9. Allure TestOps
Best for:
Teams that need sophisticated test management with manual flaky test muting.
About Allure TestOps:
Allure TestOps is a centralized quality management system that connects manual and automated test results into unified workflows. It automatically imports results to generate live documentation and dashboards while linking test runs to test cases and defects.
How it detects flaky tests:
- Allure TestOps identifies flaky tests through stability analytics rather than automatic tagging.
- It calculates each test's success rate over recent launches and surfaces intermittent failures in its "Top Test Cases" widget.
- You define the analysis window (time period or launch count), and Allure updates the unstable test report automatically.
Strengths:
- Works with popular CI servers, automatically publishing Allure-formatted reports.
- Unified manual and automated test handling in a single, consistent UI.
- Comprehensive test case management with requirement traceability.
Areas to Improve:
- Manual testing module limitations, including the inability to edit test results after execution or to predefine environments.
- Global configuration scope for custom fields causes confusion in multi-project organizations.
- Relatively high per-user licensing costs compared to alternatives, especially for large QA teams.
Standout Capability:
Automated linking of test results to test cases and documentation. Auto-creating manual test cases from automated runs ensures documentation is always up-to-date.
Pricing:
Their cloud starts at $39/user/month with volume discounts down to $30/user/month; Server is $39/user/month for 5–50 users, and larger deployments are custom. Per-user pricing suits organizations that align costs to active users.
How to choose the right flaky test detection tool
Here's a checklist to help you decide:
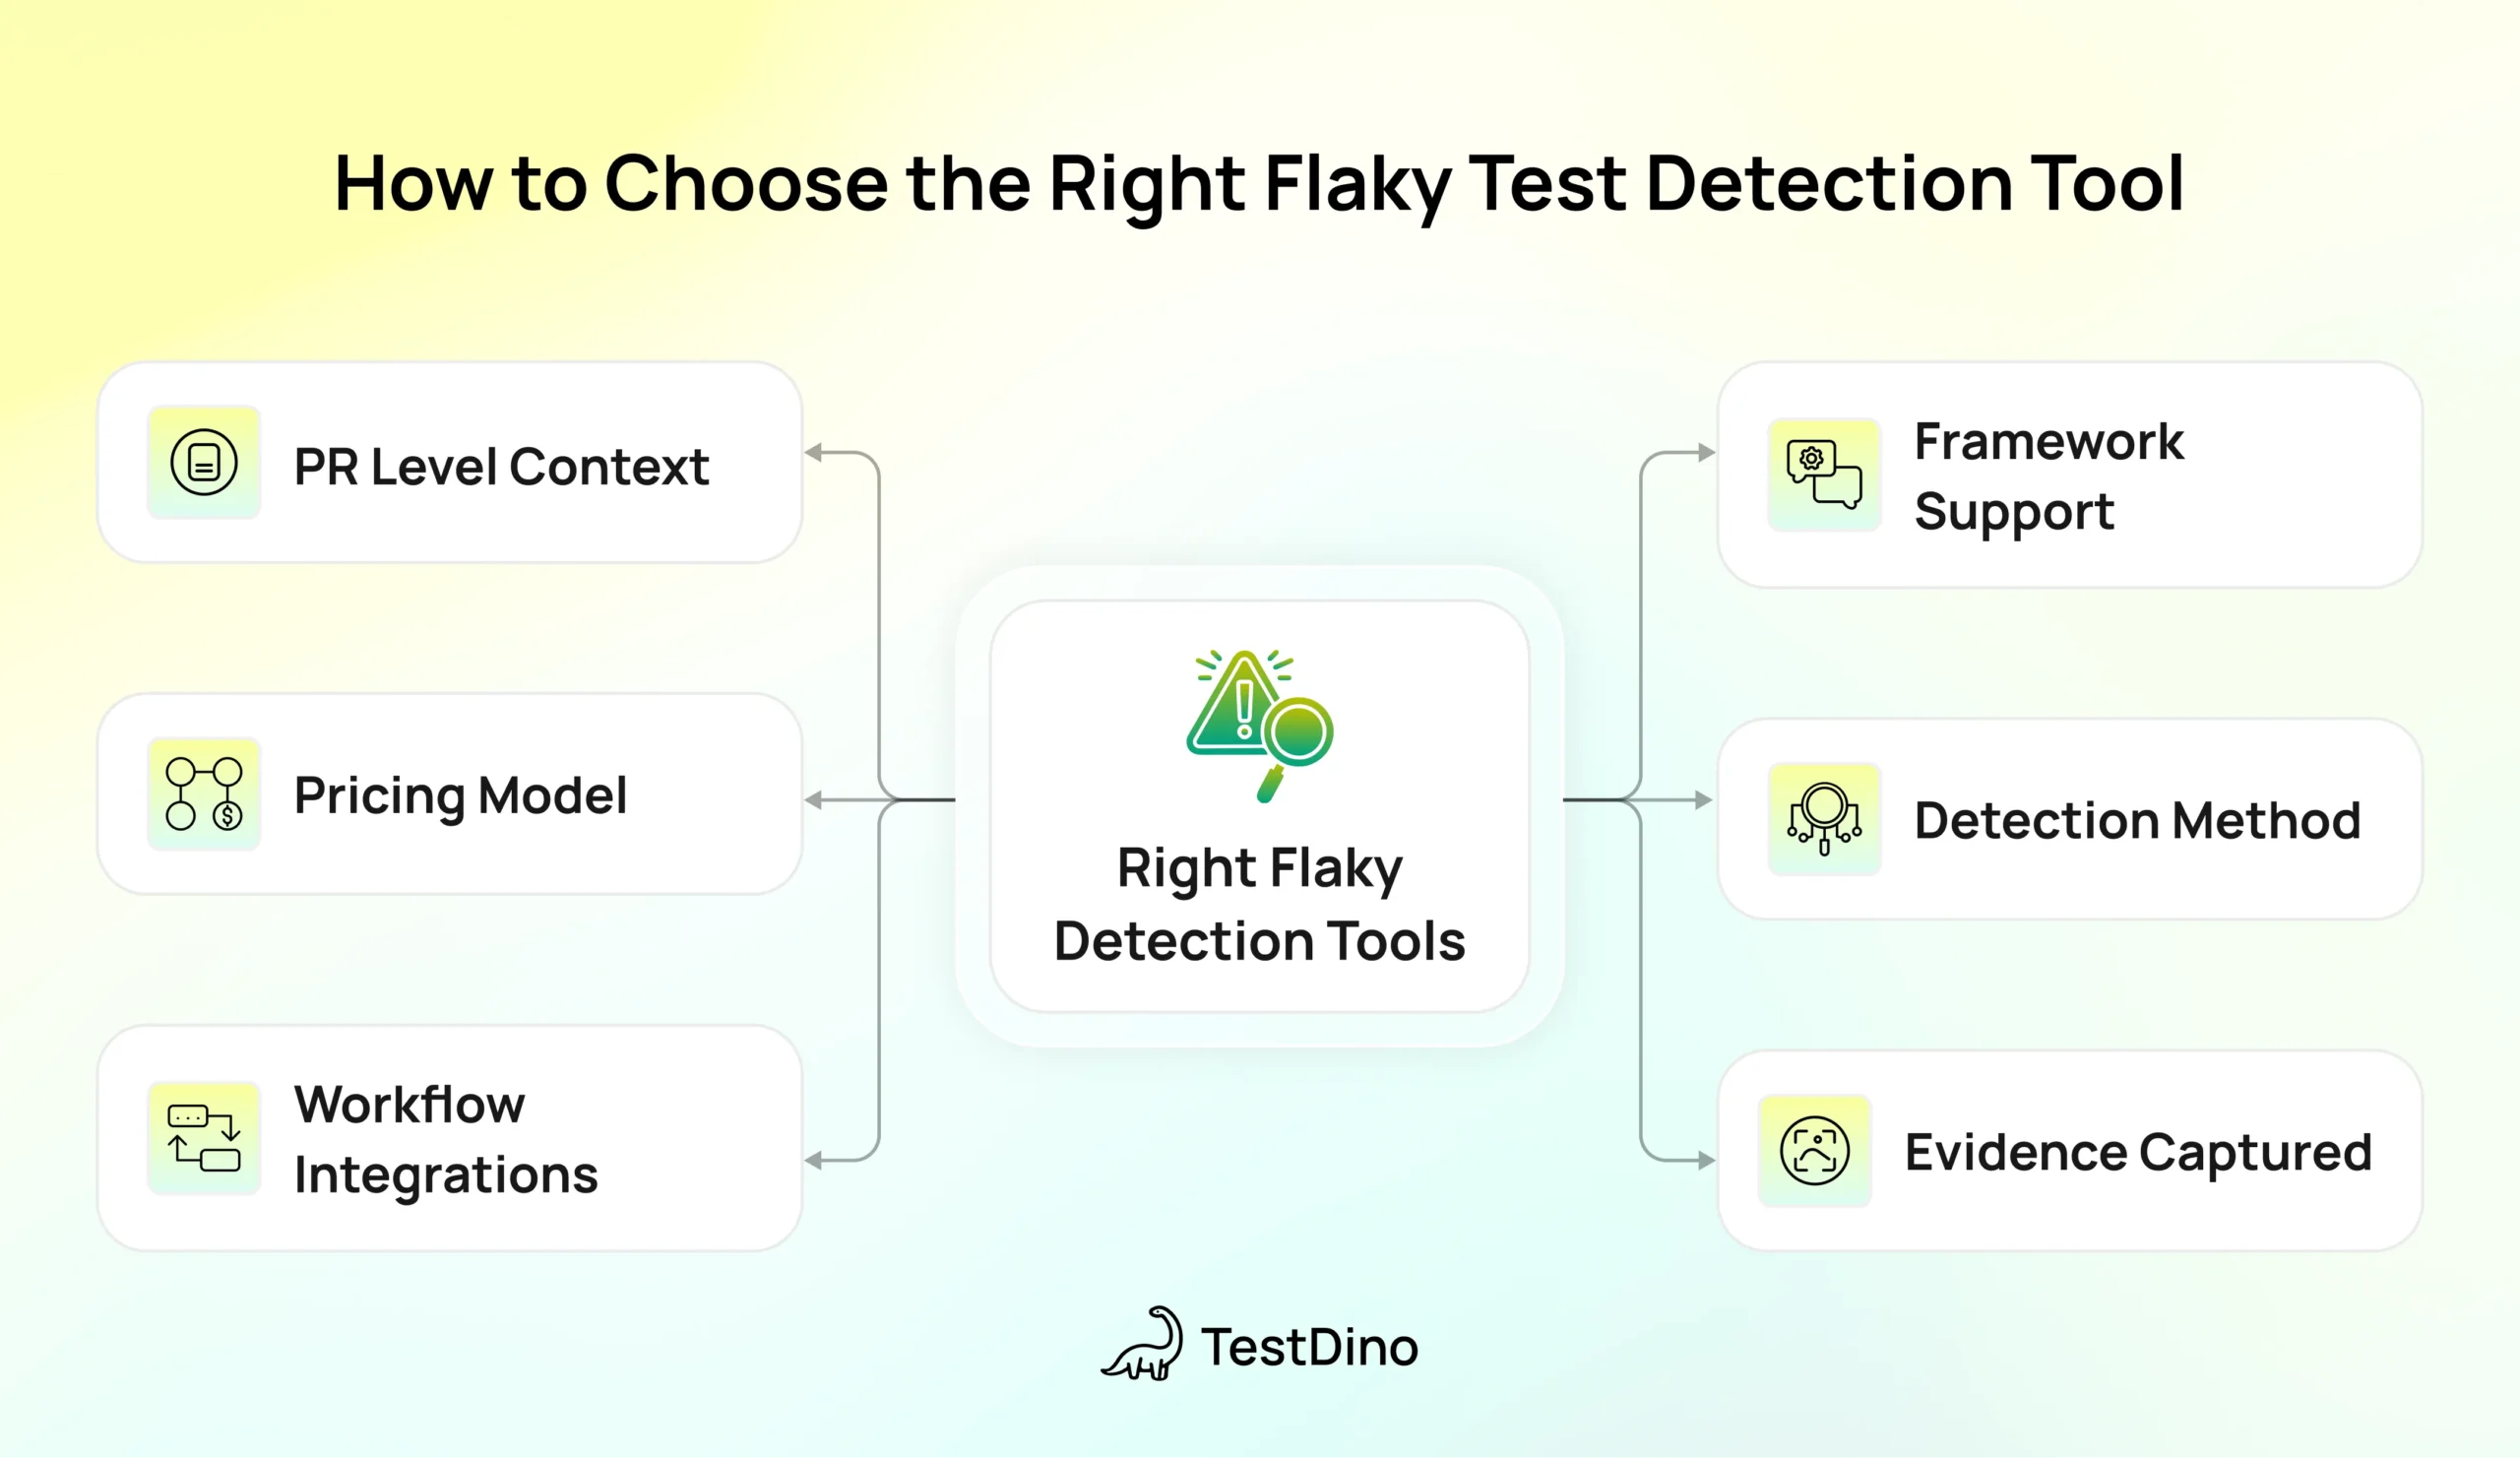
- Does it support your test framework? Some flaky test detection tools only work with Playwright or Cypress. Others support Selenium, JUnit, or multiple frameworks. Match the tool to your stack.
- What flaky test detection method fits your workflow? Retry-based flaky test detection is fast but limited. History-based flaky test detection is more thorough but needs data. Pick based on how quickly you need results.
- What evidence does it capture? Good flaky test detection tools show screenshots, traces, logs, and error messages for both passing and failing attempts. Without evidence, you can't debug.
- Does it integrate with your workflow? Check for GitHub/GitLab integration, Slack alerts, and issue tracker connections (Jira, Linear, Asana). Flaky test detection only works if the team actually sees the results.
- What's the pricing model? Some tools charge per test result, others per user or per committer. Calculate your expected volume before committing.
- Does it show PR-level context? Knowing which pull request introduced flakiness is crucial for identifying issues before they hit main.
Common reasons tests become flaky
Before you invest in tooling, understand why tests fail intermittently:
- Fixed waits instead of proper conditions. Using sleep(5000) instead of waiting for the page to be ready.
- Missing await. Steps run out of order because async operations aren’t properly handled.
- Weak selectors. Elements change or match more than one thing.
- Shared test data and interference from other tests. When tests are not properly isolated, their outcome is affected by other tests, resulting in unreliable results.
- Parallel collisions. The same user or record is used by multiple tests running simultaneously.
- Lack of synchronization mechanisms. Not using synchronization mechanisms to handle concurrency can cause race conditions and thread safety issues with shared resources.
- Network instability. Slow or unstable third-party APIs.
- Environment differences. CI setup is different from local runs.
For strategies to fix these, see our guide on managing Playwright flaky tests.
Why Choose TestDino For Flaky Tests Detection
You get clear signals on what failed and why, so triage is quick. Role-aware dashboards and PR views keep reviewers in flow. Setup is simple because it ingests Playwright's default output.
1. Ingest and label the run
- Reads the Playwright report from CI, builds a single Test Run with Passed, Failed, Flaky, and Skipped.
- Adds AI labels per failure: Unstable, Actual Bug, UI Change, or Miscellaneous.
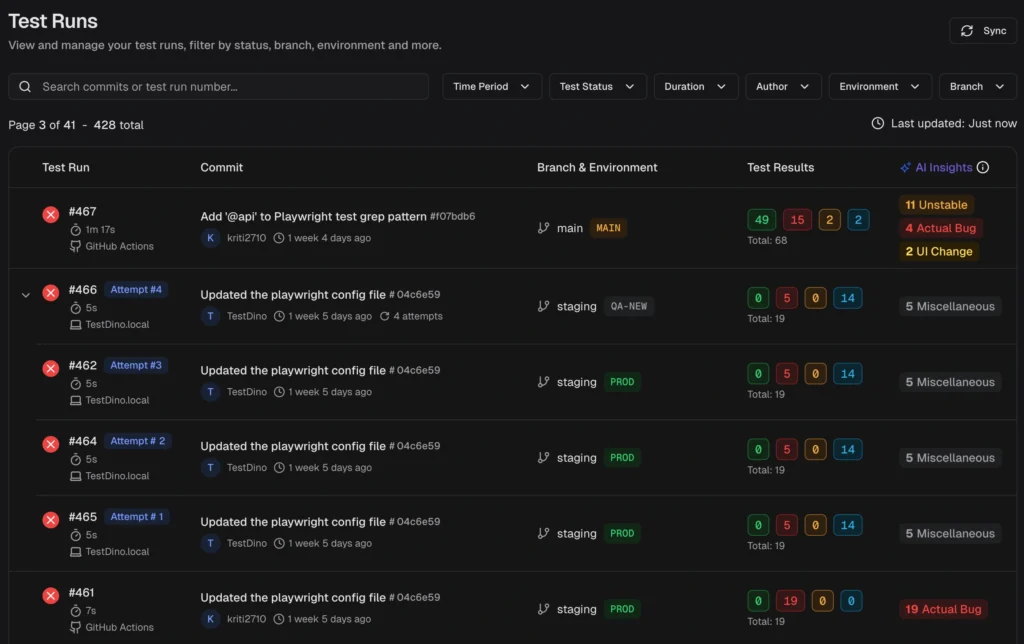
2. Group flaky tests by cause
- Splits flakies into Timing-related, Environment-dependent, Network-dependent, Intermittent assertion, and Other.
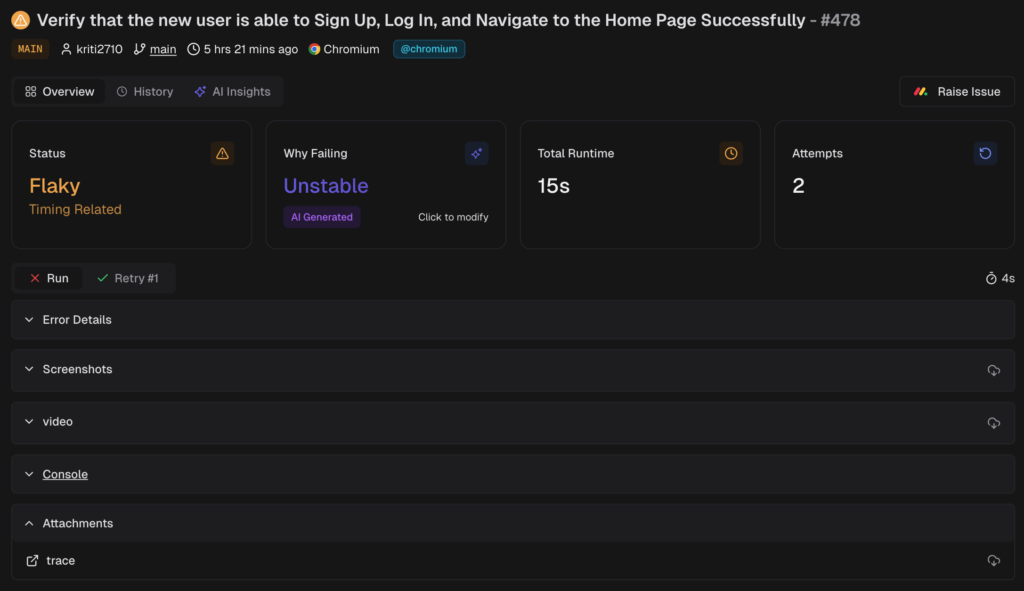
3. See attempts and evidence
- Shows each retry with its own error text, screenshots, and console. A pass after a fail on the same code is a strong flaky signal.
- Surfaces the primary reason, for example timeout or element not found
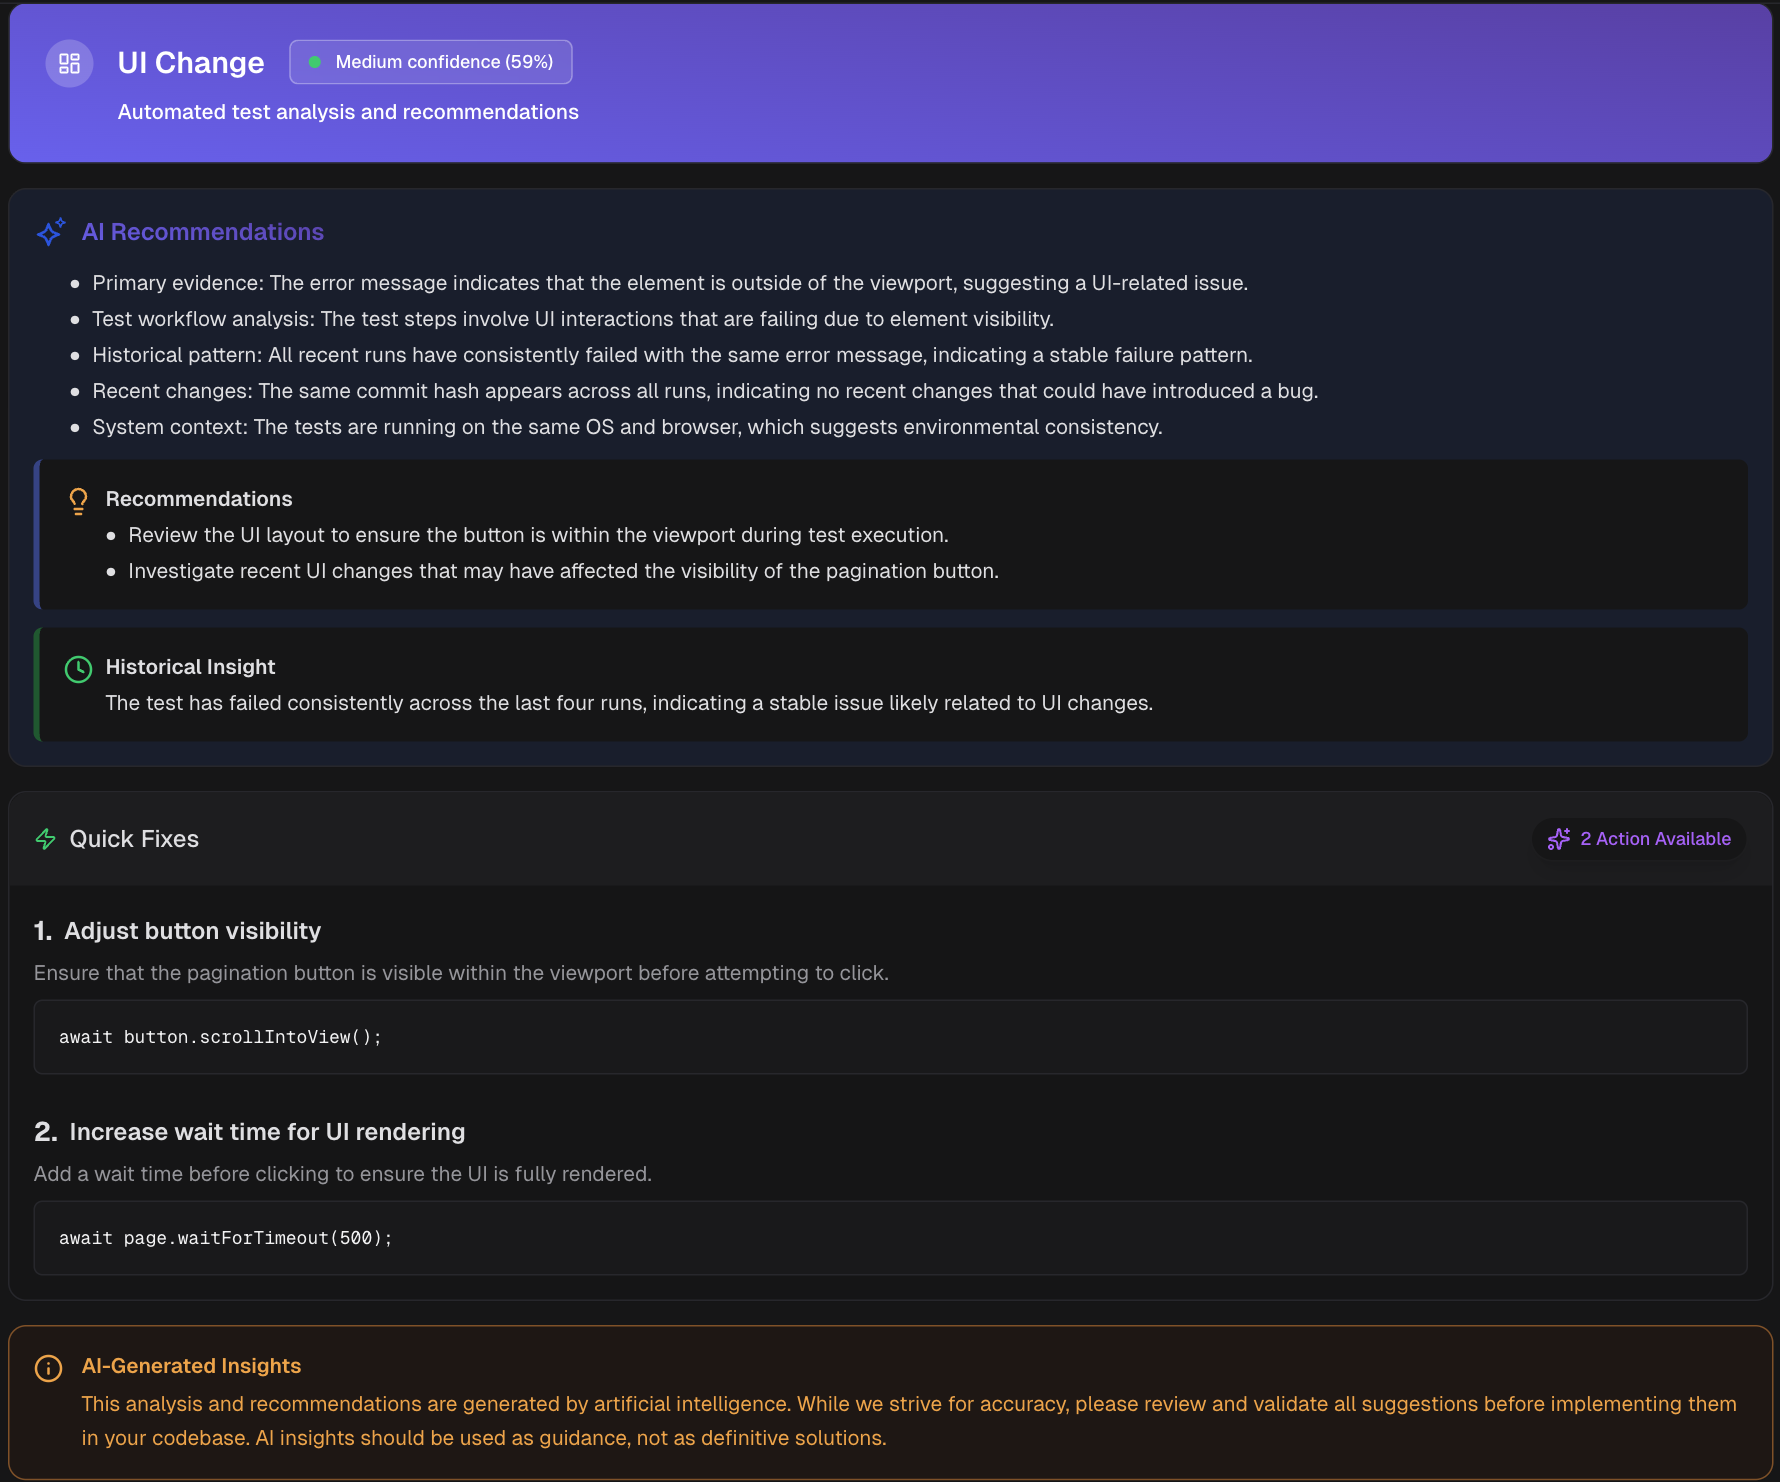
4. AI insights for fast triage
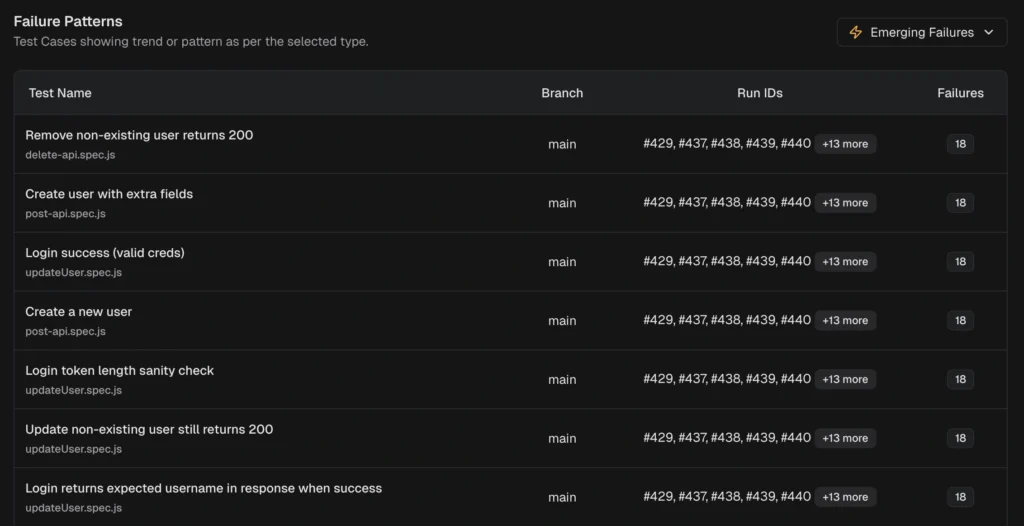
- Summarizes error variants, applies AI categories, and highlights emerging and persistent failures
- The test-case view shows category + confidence score with recommendations, and recent history.
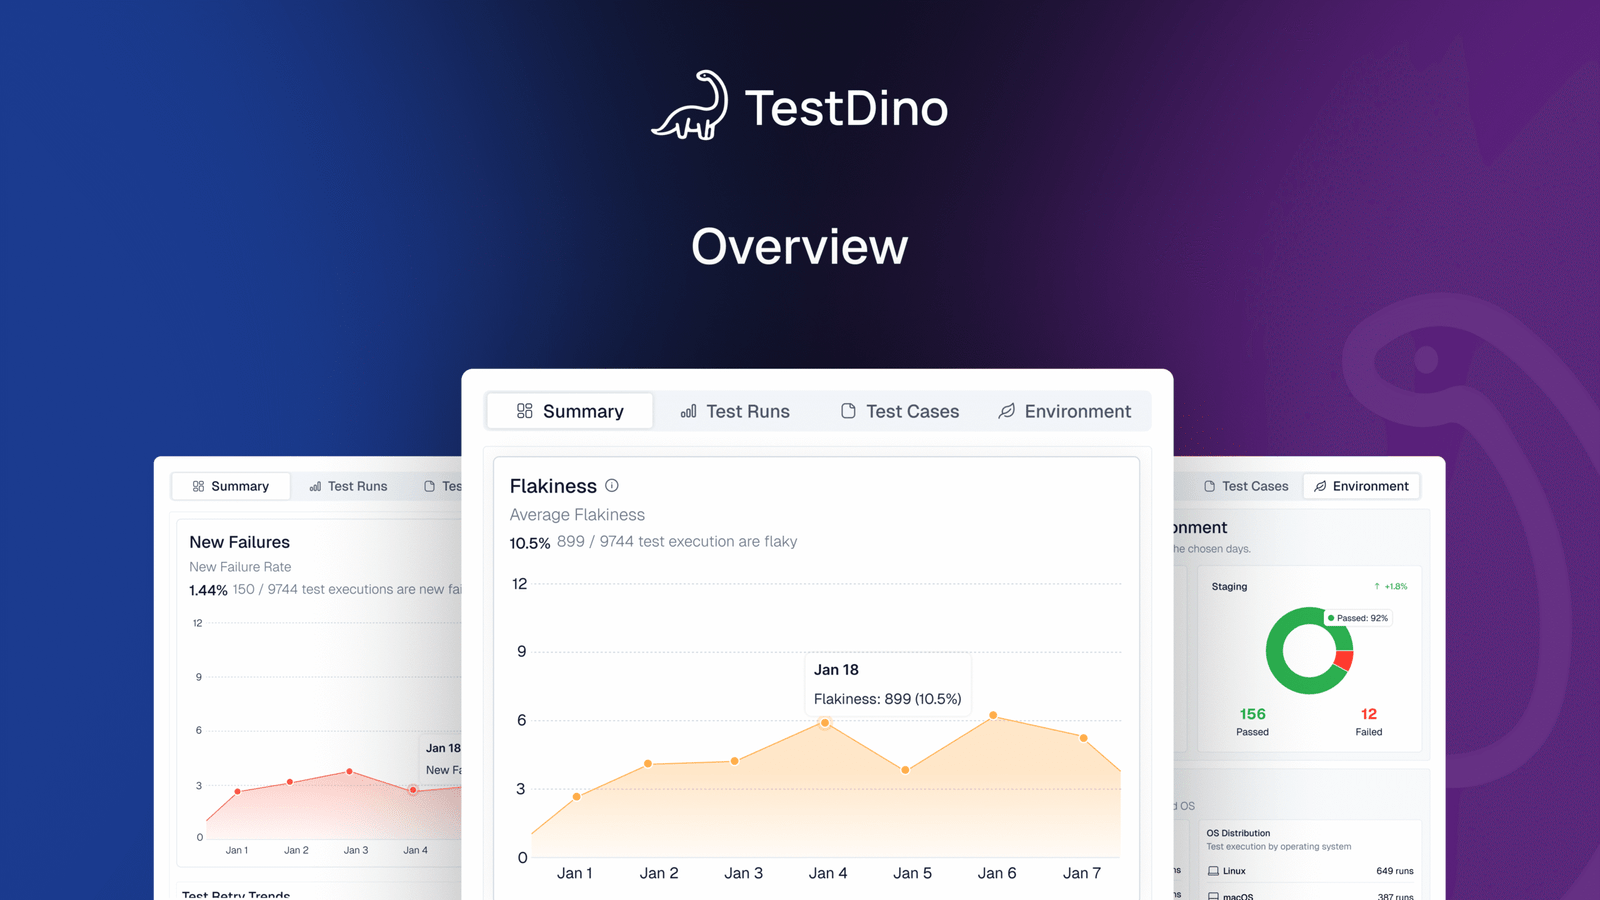
5. Trends expose hidden flakiness
- History plots Passed, Failed, Flaky, Skipped across recent runs and flags spikes in flaky share.
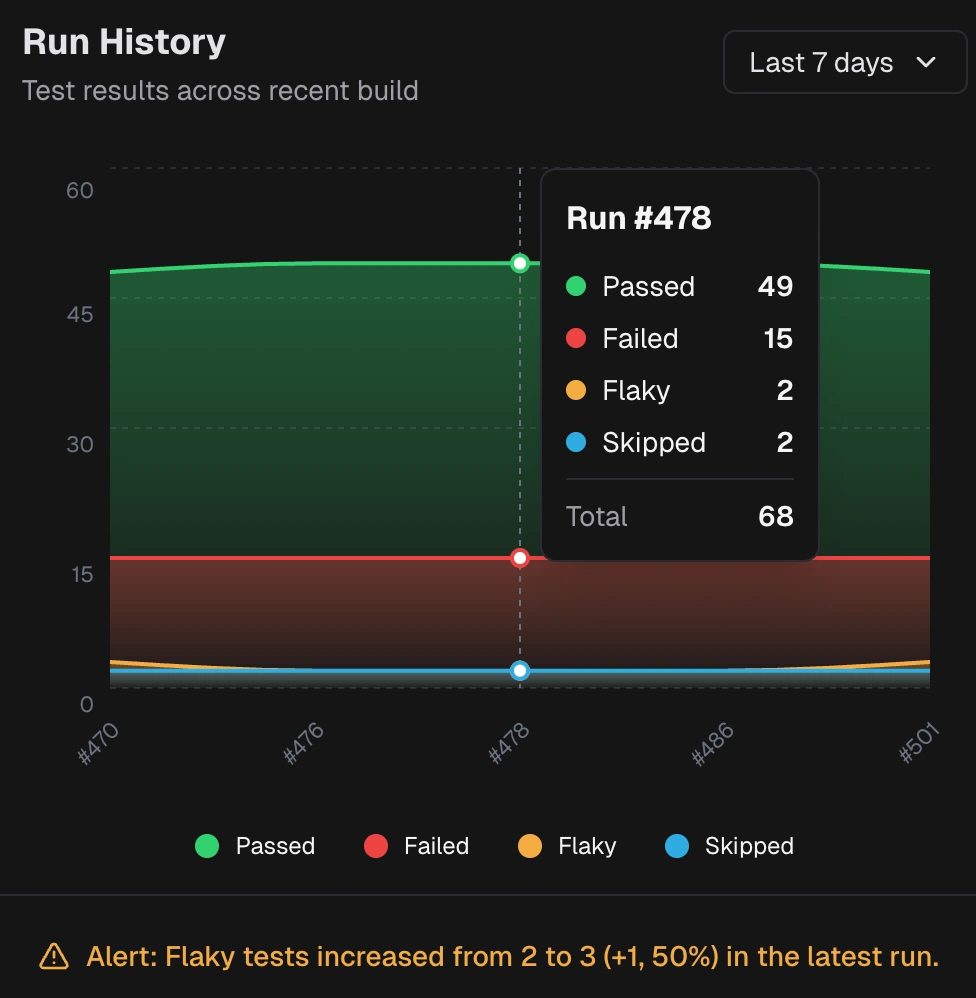
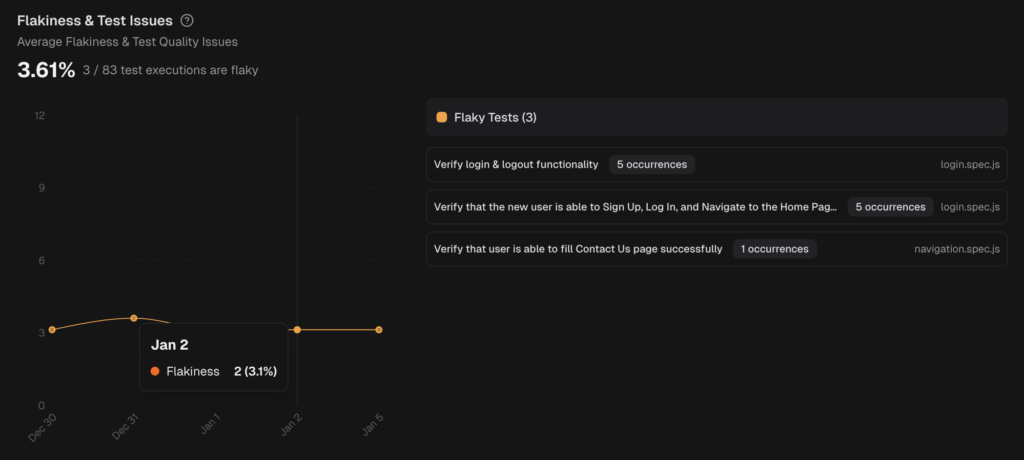
- Analytics adds average flakiness, new failure rate, and retry trends.
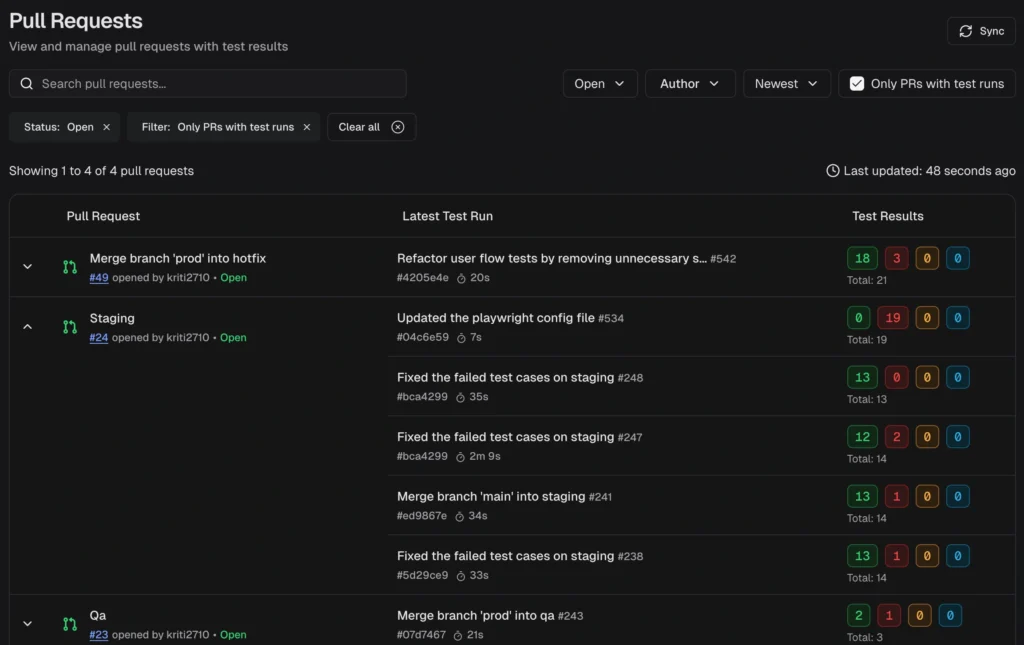
6. PR-aware workflow
- Pull Requests view shows the latest run per PR with passed, failed, flaky, skipped counts, and quick links to evidence.
- Filter to show only PRs with test runs attached.
7. One-click handoff and alerts
- Create Jira, Linear, Asana, or monday issues prefilled with test details, failure cluster, code snippet, short history, and links.
![]()
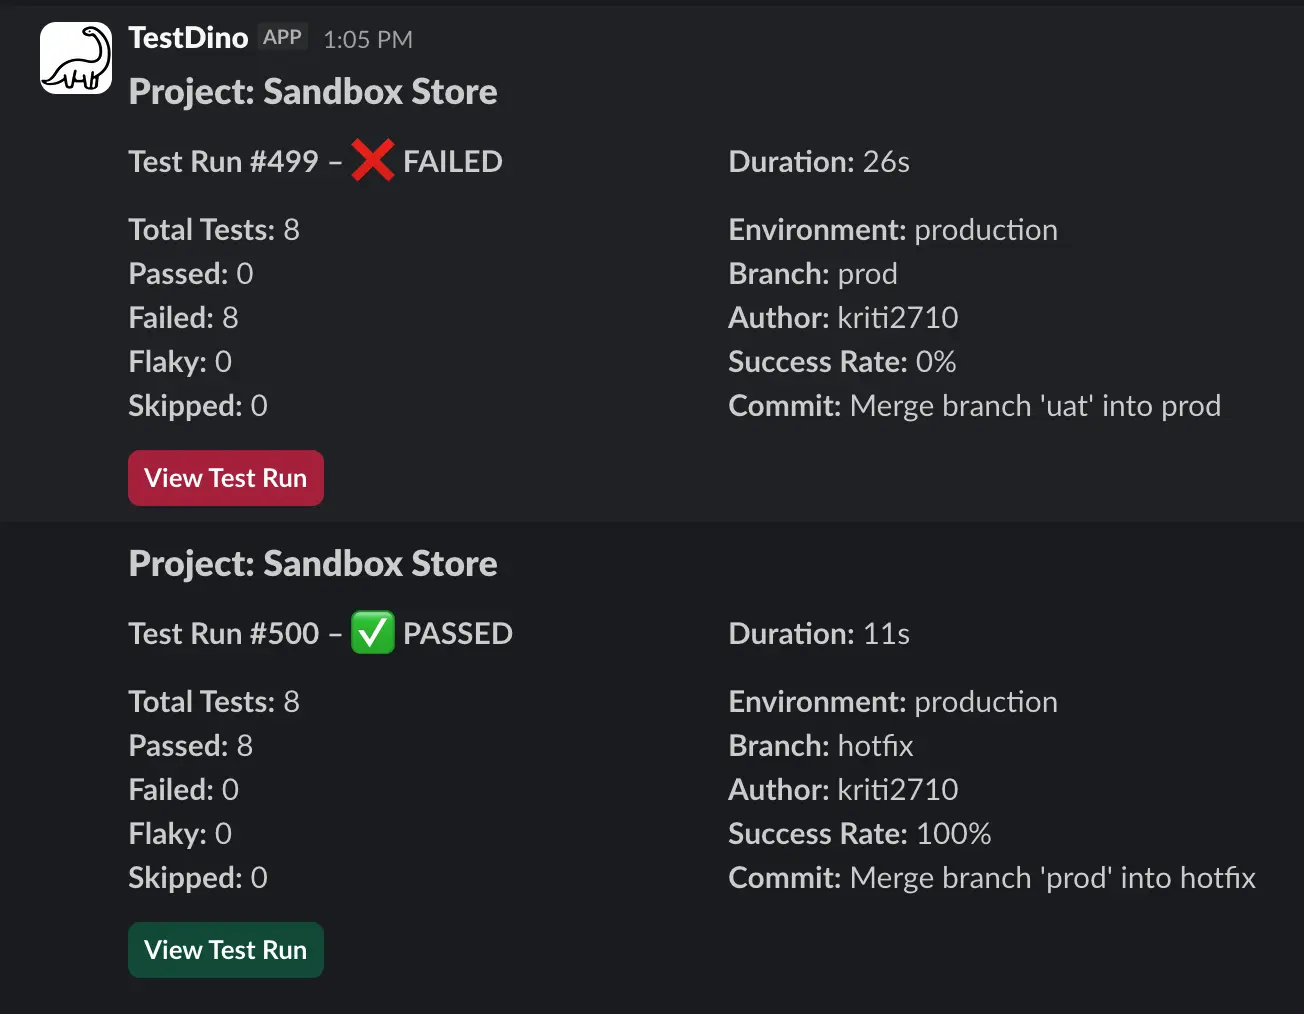
- Slack posts run status, success rate, passed, failed, flaky, skipped, branch, author, and a "View run" link.
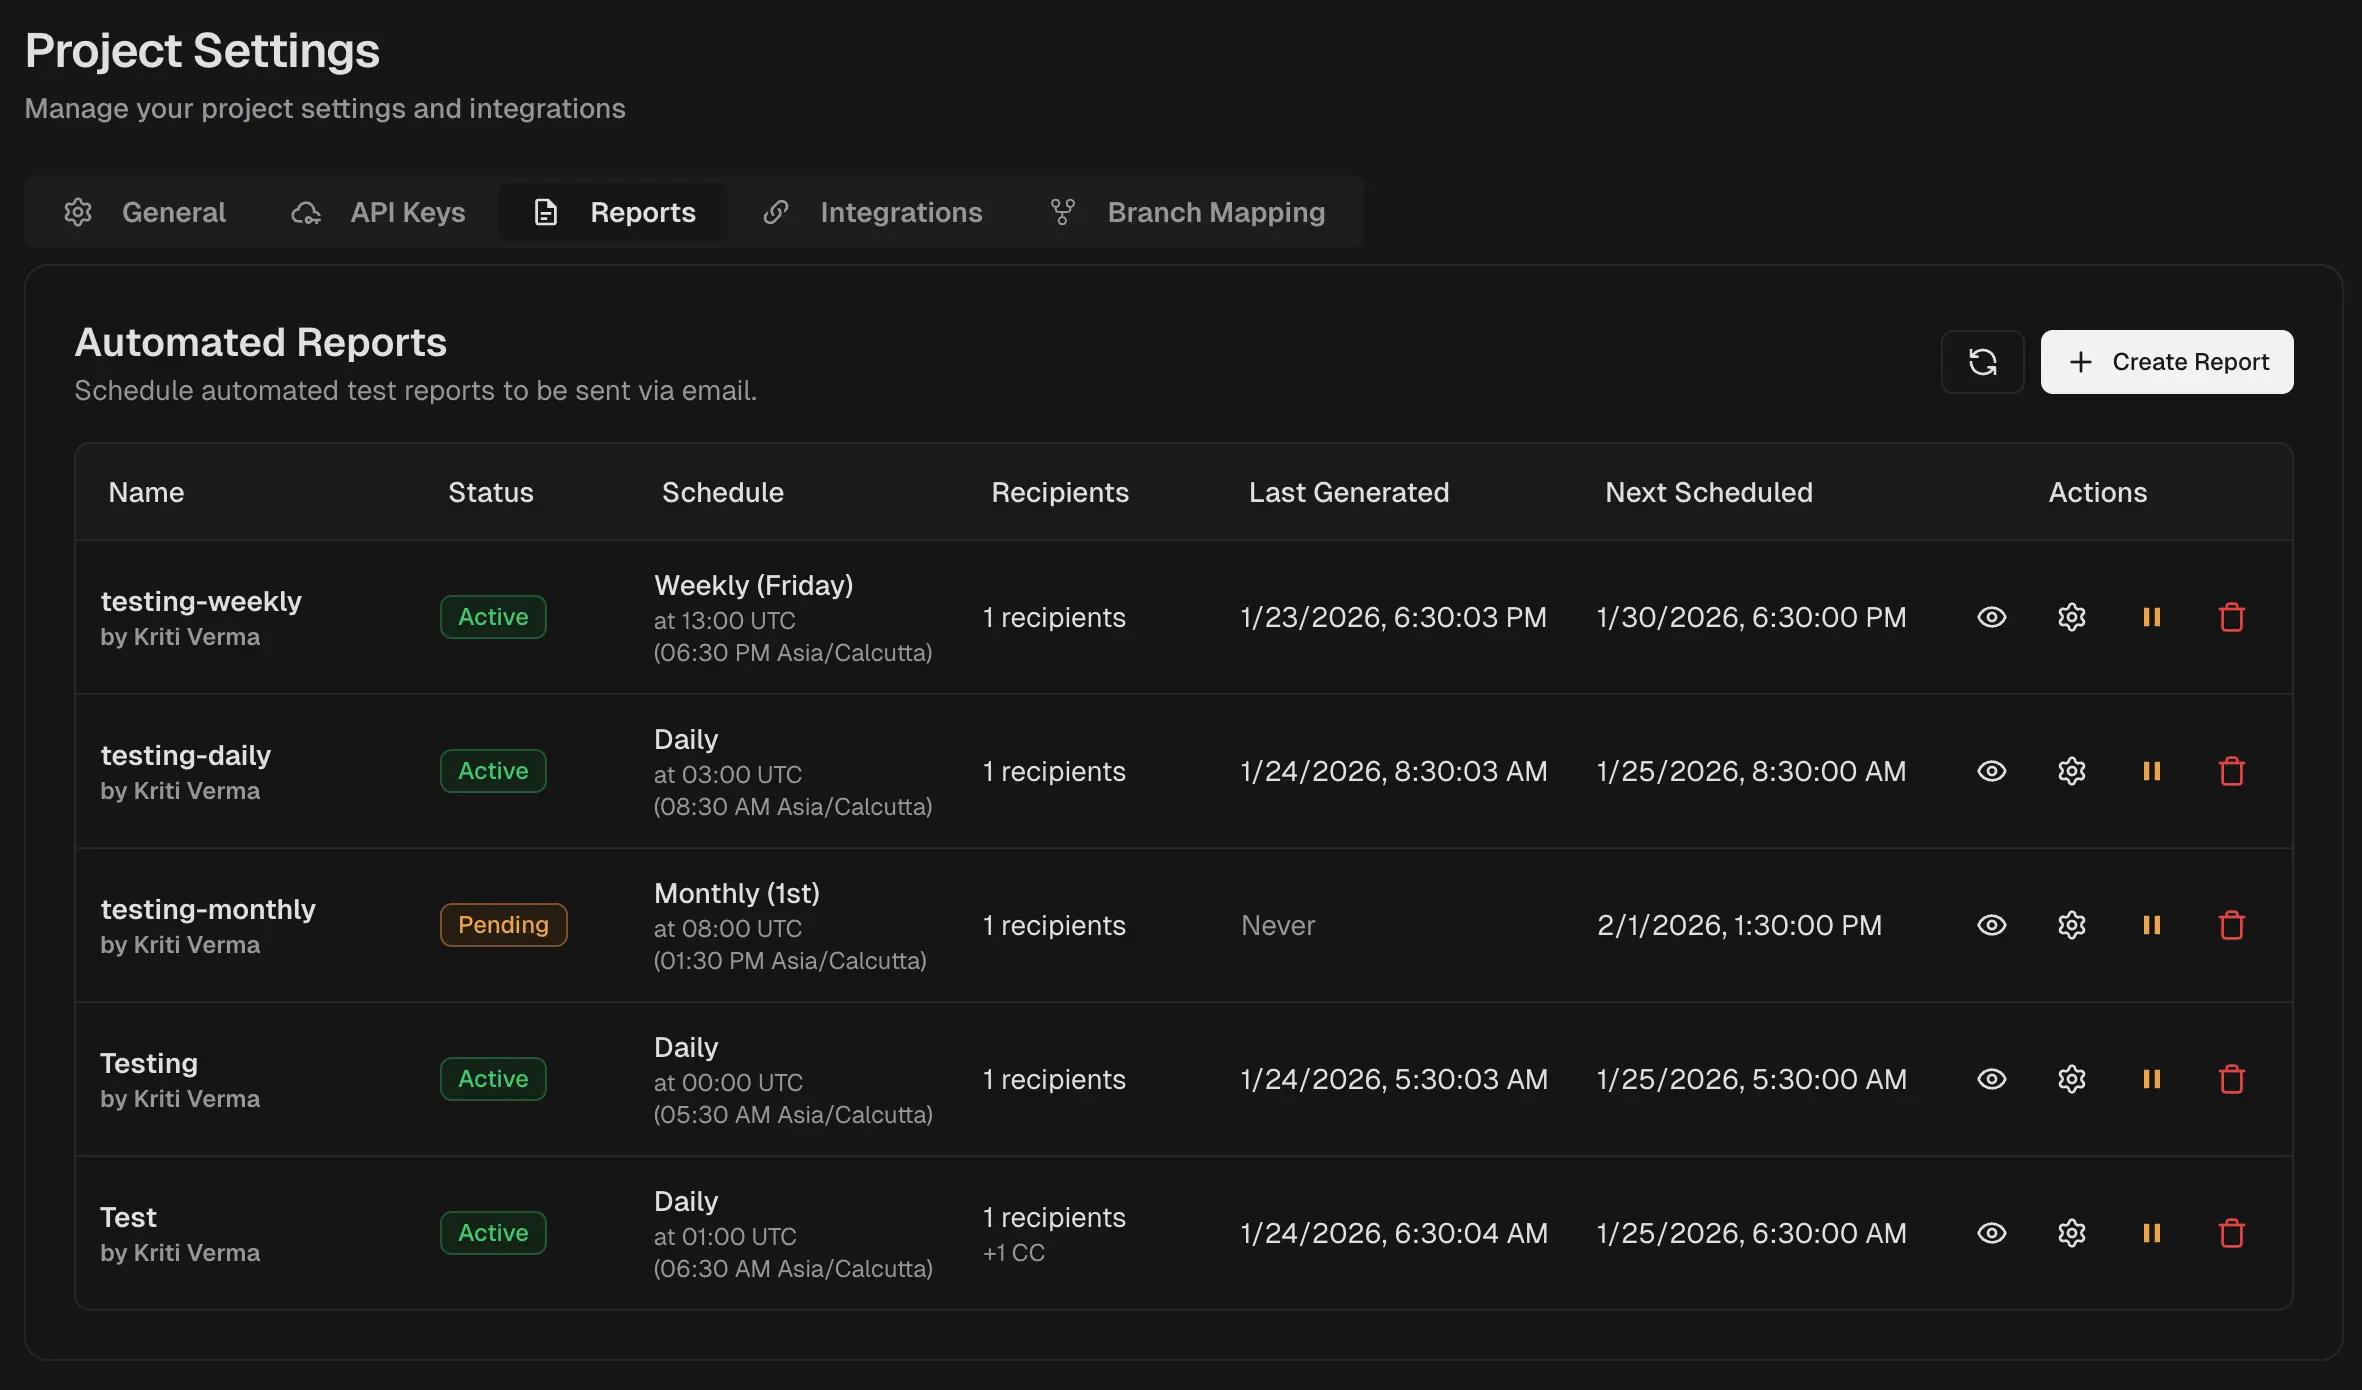
8. Scheduled PDF reports
- Automated reports delivered by email on a flexible schedule.
- Multi-recipient support with timezone-aware delivery.
- Customizable reporting window with optional filters.
- Preview and download reports before scheduling.
9. CI setup
- Add the Playwright JSON reporter, upload from CI with the CLI or the GitHub Action. Labels and flaky breakdowns appear automatically.
For teams scaling their test automation, TestDino provides the test analytics and flaky test detection you need to keep CI stable.
Conclusion
Flaky tests destroy productivity and trust. The right detection tools change them from pipeline blockers into manageable issues. Whether you choose AI-powered analysis, CI-native controls, or open-source dashboards, the key is starting now.
If you want simple, accurate flaky detection for Playwright with real cause hints and alerts, TestDino is a strong choice for teams in 2026. It flags flaky tests, explains why, and integrates with your CI and chat tools with minimal setup.
Try TestDino free for 14 days and measure the reduction in debugging time yourself. Sign up today to see which TestDino plan fits your needs.
FAQs
Table of content
Flaky tests killing your velocity?
TestDino auto-detects flakiness, categorizes root causes, tracks patterns over time.
Follow Us