Playwright debugging guide: faster CI fixes with traces
Playwright debugging made faster in CI. Analyze traces, logs, screenshots, flaky tests, and use AI insights to fix failures quickly.
Debugging is the most challenging aspect of testing. You know it. We know it.
A test fails in CI. You open the logs. Then the trace viewer. Then you hunt for screenshots. Twenty minutes later, you're still piecing together what went wrong, and your PR is blocked.
Industry studies show developers can spend nearly half their day just trying to fix bugs. That’s a huge amount of time not spent building new things. When debugging is slow, it blocks your entire team. So, we decided to create a better way.
TestDino is a test reporting tool that simplifies Playwright debugging. It brings all your traces, logs, and visual evidence into one place and uses AI and trend analysis to pinpoint the to solution. It just plugs into the workflow you already have.
Why Debugging Your Playwright Tests Matters
Good debugging isn’t just about fixing code. It’s about keeping your whole engineering team moving forward. When it’s slow, it creates bottlenecks that hurt everyone.
1. The Hidden Cost of Slow Debugging
Slow debugging kills productivity.
A developer has to stop what they’re doing, switch gears, and start a long investigation. They might spend hours wrestling with CI logs or trying to catch a random, flaky failure. This is an invisible tax on your team’s time.
It adds up fast. This is time not spent building features. It’s a direct hit to productivity. As these small delays add up, pull requests stay open longer, releases are pushed back, and your team gets stuck resolving bugs and managing test failures rather than creating value.
2. How Debug Speed Impacts Delivery
When you can debug things quickly, everything gets better. It’s that simple.
A fast diagnosis means a quick fix. Fewer bugs make it into production. Developers get clear feedback from their tests right away, which helps them stay in the flow. This removes a major blocker and makes your entire delivery pipeline smoother and more reliable.
Playwright Debugging Basics
To debug fast, you need the right evidence. The Playwright test runner provides several features to help you run and debug Playwright tests efficiently.
Playwright gives you several types of artifacts that tell the full story of a test run. Running and debugging tests effectively requires understanding the available artifacts and tools.
1. What Are Traces? (Your Test’s Flight Recorder)
A Playwright trace is the flight recorder for your test. It’s a complete, step-by-step recording of everything that happened. It saves DOM snapshots, screenshots, network calls, and console messages for every single action.
When a test fails, you just open the trace and go back in time and pinpoint exactly what the browser was doing. It’s the single best piece of evidence for understanding: What was the state of your application when it failed?
2. How Logs Tell the Story
Logs are the text version of the story. You get two kinds:
Console Logs: These are messages straight from the browser's console. They’re great for finding JavaScript errors or API calls that went wrong.
Verbose API Logs: If you turn on verbose logging (DEBUG=pw:api), Playwright will print out every little thing it does. This helps with tricky timing problems.
3. Screenshots and Videos for Context
Visuals show you what the user would have seen.
A screenshot taken at the moment of failure can instantly explain why a test broke. Was there an unexpected pop-up? Did the page render incorrectly?
Videos record the entire session. They're perfect for understanding the sequence of events that led to the problem, especially for complex user flows.
4. What Is Visual Comparison?
Visual comparison is like an automated "spot the difference" game for your UI. You give it a "baseline" screenshot of how a page should look. Then, every time you run your tests, it takes a new screenshot and compares it to the baseline.
If even one pixel is different, the test fails. It’s a powerful way to catch visual bugs, like layout shifts or style changes, that normal tests would miss.
Inside Playwright’s Default Debug Tools
Playwright gives you some good tools for debugging on your own machine. They work well, but they can be clumsy when a test only fails in CI.
1. Using the Playwright Inspector
The Playwright Inspector tool is a GUI utility that opens a dedicated Playwright inspector window for interactive debugging. It’s great for writing new tests because you can pause execution at any test line, check selectors, and see what’s happening live.
The Inspector also acts as a recording tool, allowing you to generate a recorded script by capturing user interactions. Additionally, it helps you accurately identify the target element for your selectors. You can start it with a simple command:
# Run a test and open the Inspector
npx playwright test your-test-file.spec.ts --debug
2. Exploring Traces in the Trace Viewer
The Playwright Trace Viewer is a GUI tool for analyzing test execution using your trace.zip files. First, you have to tell Playwright to save traces in your playwright.config.ts file. For CI, trace: ‘on-first-retry’ is a good setting because it only saves traces for tests that fail.
Traces are stored in the test results directory after test execution. You can find the trace files there for further analysis.
After you get a trace file from your CI run, you open it from your command line.
npx playwright show-trace path/to/the/test-results-directory/test-file/trace.zip
3. Debugging Failures in CI/CD
CI is where things get tough.
CI debugging with standard Playwright tools feels like solving a puzzle blindfolded. Your failing tests run in headless mode on remote servers, often with different specs than your local machine.
When a test fails in CI, you can’t use the interactive Inspector. The trace files and screenshots are zipped up as artifacts on a remote server. You have to find the right CI job, download the files, unzip them, and then use a specific test command to open the trace viewer locally.
There’s a big gap between the failure and the clues. This manual process is slow and pulls you out of your workflow.
Debug Smarter with TestDino
TestDino is a reporting and analytics platform built to fix this broken workflow. It centralizes all your test artifacts and uses AI to give you actionable insights, making debug sessions fast and simple for any Playwright project.
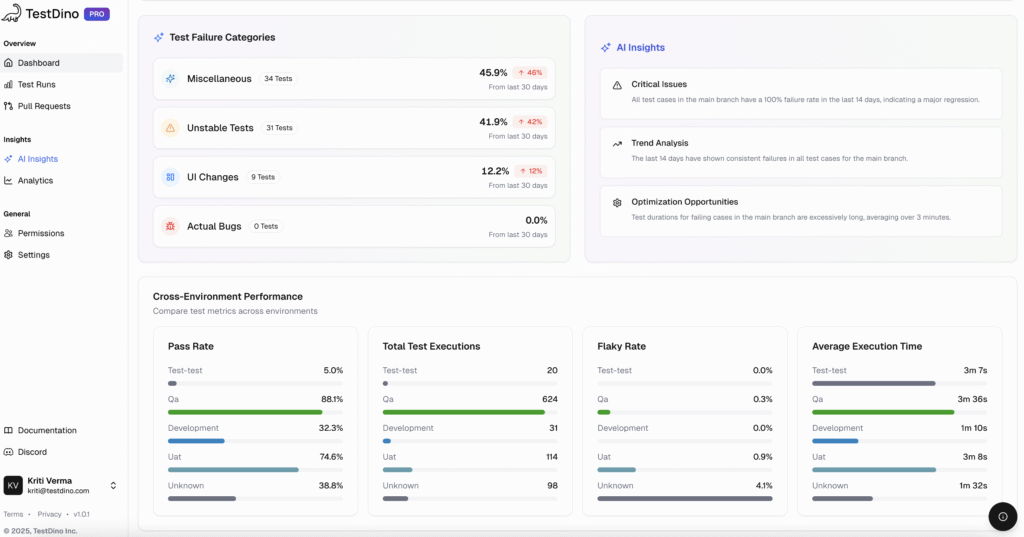
1. TestDino Dashboard: Centralised Test Insights
The TestDino Dashboard is your home base. It adapts to your role.
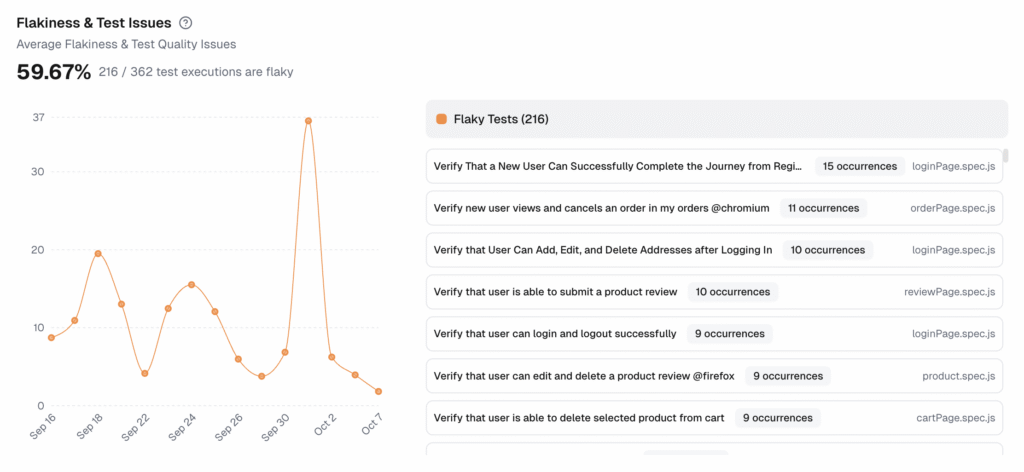
It gives different views to QA, developers, and managers, so everyone sees what they need. You can also configure projects for different environments and testing needs, making it easy to manage and switch between various setups. The system automatically flags tests that fail intermittently, showing you their flaky rate percentage.
You get a clean look at pass/fail trends, a list of your flaky tests, and AI insights that point out the big problems. No more digging through CI logs.
2. Detailed Test Case View (Traces + Logs + Visuals)
Finally! This is where you will find answers to all your issues. Click on any failed test, and TestDino’s Test Case View opens everything you need in a single pane. No downloading files. No switching between tools.
The Evidence panels organize all your debugging data:
Error details show the exact error message and stack trace
Test steps list each action with timing information
Screenshots display what the page looked like at failure
Console reveals any JavaScript errors or warnings
Video plays back the entire test execution
Attachments include the interactive Playwright trace
The real magic happens when you jump into the Playwright online trace viewer. With a single click from TestDino, you open the trace in your browser so you can inspect the timeline, network calls, and DOM snapshots in the native Playwright experience.

In the trace viewer, you can use the elements panel to manually inspect and select DOM elements, and the playwright object is available in the console to debug selectors and actions. Every piece of evidence is right there, connected and correlated.
3. Built-In Visual Comparison and History Tracking
Reviewing visual bugs can be a pain.
If your tests already use Playwright's powerful visual snapshots (like toHaveScreenshot), TestDino makes your life easier. We integrate that feature directly into our UI. No more downloading reports just to see what changed.
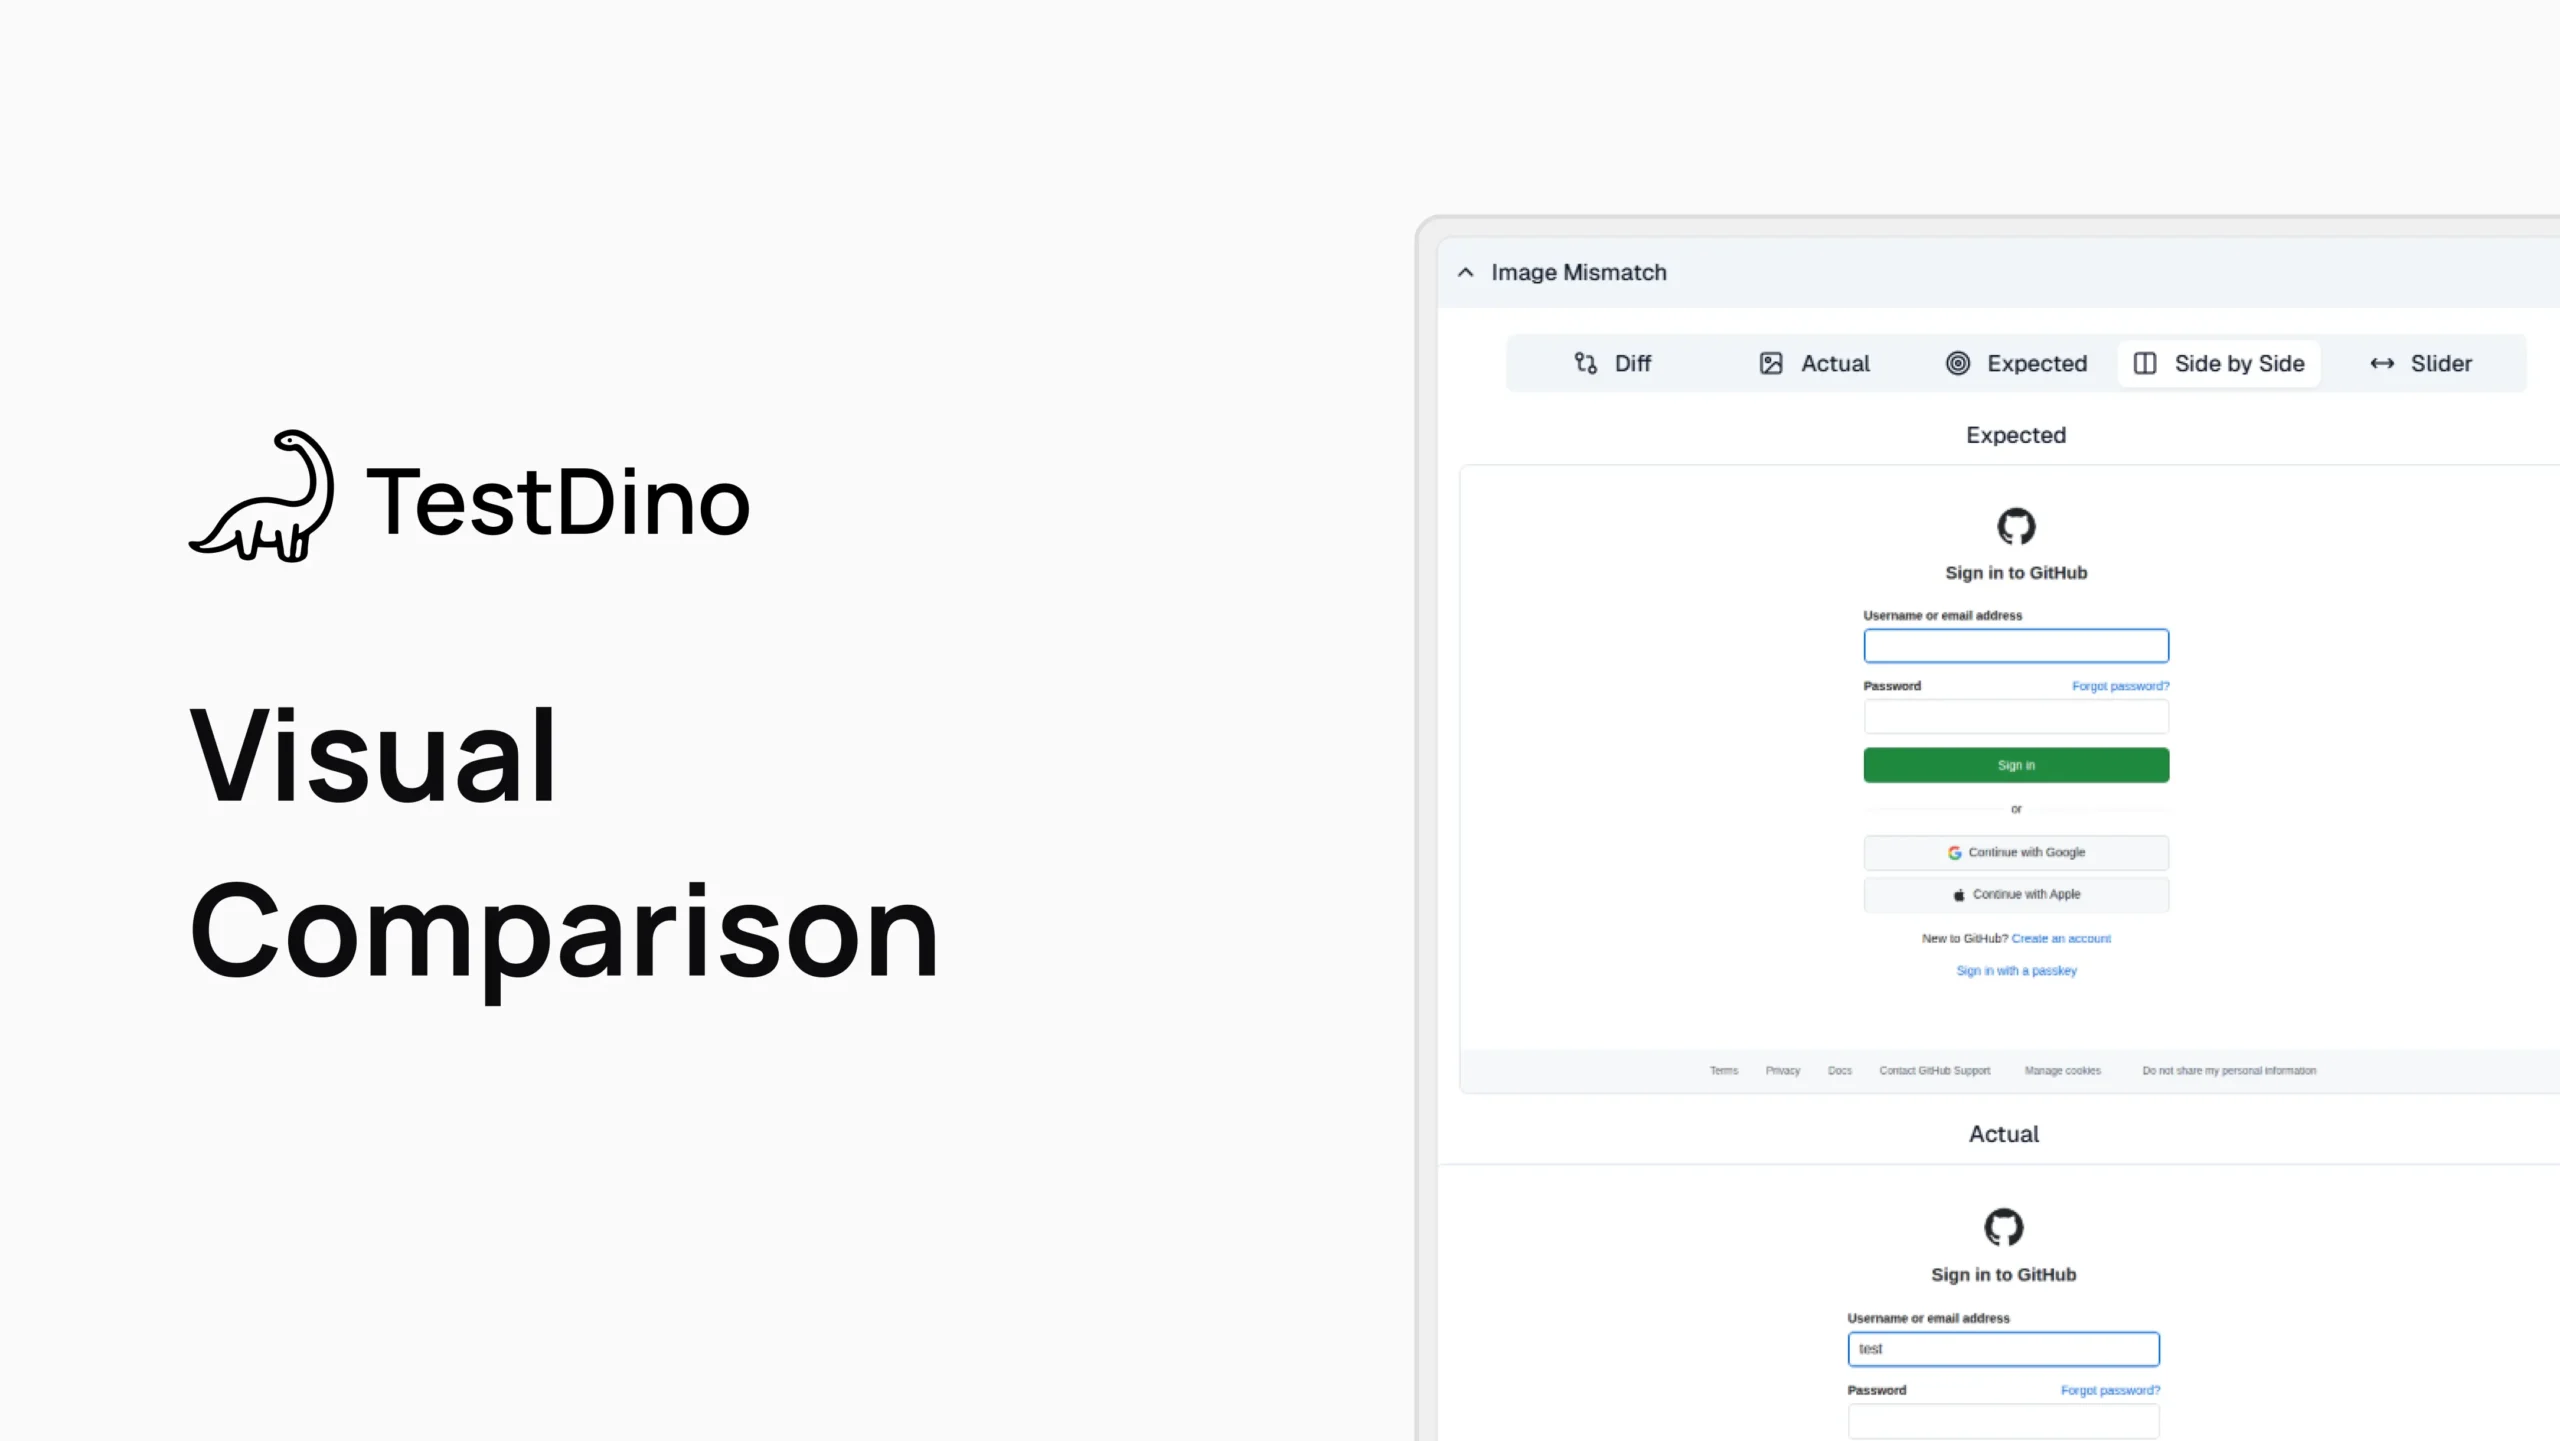
Our Visual Comparison tool shows you the expected, actual, and difference between images side-by-side, right in the Test Cases view.
- Diff mode highlights changed regions with colored overlays
- Actual shows what your test captured
- Expected displays your baseline image
- Side by Side lets you compare both images at once
- Slider provides an interactive overlay to sweep between images
The History tab gives a branch-specific breakdown of the test performance with their failure and flay rates. You can see if a test started failing after a specific commit, whether it's flaky on certain branches, or if it's been consistently broken for days.
AI-Powered Analysis & Integrations
TestDino doesn’t just show you data. It helps you understand it and act on it. TestDino can also integrate with the default Playwright HTML report to provide enhanced analysis and insights.
1. AI Insights: Auto-Triage and Root Cause Grouping
Every test failure gets automatically analyzed and categorized. The AI examines the error message, stack trace, and failure patterns to classify each issue:
Actual Bug: Consistent failures indicating real product defects
UI Change: Failures due to modified interfaces or selectors
Flaky Test: Intermittent failures from timing or environment issues
Miscellaneous: Infrastructure or configuration problems
The system groups similar failures together. Each classification comes with a confidence score and suggested next steps.

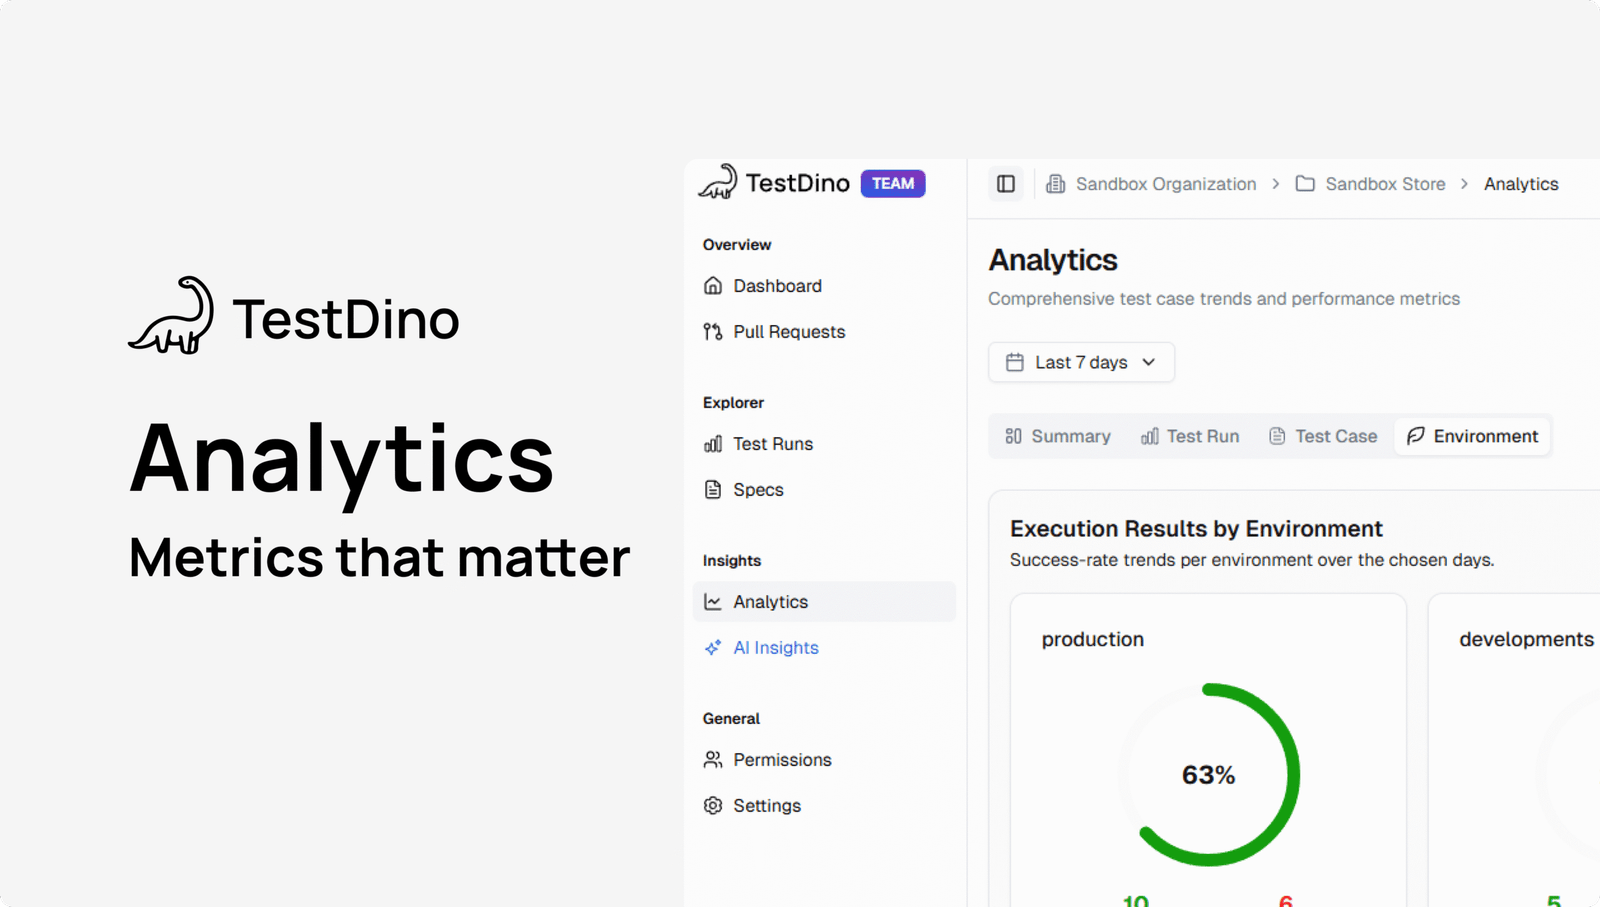
2. Analytics View: Spot Trends Faster
The Analytics dashboards show you the big picture. You can track:
- Flakiness & Test Issues over time to see if stability is improving and to confirm your fixes are effective.
- New Failure trends to detect regressions early, with lists showing the exact test, spec file, and execution date.
- Pass Rate Trends and Execution Results by Environment to spot infrastructure-specific issues and see where failures concentrate.
- Test Execution Performance and Slowest Test Cases to find performance regressions and identify optimization targets.
The Specs Explorer provides detailed analytics for all your test files, showing every test file’s metrics in one table: execution count, failure rate, flaky rate, average duration, and last execution time. Sort by any column to find your slowest specs or most unreliable tests instantly.
3. GitHub & Slack: Close the Feedback Loop Instantly
TestDino integrates directly where your team works.

For GitHub, the TestDino GitHub App posts AI-powered summaries on every pull request. The comment includes pass/fail status, failure categories, and direct links to detailed reports. No need to leave GitHub to understand why tests failed.
The Slack integration sends real-time notifications to your team channels.

Each alert includes:
- Test run status (passed, failed, flaky)
- Success rate percentage
- Execution duration
- Branch and author information
- Direct link to the full report
From TestDino, you can create Jira or Linear tickets with one click. The ticket automatically includes the failure details, stack trace, and a link back to the test run. No copy-pasting required.
Quick Start: Your First Debugging Session
Getting started with TestDino takes about five minutes. First, ensure your playwright.config.ts includes the standard reporters:
reporter: [
['html'],
['json', { outputFile: 'playwright-report/results.json' }],
['junit', { outputFile: 'playwright-report/junit.xml' }]
]
Then add one line to your CI workflow:
- name: TestDino Reporter
run:
npx tdpw upload path/to/report/directory --token="${{secrets.TESTDINO_TOKEN}}" --upload-html
That's it. TestDino automatically captures every test run. When a test fails, just open your TestDino dashboard, find the run, and start investigating with all the evidence already collected and organized.
Here’s how to debug a failed test in three simple steps with TestDino.
Step 1: Find a Failed Run
Go to the Test Runs page. You’ll see a list of your latest CI builds. Just filter for "Failed" runs. The red flags and AI labels will show you exactly what needs attention.
Step 2: Explore the Evidence
Click a failed run. This takes you to the Summary view, where failures are grouped by cause, like "Timeout Issues." Click on any failed test to see the detailed Test Case view. Now you can check the trace, read the logs, and watch the video.
Step 3: Fix with AI Guidance
Check the AI Insights tab for a quick diagnosis. The AI will tell you the likely cause and show you if it’s a new or old problem. This helps you decide what to do next.
CI Optimization: Rerun Only Failed Tests
Don't waste time rerunning your whole test suite for a small fix. TestDino lets you rerun only the tests that failed. This can cut your CI wait time from many minutes down to just a few seconds.
It works by remembering the results from a full run. Then, a simple command tells Playwright to only run the tests that failed last time. It works even on fresh CI machines.
Here’s a quick example for GitHub Actions:
1. First, run all tests and save the results.
# In your main test workflow
- name: Run all tests
  run: npx playwright test

- name: Cache test metadata (always)
  if: always()
  run: npx tdpw cache --token="${{ secrets.TESTDINO_TOKEN }}"
2. Then, run a second workflow that only reruns the failures.
# In a separate workflow for reruns
- name: Get last failed tests
  id: last_failed
  run: |
    npx tdpw last-failed --token="${{ secrets.TESTDINO_TOKEN }}" > last_failed.txt
    echo "args=$(cat last_failed.txt)" >> $GITHUB_OUTPUT

- name: Run only failed tests
  run: npx playwright test ${{ steps.last_failed.outputs.args }}
This setup gives you a super-fast way to check your fixes. You can find more details in our CI setup guide.
Stop Guessing. Start Fixing.
Good Playwright debug habits are key to shipping great software fast. Playwright’s own tools are fine for your local machine, but they just aren't built for the speed of modern CI/CD.
No more manual log correlation. No more guessing why tests fail in CI but pass locally. TestDino takes the guesswork out of debugging.
Your tests are trying to tell you something. TestDino makes sure you hear it loud and clear.
FAQs
Table of content
Flaky tests killing your velocity?
TestDino auto-detects flakiness, categorizes root causes, tracks patterns over time.

