Playwright 2026 release summary: what actually matters for your tests
Upgrade safely from Playwright 1.55 to 1.59: screencasts with annotations, shared browsers via browser.bind(), CLI debugging, faster trace analysis, plus a checklist for breaking selector removals.


Your Playwright version is probably 3-4 releases behind. That is normal. Nobody upgrades a test framework mid-sprint just because a changelog dropped.
But the gap between 1.55 and 1.59 is not a few minor patches. Playwright now records annotated screencasts, shares a single browser across CLI and MCP clients simultaneously, lets coding agents step through failing tests from the terminal, and ships with built-in AI agents that can heal broken selectors by reading your traces.
It also removed _react and _vue selectors entirely. If your suite uses those, upgrading without checking will break things.
Here is every change from versions 1.56 through 1.59, with code you can run today and the migration steps to get there safely.
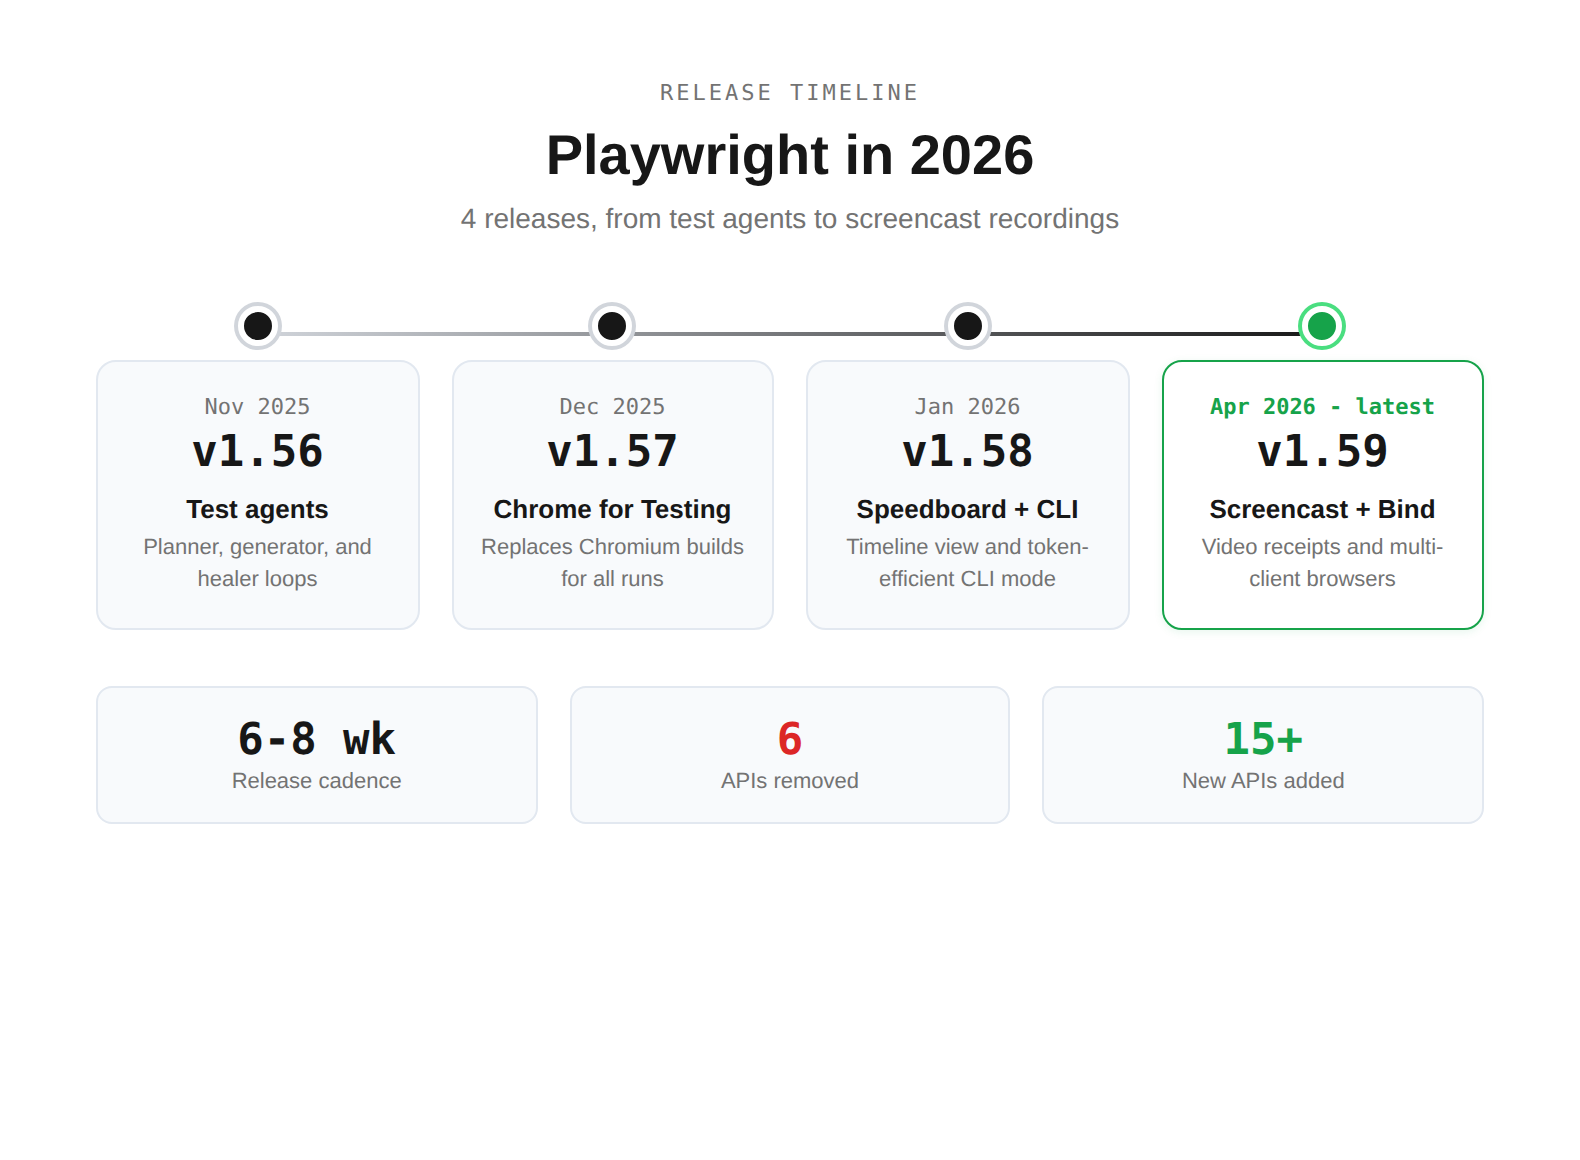
The 4 releases at a glance
| Version | Date | What shipped | Your action |
|---|---|---|---|
| 1.56 | Nov 2025 | Test agents (planner, generator, healer) | Try npx playwright init-agents on a staging project |
| 1.57 | Dec 2025 | Chrome for Testing replaces Chromium | Run your full suite, check for browser-specific quirks |
| 1.58 | Jan 2026 | Speedboard Timeline + playwright-cli | Open the Timeline tab in your next HTML report |
| 1.59 | Apr 2026 | Screencast API + browser.bind() | Record a screencast of your critical E2E flow |
Versions 1.56 and 1.57 shipped in late 2025, but most teams upgrading in 2026 are jumping from 1.50-1.55 and hitting all 4 at once.

Tip: Upgrade incrementally. Jump to 1.57 first, run your suite, then jump to 1.59. This isolates Chrome for Testing issues from other changes.
Screencast API: your agents can now show their work

The page.screencast API in 1.59 is not just video recording with a new name. It adds 3 things the old recordVideo option never had: start/stop control, action annotations that highlight clicked elements, and chapter markers for narration.
Here is a real example. Say you have an agent that verifies a checkout flow after fixing a coupon bug. Instead of dumping logs, it records a 30-second annotated video:
import { test, expect } from '@playwright/test';

test('verify coupon applies 20% discount', async ({ page }) => {
  // Start recording with action overlay
  await page.screencast.start({ path: 'test-results/coupon-receipt.webm' });
  await page.screencast.showActions({ position: 'top-right' });

  await page.screencast.showChapter('Navigate to product page');
  await page.goto('https://demo.testdino.com/products/widget-pro');
  await page.getByRole('button', { name: 'Add to cart' }).click();
  await page.getByRole('link', { name: 'Cart' }).click();

  await page.screencast.showChapter('Apply coupon code');
  await page.getByLabel('Coupon code').fill('SAVE20');
  await page.getByRole('button', { name: 'Apply' }).click();

  // Assert discount applied
  await expect(page.getByTestId('discount-amount')).toContainText('20%');
  await expect(page.getByTestId('total')).not.toContainText('$100.00');

  await page.screencast.showChapter('Done - discount verified');
  await page.screencast.stop();
});
The output is a .webm file where each chapter gets a title card, and every click/fill/assertion gets a visual highlight. Share it in a PR comment or Slack thread. Stakeholders who never read test logs will watch a 30-second video.
You can also enable screencast annotations globally through your config:
export default defineConfig({
  use: {
    video: {
      mode: 'on',
      show: {
        actions: { position: 'top-left' },
        test: { position: 'top-right' },
      },
    },
  },
});
Note: Screencast and the old recordVideo option coexist. Use recordVideo for automatic full-run capture. Use screencast when you need chapters, annotations, or selective recording. They solve different problems.
browser.bind(): share 1 browser across CLI, MCP, and API

Before 1.59, a browser instance was locked to the Playwright process that launched it. browser.bind() changes that. You can now bind a browser to a session name, and multiple clients connect to it at the same time.
This is the setup:
const { chromium } = require('playwright');

(async () => {
  const browser = await chromium.launch({ headless: false });
  const { endpoint } = await browser.bind('checkout-debug', {
    workspaceDir: process.cwd(),
  });
  console.log(`Browser bound. Endpoint: ${endpoint}`);
  console.log('Attach with: playwright-cli attach checkout-debug');
  // Keep running until interrupted
})();
Now in a separate terminal:
# An AI agent attaches via CLI
playwright-cli attach checkout-debug
playwright-cli -s checkout-debug snapshot

# Or connect via MCP
@playwright/mcp --endpoint=checkout-debug

# Or connect from another Playwright script
# const browser = await chromium.connect(endpoint);
Run playwright-cli show to open the Playwright Dashboard. It lists all bound browsers, shows live screencasts, and lets you click into any session for manual intervention.
Tip: Set PLAYWRIGHT_DASHBOARD=1 as an environment variable when running npx playwright test. All test browsers show up in the dashboard, so you can watch your suite execute in real time.
Where this gets practical: A QA engineer launches a browser, an AI agent runs test scenarios through CLI, and the engineer watches via the dashboard. If the agent hits an edge case, the engineer takes over manually. No restart needed.
CLI debugger and trace analysis for agents
Version 1.59 added 2 features specifically for AI agent workflows. Both operate from the terminal, no GUI needed.
Debug tests from CLI
Run any test with --debug=cli and the test pauses at each step. A coding agent (or a human) attaches and steps through:
$ npx playwright test checkout.spec.ts --debug=cli
### Debugging Instructions
- Run "playwright-cli attach tw-87b59e" to attach

$ playwright-cli attach tw-87b59e
### Paused
- Navigate to "/" at checkout.spec.ts:4

$ playwright-cli --session tw-87b59e step-over
### Page
- Page URL: https://demo.testdino.com/
- Page Title: TestDino Demo Store
### Paused
- Expect "toHaveTitle" at checkout.spec.ts:7
Analyze traces from CLI
Instead of downloading a .zip trace and opening it in the browser, you can explore it directly:
$ npx playwright trace open test-results/checkout-chromium/trace.zip

$ npx playwright trace actions --grep="expect"
     # Time       Action                   Duration
  ──── ─────────  ─────────────────────── ────────
    9. 0:00.859  Expect "toHaveTitle"         5.1s  ✗

$ npx playwright trace action 9
  Error: expect(page).toHaveTitle(expected) failed
    Expected: /Checkout/
    Received: "TestDino Demo Store"
This is how an agent goes from "test failed" to "here's the exact assertion that broke and why" in 3 commands.

Speedboard Timeline: find slow tests before they become the norm
Slow suites do not fail. They just get slower. The Speedboard tab was introduced in 1.57. Version 1.58 added a Timeline view that visualizes execution across all tests.
Here is what the Timeline shows you:
-
Which tests take the longest wall-clock time
-
Where waits and network delays pile up
-
How execution distributes across workers
-
Whether your shards are balanced
If you are using merged reports across shards, the Timeline now shows cross-shard execution. This makes it trivial to spot a shard that is taking 3x longer than the others because it got all the slow tests.
Tip: Run your full suite with merged reports once a sprint. Open the Timeline tab. You will almost always find 1-2 tests that got 10x slower since the last check and nobody noticed.
Chrome for Testing replaces Chromium
Starting in 1.57, Playwright uses Chrome for Testing instead of Chromium. This is the same binary Google ships specifically for automated testing.
What changes for you:
The browser icon in headed mode changes. That is the most visible difference. Functionally, Playwright expects zero breakage. But there are edge cases:
# Check what browser binary Playwright is using
npx playwright --version
# Output: Version 1.59.1

npx playwright install --dry-run chromium
# Shows Chrome for Testing download URL instead of Chromium
Warning: If you run CI on Arm64 Linux, Playwright still uses Chromium, not Chrome for Testing. Your local dev machine (x86) and CI (Arm64) may run different browser binaries. If you see inconsistent test behavior between local and CI, this is the first thing to check.
Test agents: planner, generator, and healer
Version 1.56 added built-in test agents with 3 roles:
# Initialize agents in your project
npx playwright init-agents
This creates a specs/ directory where the Planner writes structured Markdown scenarios. The Generator converts those into .spec.ts files. The Healer reads failure traces and fixes broken selectors or assertions.
Here is how the workflow looks in practice:
You describe a feature → Planner writes test scenarios (Markdown)
                       → Generator creates .spec.ts files
                       → Tests run in CI
                       → Tests break after UI change
                       → Healer reads trace, updates selectors
                       → Tests pass again
I want to be honest here: this is not a drop-in replacement for hand-written tests. Agent-generated tests have real problems. They hallucinate assertions. They miss business logic edge cases. They can explode your test count without adding coverage.
But as a starting point for test scaffolding, especially for teams with zero automation, the Planner + Generator combo gets you from nothing to a working suite faster than anything else available.
Warning: If you use agents to generate tests, you need a feedback loop to track which generated tests are stable and which are flaky. Without that signal, your suite degrades silently.
Config options that change how your CI behaves
These features do not get blog posts, but they change how your CI pipeline works on Monday morning.
failOnFlakyTests
Your suite passes but 3 tests were flaky (failed then passed on retry). Before 1.57, that was a silent pass. Now:
import { defineConfig } from '@playwright/test';

export default defineConfig({
  retries: 2,
  failOnFlakyTests: true, // NEW: treat flaky as failure
});
$ npx playwright test
# Result: 47 passed, 3 flaky
# Exit code: 1 (FAILED)
Use this in merge pipelines to enforce stability. Use the CLI flag --fail-on-flaky-tests for the same behavior without changing your config.
Test step timeout
Instead of relying on the global test timeout (which might be 30s), scope a timeout to a specific step:
test('dashboard loads within budget', async ({ page }) => {
  await test.step('load dashboard', async () => {
    await page.goto('/dashboard');
    await expect(page.getByRole('heading', { name: 'Overview' })).toBeVisible();
  }, { timeout: 3000 }); // Fails fast if dashboard is slow

  await test.step('charts render', async () => {
    await expect(page.getByTestId('revenue-chart')).toBeVisible();
  }, { timeout: 5000 }); // Charts get more time
});
If the step times out, the test fails immediately. You do not wait for the global timeout to expire.
test.step.skip()
Skip individual steps without skipping the entire test:
test('user profile flow', async ({ page }) => {
  await test.step('update display name', async () => {
    await page.getByLabel('Display name').fill('Test User');
    await page.getByRole('button', { name: 'Save' }).click();
  });

  await test.step.skip('upload avatar', async () => {
    // Skipped: file upload broken in staging environment
    // Remove skip when INFRA-2847 is fixed
  });

  await test.step('verify changes', async () => {
    await expect(page.getByText('Test User')).toBeVisible();
  });
});
Per-project workers
Run different parallelism levels for different browsers:
export default defineConfig({
  workers: 6, // global ceiling
  projects: [
    {
      name: 'chromium',
      workers: 4, // fast, stable - run more in parallel
      use: { ...devices['Desktop Chrome'] },
    },
    {
      name: 'webkit',
      workers: 2, // slower, more resource-hungry
      use: { ...devices['Desktop Safari'] },
    },
  ],
});
webServer wait field
In 1.57, you can tell Playwright to wait for a specific log pattern before running tests:
export default defineConfig({
  webServer: {
    command: 'npm run dev',
    url: 'http://localhost:3000',
    wait: /ready in \d+ms/, // Wait for Vite's ready message
  },
});
No more reuseExistingServer hacks or arbitrary sleep delays.
Smaller API additions worth knowing
await using syntax. Automatic cleanup for routes, init scripts, and other disposables:
await using page = await context.newPage();
{
  await using route = await page.route('**/*.css', r => r.abort());
  await page.goto('https://example.com');
  // CSS blocked inside this scope
}
// Route automatically removed here - CSS loads normally
Aria snapshot /children and /url. Strict child matching and link URL validation in aria snapshots:
await expect(page.getByRole('navigation')).toMatchAriaSnapshot(`
  - navigation:
    - /children: equal
    - link "Home":
      - /url: "/"
    - link "Products":
      - /url: "/products"
`);
Automatic toBeVisible() in Codegen. The test generator now emits visibility assertions during recording. Enable it in Codegen settings. This means recorded tests are no longer just click sequences, they actually verify that elements appeared.
NOT filtering in HTML reporter. View all results except a specific tag: !@smoke shows everything except smoke tests. Useful for debugging regressions in your full regression suite.
Partitioned cookies (CHIPS). browserContext.cookies() and addCookies() support the partitionKey property. Only relevant if your app uses third-party cookies in partitioned storage.
What got removed (migration checklist)
Warning: These are hard removals, not deprecation warnings. If your tests use any of these, they will break on upgrade.
| Removed | Version | What to do |
|---|---|---|
| _react and _vue selectors | 1.58 | Switch to getByRole(), getByTestId(), getByLabel(). See the locators guide. |
| :light selector suffix | 1.58 | Use standard CSS selectors |
| devtools launch option | 1.58 | Use args: ['--auto-open-devtools-for-tabs'] |
| macOS 13 WebKit | 1.58 | Upgrade macOS or pin Playwright version |
| macOS 14 WebKit | 1.59 | Upgrade macOS or pin Playwright version |
| Manifest v2 extensions | 1.57 | Migrate to manifest v3 |
| @playwright/experimental-ct-svelte | 1.59 | Use community alternatives |
Run this before upgrading:
# Find all removed patterns in your test files
grep -rn "_react\|_vue\|:light\|devtools:" tests/ e2e/ src/

# Example output:
# tests/login.spec.ts:12:  await page.locator('_react=LoginForm').click();
# tests/dashboard.spec.ts:8:  await page.locator('.card:light').first();
Migrating _react selectors. This is the most common breakage:
// BEFORE (1.57 and earlier)
await page.locator('_react=ProductCard[name="Widget"]').click();

// AFTER (1.58+)
await page.getByRole('article').filter({ hasText: 'Widget' }).click();
// Or if you have test IDs:
await page.getByTestId('product-card-widget').click();
How Playwright compares to other frameworks after these updates
The 2026 releases widen Playwright's lead in areas where it was already ahead, while also investing in entirely new territory (agentic workflows) that Cypress and Selenium have not touched.
| Capability | Playwright 1.59 | Cypress 14.x | Selenium 4.x |
|---|---|---|---|
| Video with action annotations | Screencast API | Video capture (no annotations) | Requires third-party |
| Multi-client browser sharing | browser.bind() | Not available | Grid (different model) |
| CLI trace analysis | npx playwright trace | Not available | Not available |
| Built-in test agents | Planner + Generator + Healer | Not available | Not available |
| Token-efficient AI integration | playwright-cli (4x fewer tokens vs MCP) | Not available | Not available |
| Cross-browser | Chromium + Firefox + WebKit | Chromium only (experimental Firefox) | All via drivers |
| Parallel execution | Per-project workers + sharding | Limited (paid parallelization) | Via Grid |
| Flaky test config | failOnFlakyTests | Flake detection (paid) | Not built-in |
Playwright is not just a test runner anymore. With MCP, CLI, test agents, and screencast, it is becoming the execution layer that AI coding agents use to interact with browsers. That is a strategic position no other test framework occupies.
Tip: If your team is evaluating frameworks or preparing an internal recommendation, the Playwright best practices guide covers the patterns that make these new features work well together.
Conclusion
The 2026 releases follow a clear pattern: Playwright is becoming the interface between AI agents and browsers, not just a test runner. Screencast gives agents a way to show their work. browser.bind() lets multiple tools share a browser session. CLI debugger and trace analysis let agents understand failures without a GUI.
For day-to-day test engineering, the practical wins are: Speedboard Timeline for finding slow tests before they become the norm, failOnFlakyTests for enforcing stability in merge pipelines, step timeouts for faster failure signals, and per-project workers for smarter resource allocation.
The upgrade path is straightforward: grep for removed selectors, jump to 1.57, verify Chrome for Testing compatibility, then jump to 1.59. Most teams will finish in under an hour.
FAQ
Table of content
Flaky tests killing your velocity?
TestDino auto-detects flakiness, categorizes root causes, tracks patterns over time.
Follow Us