Test Report Generation: Tools, Formats, and Automation Tips (2026)
Struggling with unclear test reports? Learn how to automate test report generation with the right tools, formats, and techniques that stakeholders actually understand.


Every development team runs tests. Very few make the results useful.
Test suites across the industry are growing larger every quarter. Teams run hundreds of tests per pipeline, covering everything from unit tests and API checks to full end-to-end regression suites. The raw output from those runs is a wall of terminal text that nobody has time to read.
The real problem is not running tests. It is figuring out what the results actually mean and getting that information to the people who make release decisions.
This guide covers how test report generation works, which formats and tools fit different workflows, and how to wire everything into CI/CD so reports reach stakeholders automatically.
What is test report generation
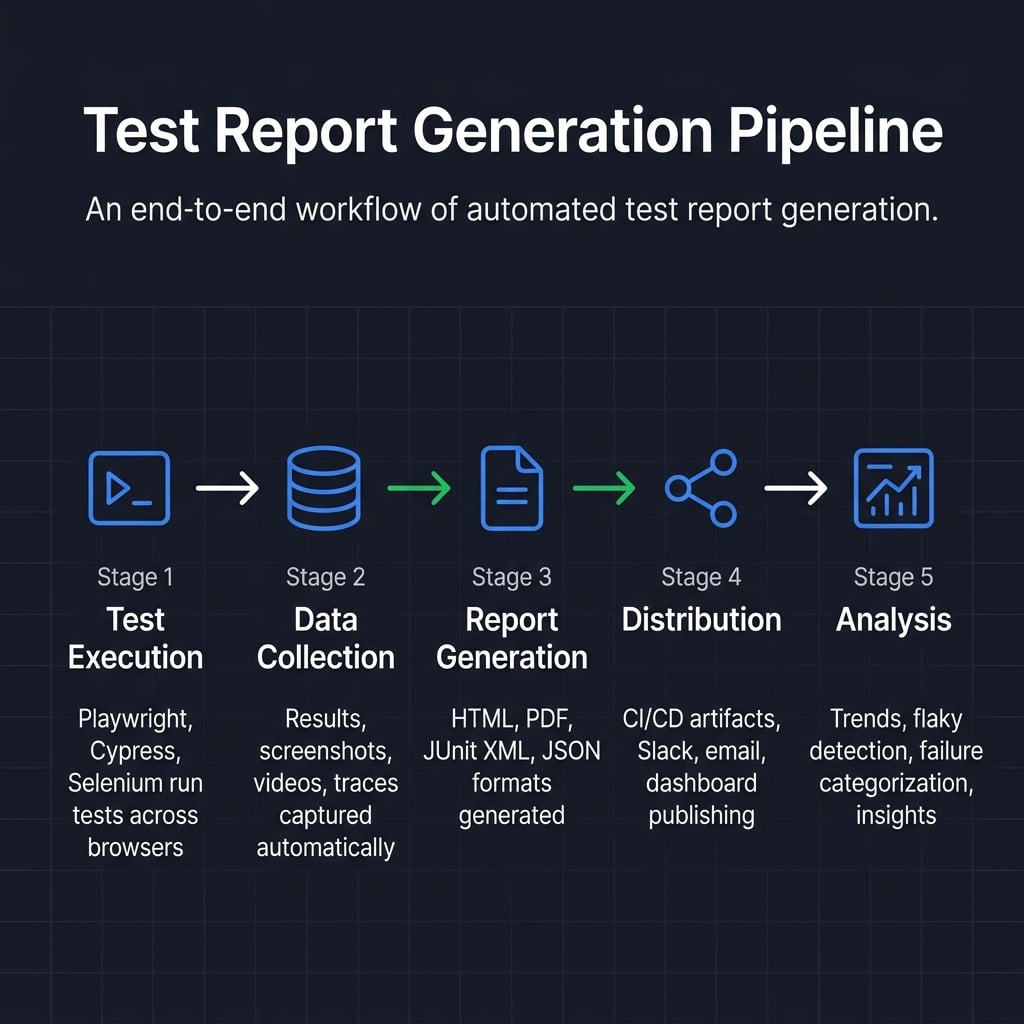
Test report generation is the process of collecting test execution data (pass/fail status, error messages, screenshots, videos, traces) and transforming it into a structured, readable document. The output can be an HTML dashboard, a JUnit XML file, a PDF, or a JSON payload. The goal is to communicate quality status to both technical and non-technical audiences.
Every modern test framework produces output when tests run. Test report generation takes that output and converts it into something useful. It might be an interactive HTML file with charts, a JUnit XML file that your CI platform parses, or a PDF attached to release notes.
The "generation" part can happen inside the test framework itself (like Playwright's built-in HTML reporter) or through external platforms like TestDino that consume raw results, apply AI-powered failure classification, and produce centralized dashboards.
Without this step, test results live in terminal logs. They expire when the CI job finishes. Nobody outside the engineering team sees them.
Key components of a test report
A well-structured test report includes these elements regardless of format:
-
Executive summary: Pass/fail counts, overall pass rate, and a go/no-go recommendation
-
Test execution details: Individual test results with duration, status, and error messages
-
Failure analysis: Categorized failures (bugs vs. flaky tests vs. infrastructure issues)
-
Environment metadata: Browser, OS, app version, branch, and commit hash
-
Visual evidence: Screenshots on failure, video recordings, and trace files
-
Trend data: Comparison against previous builds to show quality direction
-
Coverage mapping: Which features, user flows, or requirements each test validates
This structure works whether you are generating reports for smoke tests, regression suites, or full end-to-end test cycles.
Common types of test reports
While the core components remain the same, test reports serve different purposes depending on when they are generated. The three most common types include:
-
Sprint or Daily Test Summary: A concise, focused report generated automatically on every commit or daily build. It provides immediate feedback to developers on the health of recent code changes and active sprint objectives.
-
Release (Sign-off) Test Report: A comprehensive, formal document used for "go/no-go" decisions before deploying to production. It aggregates results from multiple test suites (unit, integration, e2e) and highlights residual risks for stakeholders and executives.
-
Regression Test Report: A targeted report that compares current execution outcomes against previous baselines. Its primary goal is to ensure that new code has not broken existing functionality, making trend data and historical comparisons critical.
Why automated test report generation matters
Manual test reporting is one of the biggest hidden time drains in QA. Engineers copy terminal output into spreadsheets, take screenshots of failures, and stitch together documents. According to the 2024 State of Testing report by PractiTest, manual repetitive tasks consume up to 70% of a QA professional's working hours.
Automated test report generation removes that bottleneck completely. Here is what it changes in practice:
-
Speed: Reports are ready in seconds after tests finish, not hours
-
Accuracy: No copy-paste errors, no missed failures, no outdated numbers
-
Consistency: Every report follows the same structure, making comparisons across runs possible
-
Traceability: Automated reports create an audit trail linking test results to specific commits, branches, and environments
-
Scalability: Works whether you run 50 smoke tests or 5,000 regression tests per pipeline

Tip: Start automated reporting on your most critical test suites first. The immediate time savings build momentum for rolling it out across all test types, from unit tests to full end-to-end acceptance testing.
Reports also surface patterns that manual reviews miss. A test that passes 82% of the time looks "fine" in a single run but clearly needs attention when you see its flaky test trend line spanning 30 builds.
The biggest value appears during incidents. When a production bug escapes, automated reports show exactly which tests ran (and passed) before the deploy. That information is critical for regulated industries and helps teams patch coverage gaps quickly.
One Playwright team running 1,800 tests across three browsers cut their daily triage time from over three hours to under twenty minutes after switching from local HTML reports to a centralized dashboard with AI-powered failure classification. The change was not the tests themselves. It was how they consumed the results.
Key metrics to track in test reports
The most useful test execution reports go beyond pass/fail counts. Track these metrics to turn reports into decision-making tools:
-
Pass rate: Percentage of tests passing per build (target: above 95%)
-
Failure rate by category: Bugs vs. flaky tests vs. environment issues
-
Mean time to resolution (MTTR): How long failures remain unfixed
-
Test execution time: Total suite duration and slowest individual tests
-
Flake rate: Percentage of tests that pass inconsistently across runs
-
Test coverage delta: New tests added vs. removed per sprint
Common test report formats explained
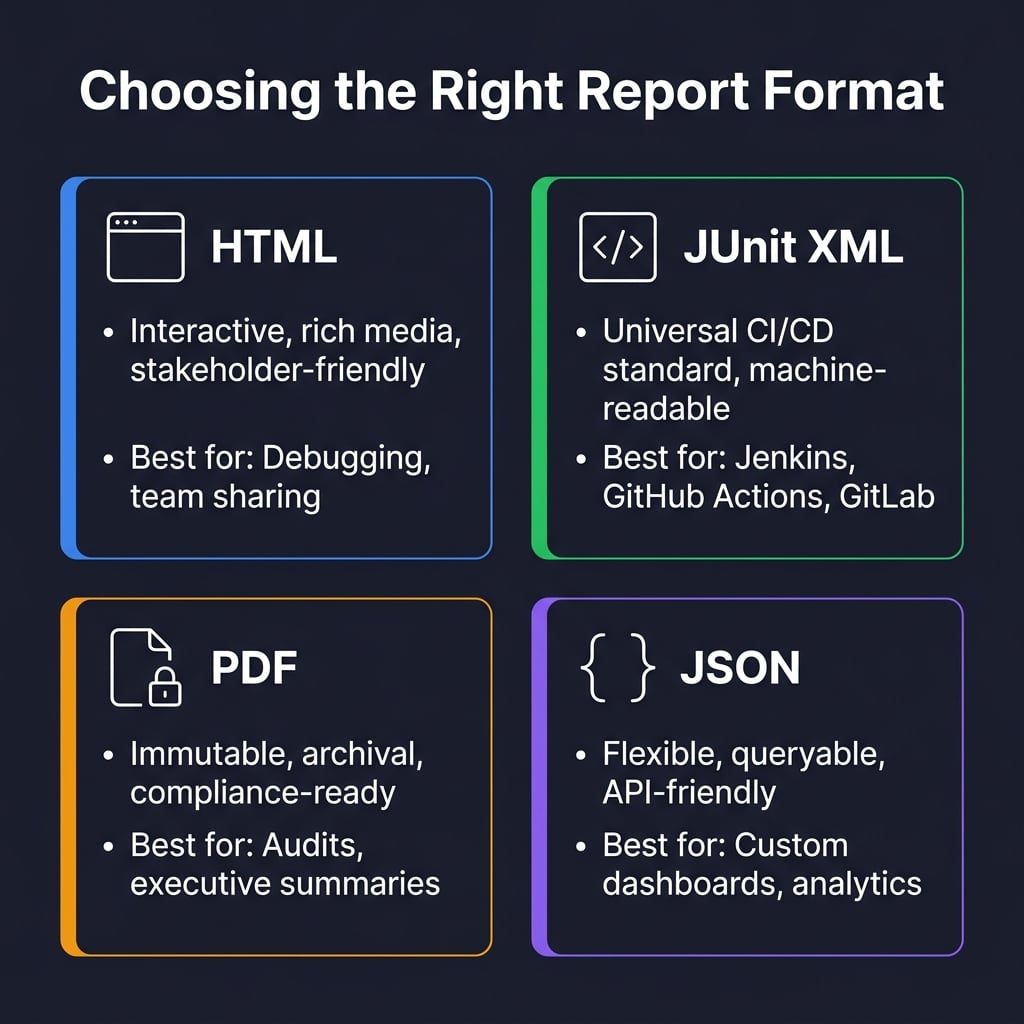
Different audiences need different formats. Choosing the wrong one means the report either does not get read or cannot be consumed by your tooling.
HTML reports
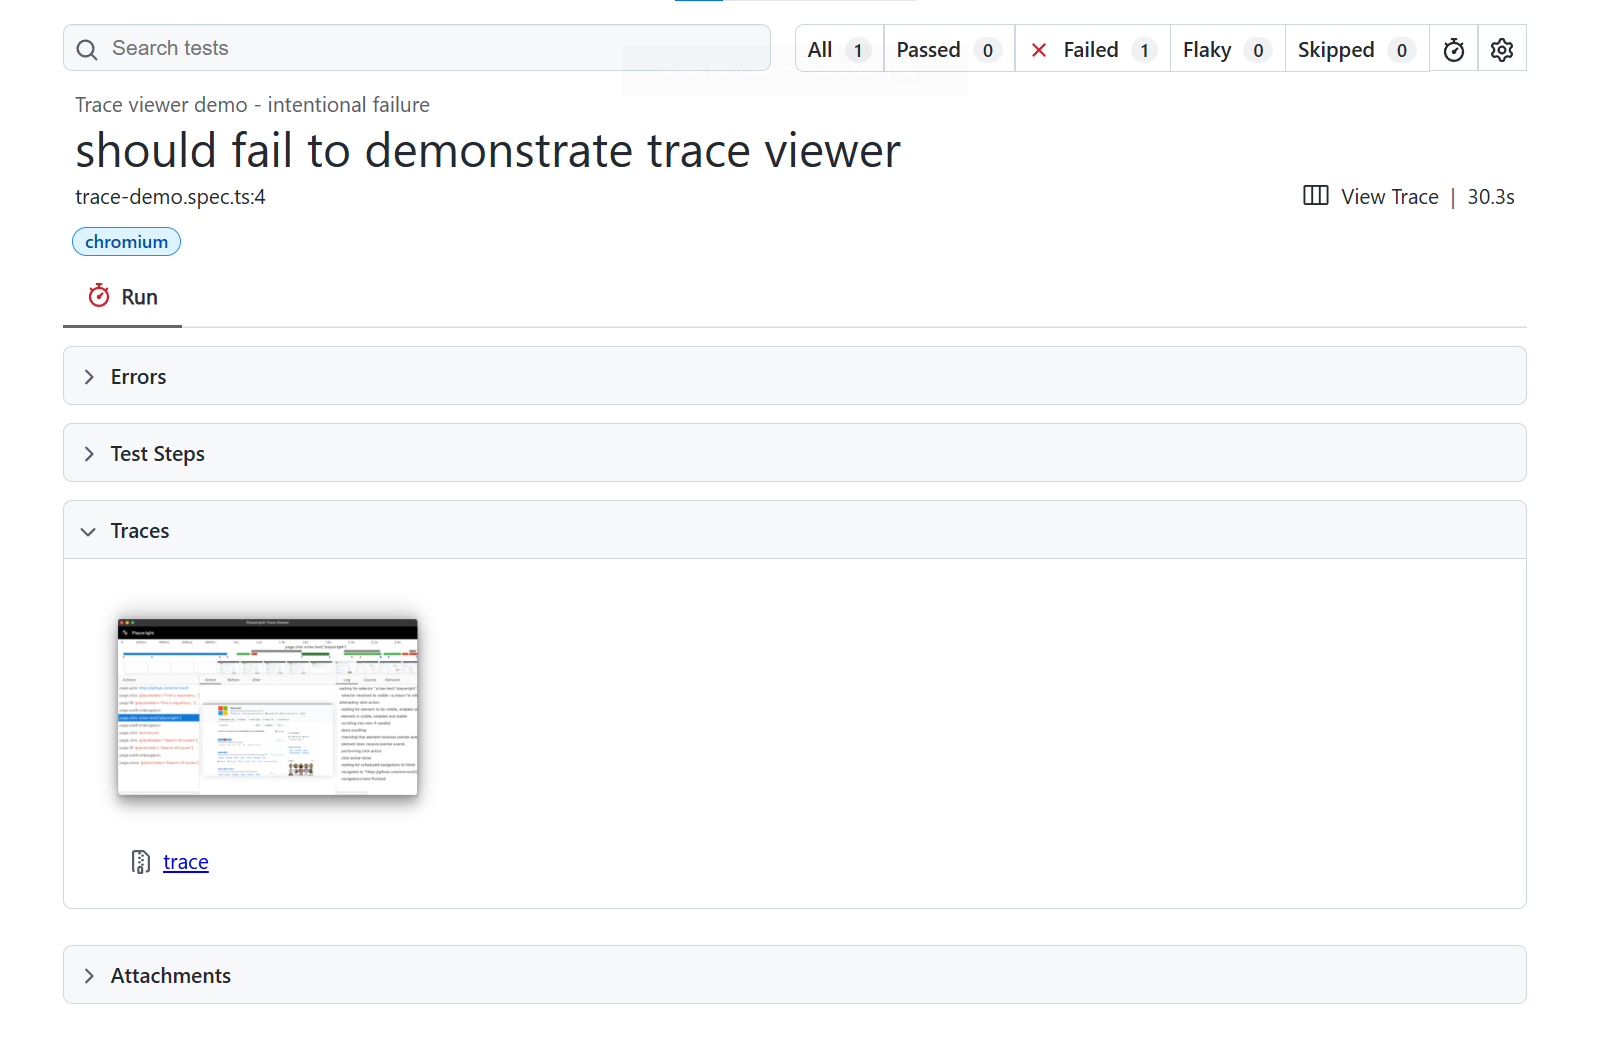
HTML is the default choice for human-readable reports. It opens in any browser, supports embedded screenshots and videos, and lets viewers filter results interactively.
Frameworks like Playwright generate HTML reports out of the box. These include expandable test steps, embedded trace viewer replays, and filterable failure lists.
HTML works best when the primary audience is developers and QA engineers who need to debug failures quickly.
JUnit XML
JUnit XML is the universal format for machine consumption. Nearly every CI/CD platform (Jenkins, GitHub Actions, GitLab CI, Azure DevOps) can parse it natively.
The format captures test names, execution times, pass/fail status, and error messages in a standardized XML structure.
<!-- junit-report.xml -->
<testsuites tests="150" failures="3" time="42.7">
<testsuite name="LoginSuite" tests="25" failures="1" time="8.3">
<testcase name="should login with valid credentials" classname="LoginSuite" time="1.2"/>
<testcase name="should reject invalid password" classname="LoginSuite" time="0.8">
<failure message="Expected status 401 but got 500" type="AssertionError"/>
</testcase>
</testsuite>
</testsuites>
Note: Always configure your test framework to output JUnit XML alongside your primary format. It gives you maximum flexibility to switch CI platforms or reporting tools later without changing test code.
PDF reports
PDF creates a permanent, unchangeable record. It is the right choice when you need to archive results for compliance audits, attach evidence to release notes, or create monthly executive summaries.
Most teams generate PDFs from HTML reports using headless browsers or libraries like Puppeteer. This lets you maintain one report template and output both formats.
JSON reports
JSON provides the most flexibility for custom workflows. Use it when you need to aggregate data from multiple test runs, feed results into analytics pipelines, or build custom dashboards with tools like Grafana.
Allure reports
Allure combines the visual appeal of HTML with the analytical depth of a dedicated platform. It adds test history, trend analysis, severity categorization, and flaky test detection on top of standard reporting.
Allure integrates with Playwright, Selenium, Cypress, Jest, and most major frameworks through dedicated adapters.
Format comparison table
| Format | Best audience | Strengths | Limitations | CI/CD support |
|---|---|---|---|---|
| HTML | Developers, QA, stakeholders | Interactive, rich media, browser-native | Not machine-parseable | Artifact upload |
| JUnit XML | CI/CD tools, dashboards | Universal parsing, lightweight | No visual elements | Native in all major platforms |
| Executives, compliance teams | Immutable, archival-ready | Static, no interactivity | Requires post-processing | |
| JSON | Data engineers, custom tooling | Flexible, queryable, API-friendly | Requires custom rendering | Requires custom integration |
| Allure | Full team, cross-framework | History, trends, rich UI | Additional infra needed | Plugin-based |

Top tools for test report generation
The test report tools landscape in 2026 goes beyond formatting results. Modern tools analyze failures, detect patterns, and provide actionable recommendations.
Playwright built-in reporters
Playwright ships with several reporters that cover most needs without additional packages. The official Playwright documentation lists five built-in reporters: list, dot, line, HTML, and JSON.
import { defineConfig } from '@playwright/test';
export default defineConfig({
reporter: [
['html', { outputFolder: 'test-results/html' }],
['junit', { outputFile: 'test-results/junit.xml' }],
['json', { outputFile: 'test-results/results.json' }]
],
});
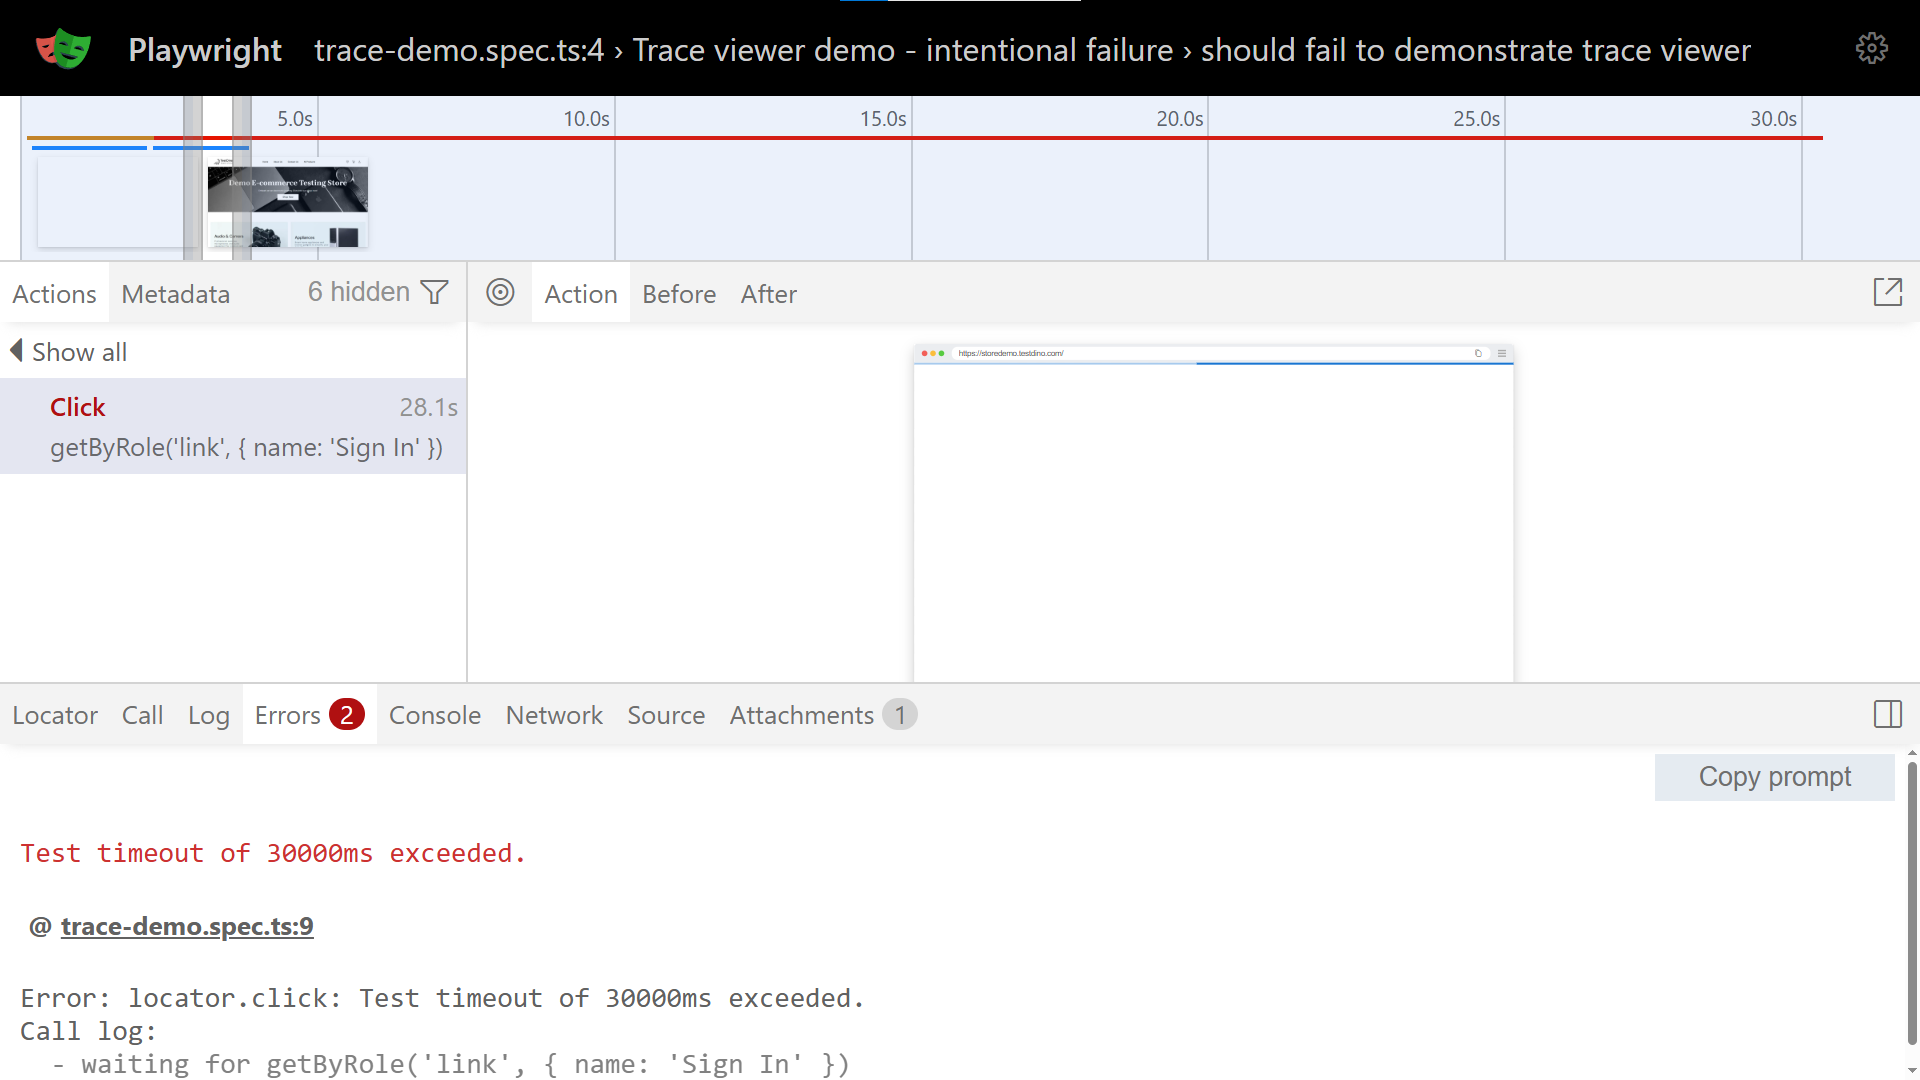
The HTML reporter includes an embedded trace viewer for stepping through DOM snapshots, network requests, and console logs. Teams following Playwright best practices configure multiple reporters simultaneously to serve different audiences from a single test run.
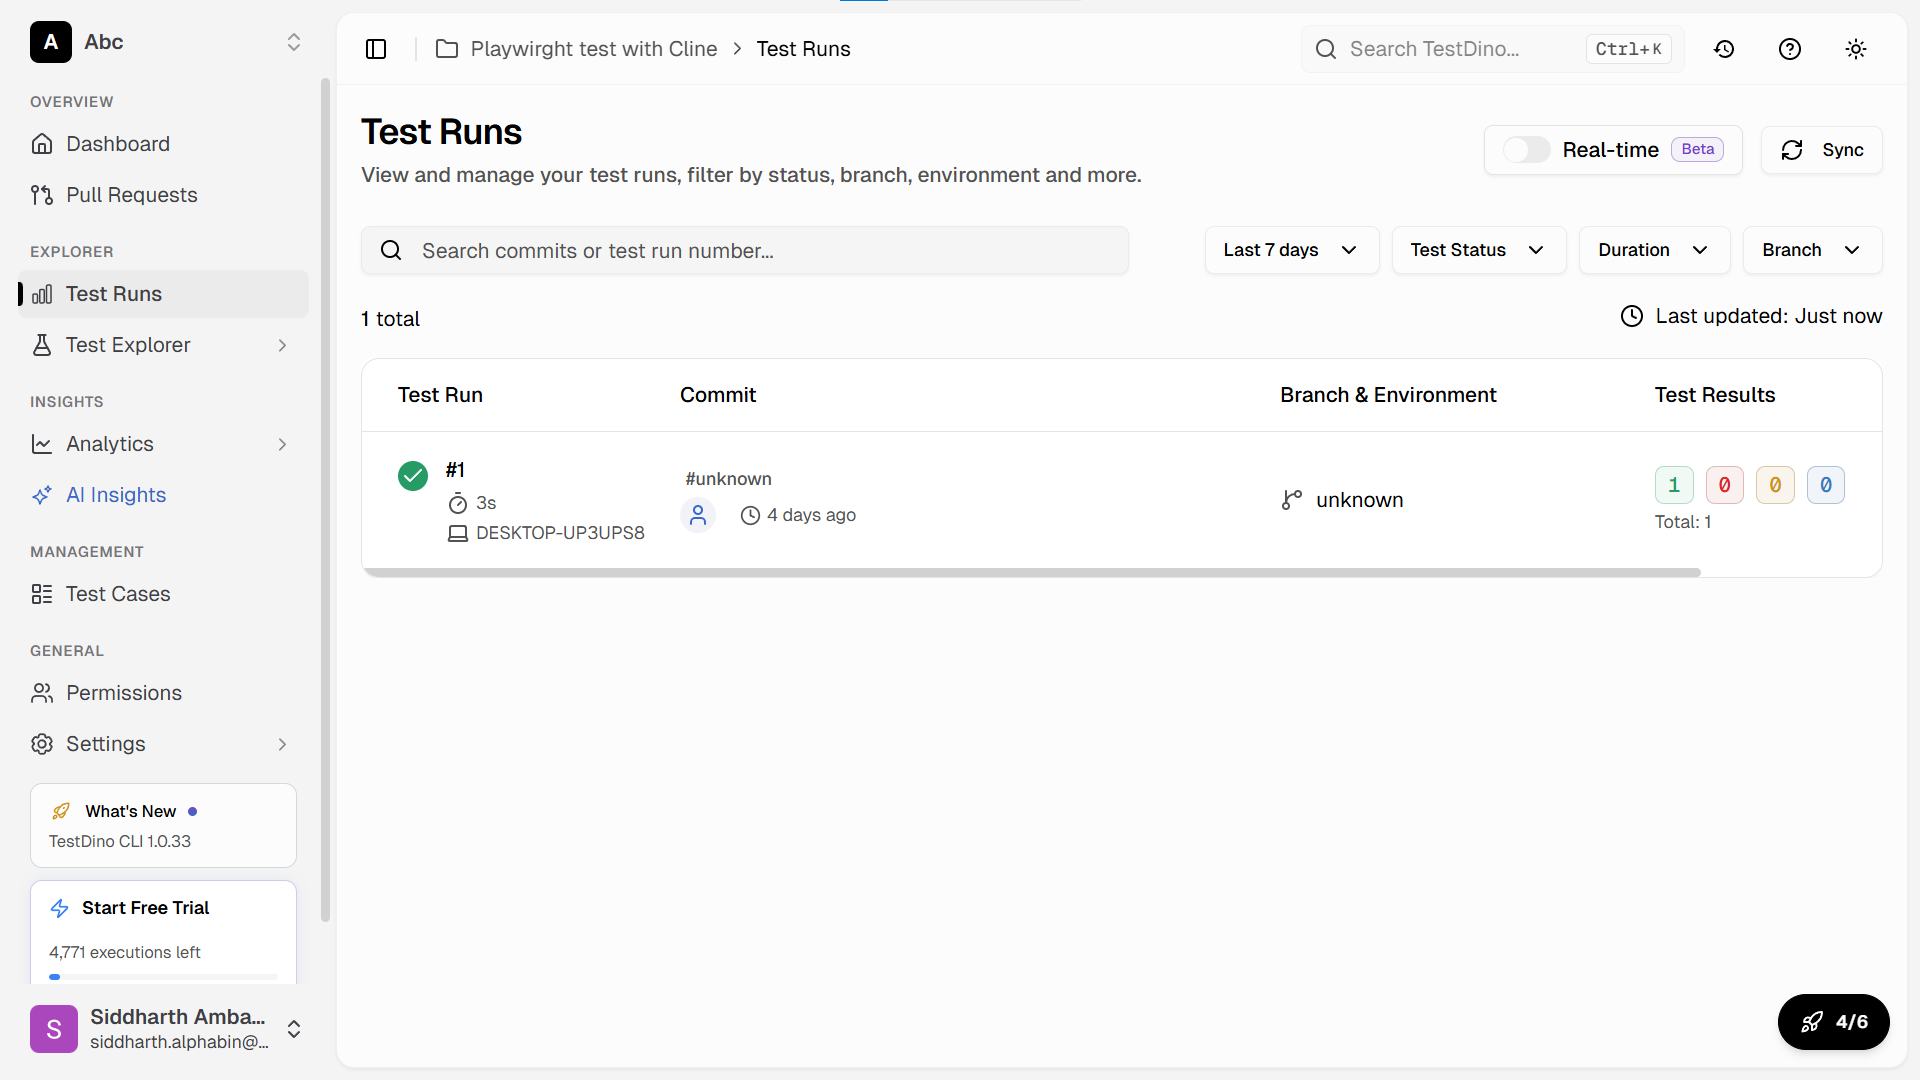
TestDino
TestDino is a Playwright-native reporting and analytics platform that turns raw test output into a centralized, interactive dashboard. Instead of downloading HTML artifacts from CI and opening them locally, teams get a single URL where every test run is tracked, compared, and searchable.
What sets it apart from traditional reporters is AI-powered failure classification. When tests fail, TestDino automatically groups them into categories like actual bugs, flaky tests, UI changes, and infrastructure issues. This eliminates the manual triage step that eats hours every week.
Key capabilities include:
-
Centralized dashboard: Every CI run (local or pipeline) feeds into one place
-
AI failure analysis: Auto-classify failures by root cause, not just error message
-
Flaky test tracking: Monitor pass rates per test across builds and get alerts when stability drops
-
PR-level insights: Test results linked to GitHub pull requests, branches, and commits
-
Artifact consolidation: Screenshots, videos, traces, and logs in one view per test
Setting it up takes under five minutes. Add the TestDino reporter to your Playwright config, set your API token as a CI environment variable, and your next pipeline run starts populating the dashboard automatically.
export default defineConfig({
reporter: [
['html', { open: 'never' }],
['@testdino/reporter']
],
});
Allure Report
Allure transforms test results into comprehensive documentation with categorized failures, test history, and timeline views.
npm install --save-dev allure-playwright
npx playwright test
allure generate ./allure-results --clean
allure open ./allure-report
Allure works across frameworks (Playwright, Selenium, Cypress, Jest, pytest) through dedicated adapters. It tracks retries, detects flaky tests, and shows parallel execution timelines.
Mochawesome
Mochawesome creates clean HTML reports for Mocha-based frameworks. It integrates well with Cypress and provides inline screenshots, custom branding, and detailed error messages.
const { defineConfig } = require('cypress');
module.exports = defineConfig({
reporter: 'mochawesome',
reporterOptions: {
reportDir: 'cypress/reports',
overwrite: false,
html: true,
json: true
}
});
ReportPortal
ReportPortal is an open-source platform for centralized test reporting at scale. It provides real-time analytics, ML-powered failure analysis, and integrations with defect tracking systems.
It works well for large organizations running thousands of tests across multiple teams and frameworks.
ExtentReports
ExtentReports is popular in Java-based testing ecosystems. It generates rich HTML reports with charts, categories, and system information. Teams using Selenium with TestNG or JUnit often pair it with ExtentReports.
Custom reporters
When off-the-shelf tools do not meet specific requirements, most frameworks let you build custom reporters.
import { Reporter, TestCase, TestResult } from '@playwright/test/reporter';

class CustomReporter implements Reporter {
  onTestEnd(test: TestCase, result: TestResult) {
    const duration = result.duration;
    const status = result.status;
// Send to internal monitoring, Slack, or custom dashboards
console.log(`[${status.toUpperCase()}] ${test.title} (${duration}ms)`);
}
}
export default CustomReporter;
Custom reporters make sense when you need to integrate with internal tools, generate proprietary formats, or calculate organization-specific metrics.
Tool comparison table
| Tool | Framework support | Setup effort | History tracking | AI/ML analysis | Self-hosted option |
|---|---|---|---|---|---|
| Playwright HTML | Playwright only | None (built-in) | No | No | Yes (local files) |
| TestDino | Playwright | Low | Yes | Yes (AI) | No (cloud) |
| Allure Report | Most frameworks | Moderate | Yes | No | Yes |
| Mochawesome | Mocha/Cypress | Low | No | No | Yes |
| ReportPortal | Most frameworks | High | Yes | Yes (ML) | Yes |
| ExtentReports | Java (TestNG/JUnit) | Low | No | No | Yes |
How to generate test reports in popular frameworks
Each framework handles report generation differently. Here are working configurations for the most common setups.
Playwright test reports
Configure reporters in your config file, run tests, and Playwright handles everything.
export default defineConfig({
reporter: [
['html', { open: 'never' }],
['junit', { outputFile: 'results.xml' }]
],
use: {
screenshot: 'only-on-failure',
video: 'retain-on-failure',
trace: 'retain-on-failure'
}
});
The open: 'never' setting prevents the report from auto-opening in CI environments. For Playwright e2e testing setups, always enable trace capture on failure. Traces record DOM snapshots, network activity, and console logs for every action.
Cypress test reports
Cypress uses Mocha reporters under the hood. The default spec reporter prints results to the console only.
For shareable HTML reports, install Mochawesome:
npm install --save-dev mochawesome mochawesome-merge mochawesome-report-generator
module.exports = defineConfig({
e2e: {
reporter: 'mochawesome',
reporterOptions: {
reportDir: 'cypress/reports',
overwrite: false,
html: true,
json: true,
timestamp: 'mmddyyyy_HHMMss'
}
}
});
Cypress automatically captures screenshots on failure and records videos. Configure Mochawesome to embed these in the HTML output.
Jest test reports
Jest supports multiple reporters through its configuration file.
module.exports = {
reporters: [
'default',
['jest-html-reporter', {
pageTitle: 'Test Report',
outputPath: 'test-report.html',
includeFailureMsg: true
}],
['jest-junit', {
outputDirectory: './reports',
outputName: 'junit.xml'
}]
]
};
For unit testing setups, pair Jest reports with coverage reports to show both test results and code coverage in a single view. Python teams using pytest can achieve similar multi-format output with pytest-html and pytest-junitxml plugins.
Selenium test reports
Selenium does not include built-in reporting. It relies on the test framework running alongside it (TestNG, JUnit, pytest) to generate reports.
For Java-based Selenium tests with TestNG:
<suite name="Test Suite">
<listeners>
<listener class-name="org.testng.reporters.EmailableReporter"/>
<listener class-name="org.testng.reporters.JUnitReportReporter"/>
</listeners>
<test name="Selenium Tests">
<classes>
<class name="com.example.LoginTest"/>
</classes>
</test>
</suite>
Many Selenium teams integrate with Allure or ExtentReports for richer visualization and failure analysis beyond what default framework reporters provide.
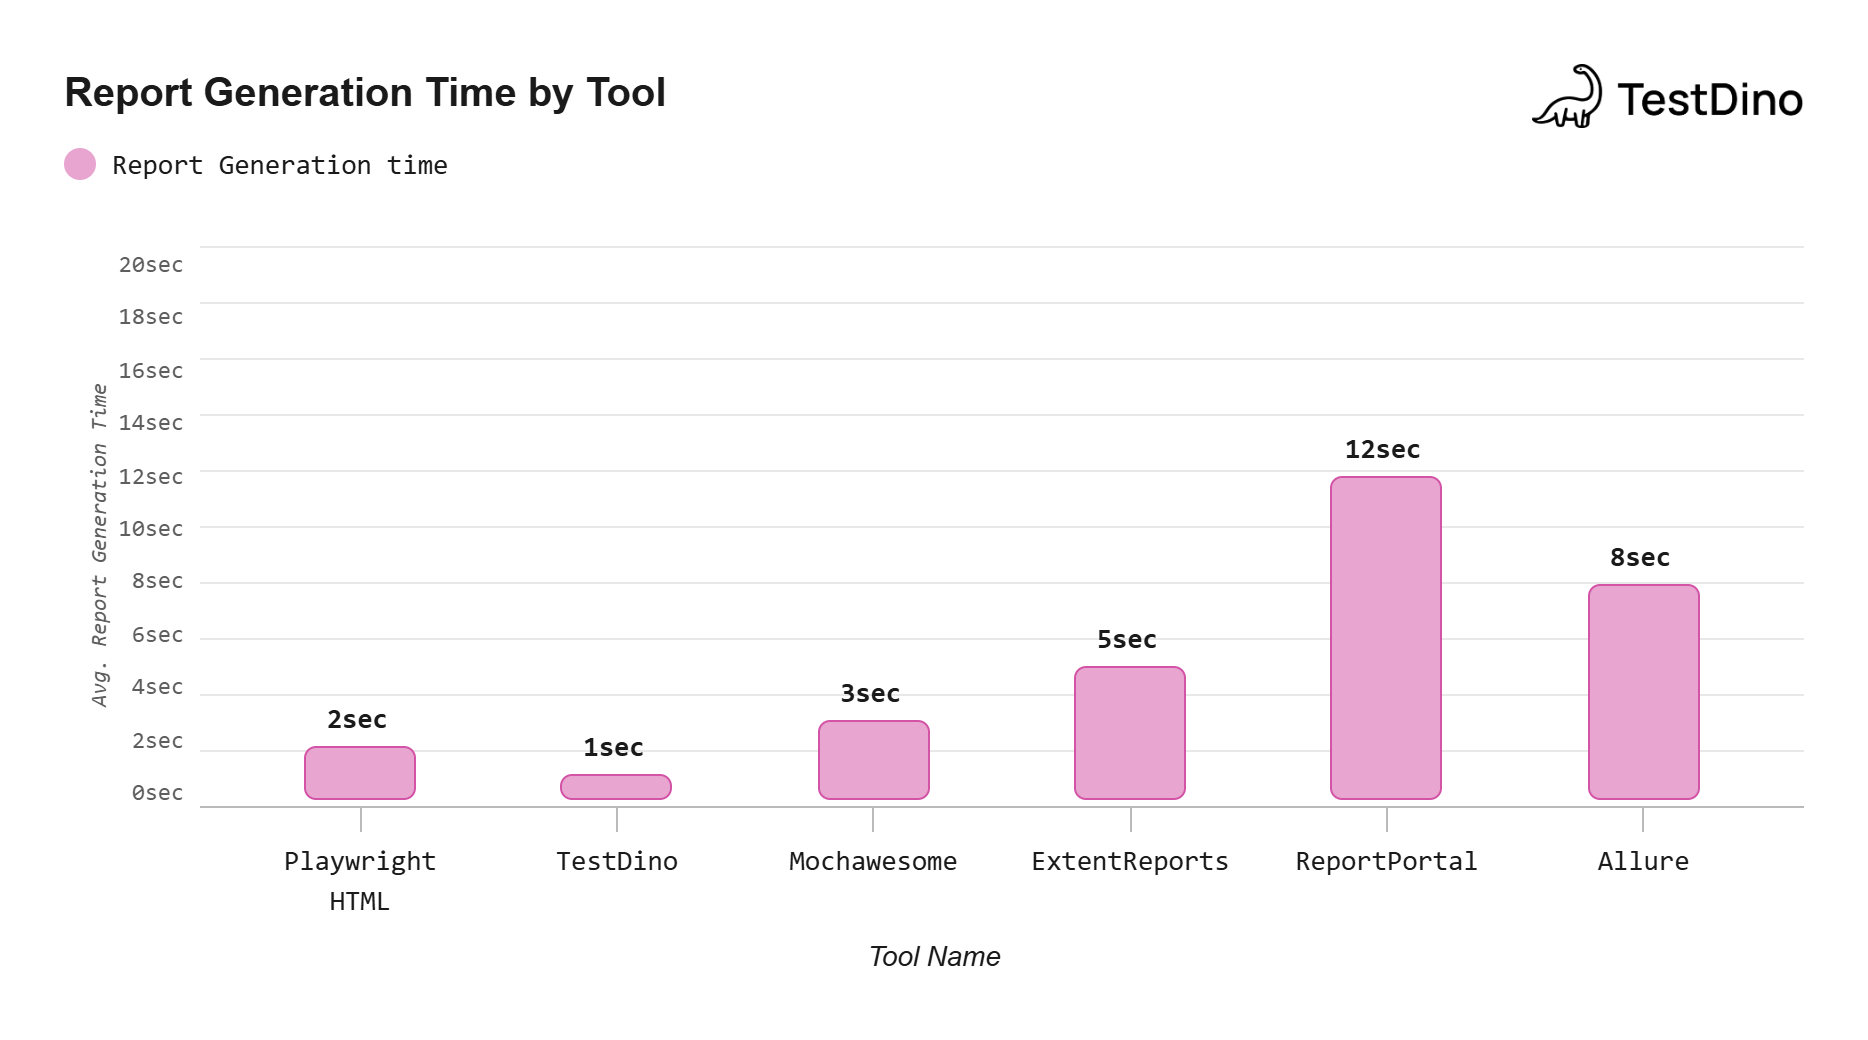
Source: Measured from generating reports on a 500-test suite across each tool using default configurations.Note: Times vary based on test suite size and system hardware; TestDino's time reflects CI JSON upload rather than local HTML rendering.
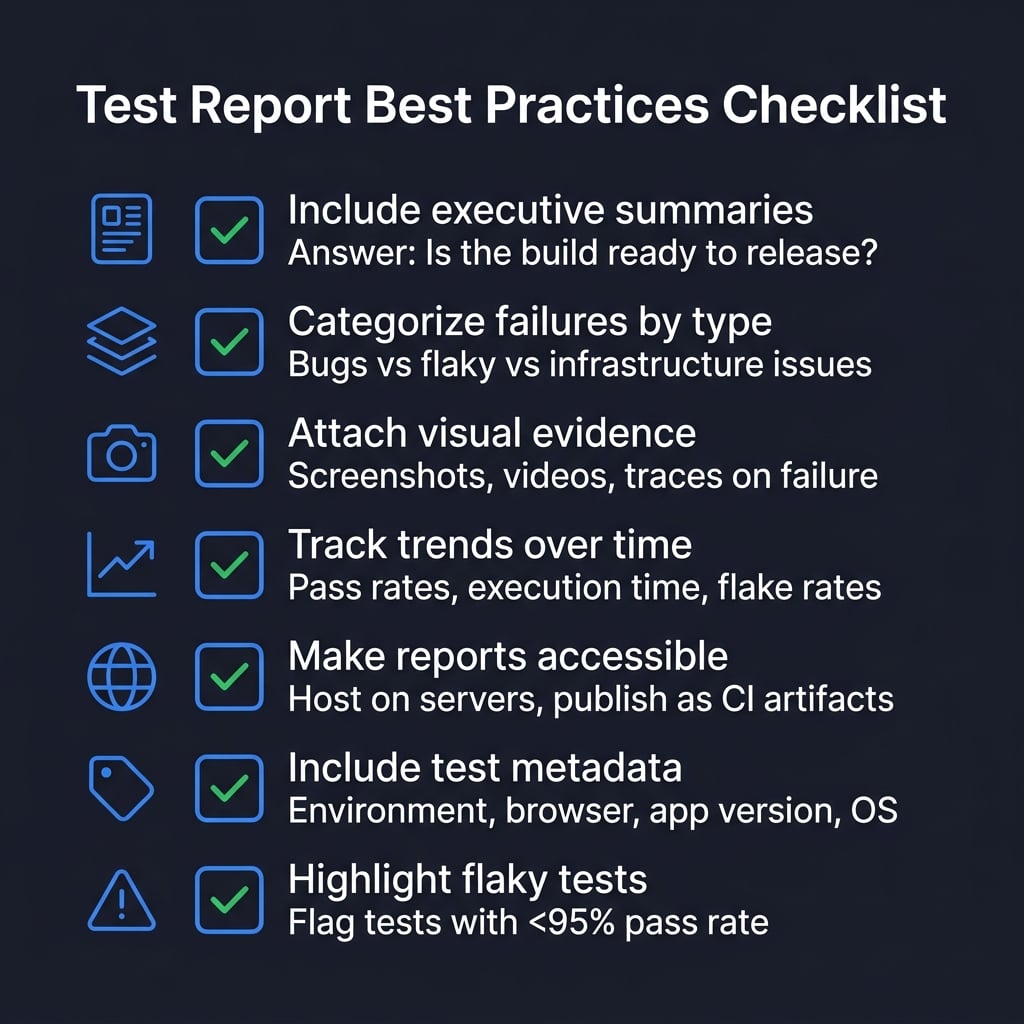
Best practices for test execution reports
A good test execution report tells a story about quality. It does not just dump pass/fail counts on a page. The difference between a report that gets read and one that gets ignored comes down to structure, clarity, and relevance.
Include executive summaries
Start every report with a short summary that answers three questions: Is the build stable? What are the risks? Should we release?
# Executive Summary Example
- 487 of 500 tests passed (97.4%)
- 8 failures are known flaky tests (already tracked)
- 5 new failures require investigation before release
- Recommendation: Hold release until new failures are triaged
Keep executive summaries free of technical jargon. If a non-technical stakeholder cannot understand it in 30 seconds, it needs rewriting. The software test report structure guide covers this in more detail.
Categorize failures by type
Not all failures are equal. Separate actual bugs from flaky tests, infrastructure issues, and test code problems.
This categorization changes how teams prioritize:
-
Actual bug: Blocks the release, needs a fix
-
Flaky test: Needs investigation but does not block
-
Infrastructure issue: Retry the build, not a code problem
-
Test code error: Fix the test, not the application
Attach visual evidence
Screenshots and videos make debugging dramatically faster. Configure your framework to capture these artifacts on failure.
export default defineConfig({
use: {
screenshot: 'only-on-failure',
video: 'retain-on-failure',
trace: 'retain-on-failure'
}
});
Visual evidence also helps when communicating failures to developers who did not write the tests. A screenshot of a broken layout communicates the problem instantly.
Track trends over time
Single test runs give you a snapshot. Trends across builds reveal the real story.
A common anti-pattern is treating each test run as an isolated event. When teams only react to the latest results without comparing against previous runs, they miss gradual degradation that eventually leads to a broken pipeline.
Track these metrics over time:
-
Pass rate per build: Is overall quality improving or declining?
-
Average execution time: Are tests slowing down?
-
Flaky test count: Is test stability degrading?
-
New failure rate: Are more tests breaking each sprint?
Tip: Tests with a pass rate below 95% across the last 10 runs should be flagged as flaky and prioritized for investigation. Tracking this automatically prevents flaky tests from silently eroding pipeline confidence.
Make reports accessible
Reports sitting on a developer's local machine help nobody. Host them where the team can access them:
-
Upload as CI artifacts (GitHub Actions, GitLab CI, Jenkins)
-
Publish to internal servers with permanent URLs
-
Send summaries via Slack or email with links to the full report
-
Use a test observability platform that aggregates results automatically
Include test metadata
Add context so readers understand the conditions under which tests ran.
export default defineConfig({
metadata: {
environment: process.env.TEST_ENV || 'staging',
appVersion: process.env.APP_VERSION,
browser: 'chromium',
os: process.platform
}
});
This metadata helps reproduce failures and explains why results differ between environments or browser configurations.
Highlight flaky tests
Flaky tests erode trust in the entire test suite. When the team stops believing test results, they stop reading reports altogether.
Identify flaky tests by tracking pass rates for individual tests across multiple runs. Reducing test maintenance starts with fixing the tests that fail inconsistently.
Common flakiness causes include:
-
Timing issues and race conditions
-
Hardcoded waits instead of proper locator strategies
-
Shared test state between parallel runs
-
External API dependencies without mocking
Integrating test reports into CI/CD pipelines
Test reports deliver the most value when they are generated automatically on every commit and accessible without digging through CI logs. This is the foundation of continuous testing: every code change triggers tests, generates a report, and surfaces results to the team without manual intervention.
GitHub Actions configuration
name: Test Suite
on: [push, pull_request]
jobs:
test:
runs-on: ubuntu-latest
steps:
- uses: actions/checkout@v4
- uses: actions/setup-node@v4
with:
node-version: '20'
- run: npm ci
- run: npx playwright install --with-deps
- run: npx playwright test
- uses: actions/upload-artifact@v4
if: always()
with:
name: test-report
path: playwright-report/
retention-days: 30
The if: always() condition ensures reports are uploaded even when tests fail, which is exactly when you need them most.
Send notifications with report summaries
Wire up Slack or email notifications so the team sees results without opening CI.
- name: Notify Slack
if: always()
uses: slackapi/slack-github-action@v1
with:
payload: |
{
"text": "Test run completed on ${{ github.ref_name }}",
"blocks": [
{
"type": "section",
"text": {
"type": "mrkdwn",
"text": "*Test Results for ${{ github.ref_name }}*\nStatus: ${{ job.status }}\nCommit: ${{ github.sha }}"
}
}
]
}
Block deployments on failures
Use test reports as quality gates. Configure required status checks that must pass before code can merge.
In GitHub, go to Settings > Branches > Branch protection rules and add your test job as a required status check. This prevents merging code that breaks existing tests.
Archive reports for compliance
Regulated industries (healthcare, finance, automotive) require maintaining test evidence for audits.
- name: Archive to S3
if: always()
run: |
aws s3 cp playwright-report/ \
s3://test-reports/${{ github.sha }}/ \
--recursive
This creates a permanent, Git-commit-linked archive that auditors can retrieve at any time.
Multi-environment matrix builds
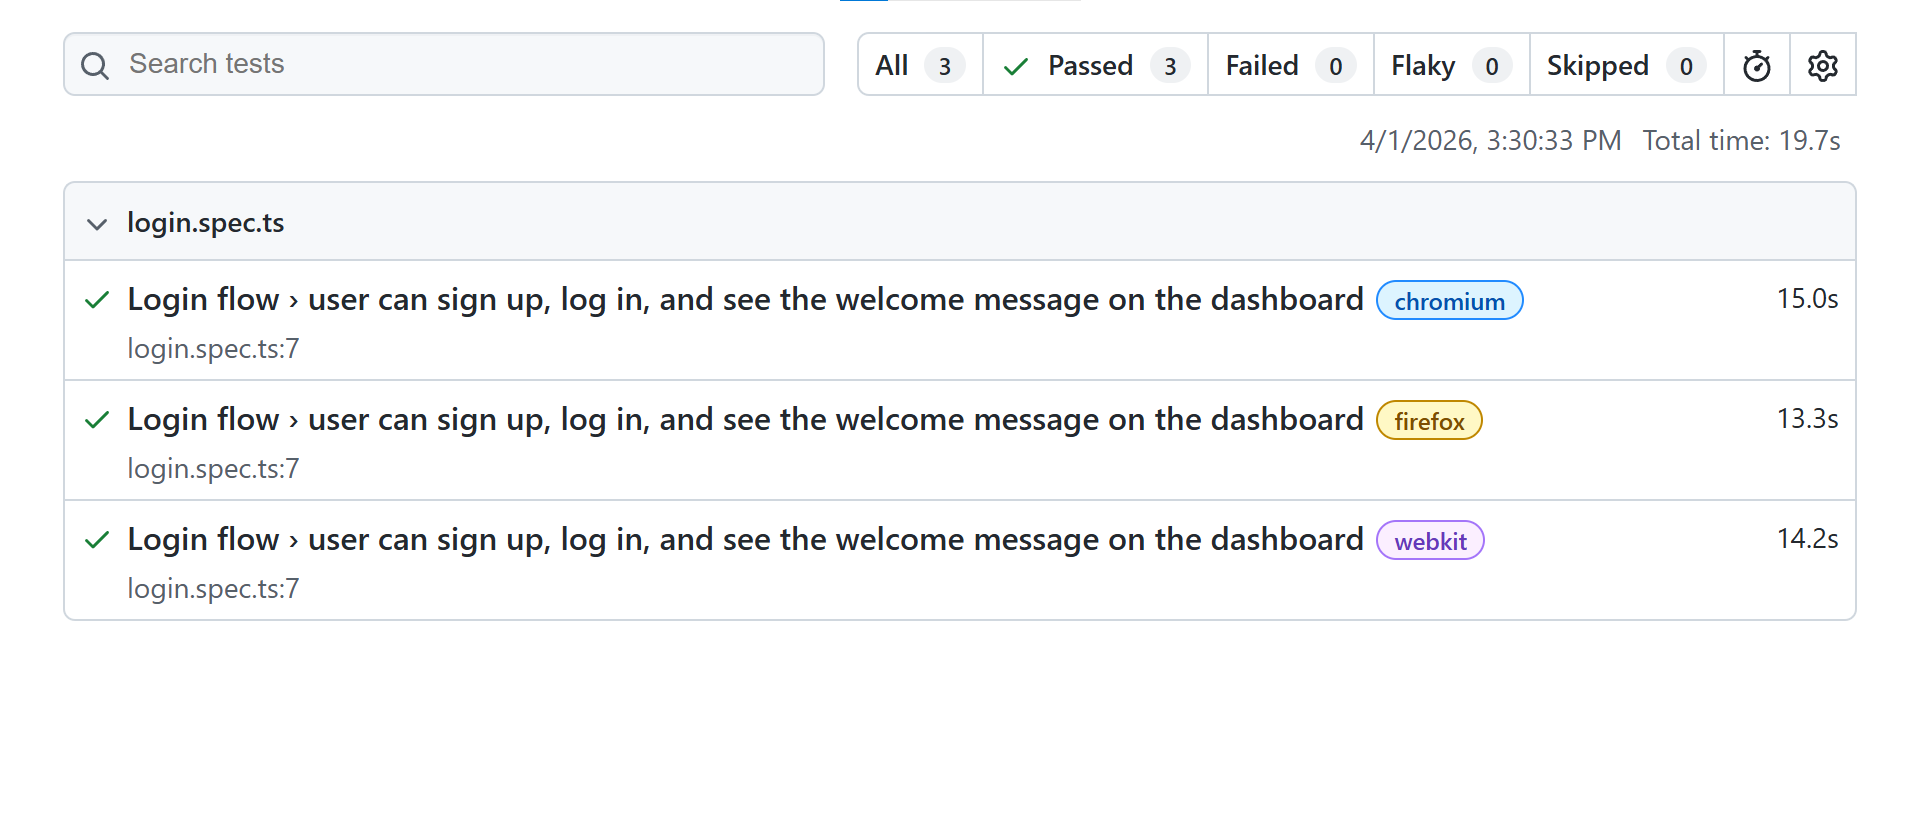
Run tests across multiple browser and environment combinations using matrix builds. This surfaces environment-specific issues and provides separate reports for each configuration.
strategy:
matrix:
browser: [chromium, firefox, webkit]
environment: [staging, production]
steps:
- run: npx playwright test --project=${{ matrix.browser }}
env:
TEST_ENV: ${{ matrix.environment }}
Teams using Playwright annotations can tag tests with @smoke or @regression to run different subsets across different pipeline stages.
TestDino collects reports from CI runs automatically and provides a centralized dashboard. This eliminates the workflow of downloading artifacts from CI, unzipping them, and opening HTML files manually. Teams that have adopted AI-powered test generation alongside automated reporting see the largest improvements in their feedback loop speed.
Conclusion
Test report generation turns raw test output into decisions. When done right, it removes hours of manual work, makes quality visible to the entire organization, and creates an audit trail that protects you during incidents.
Start simple. Use your framework's built-in reporters (Playwright HTML, Jest HTML, Cypress Mochawesome). Add JUnit XML for CI/CD parsing. Then layer on additional tools as your needs grow.
The most impactful upgrade is moving from local reports to centralized dashboards. When every team member can access the latest test results from a single URL, quality conversations happen faster and release decisions are backed by data.
TestDino takes this further by applying AI to categorize failures, detect flaky tests, and track trends automatically across every CI run. The shift from "what happened" to "why it happened and what to do next" is what separates basic reporting from test intelligence.
Frequently asked questions
Table of content
Flaky tests killing your velocity?
TestDino auto-detects flakiness, categorizes root causes, tracks patterns over time.
Follow Us