Playwright Observability Platform: What your CI Setup is Missing
A complete guide to Playwright observability platforms: what they do, the 8 core capabilities, and setup instructions.
When a test fails in CI: You open the logs → Find the job → Navigate to artifacts → Download the zip → Unzip it → Run a local command to open the trace viewer.
That's 7 steps before you even start debugging.
Now multiply that by 5 failures a day, across 4 engineers. That's your team's morning.
This is the gap between test execution and test understanding. Playwright gives you excellent tools for running tests. But once those results leave CI, they vanish.
A Playwright observability platform fills that gap. It collects, stores, and analyzes your test results across every CI run, so your team stops reacting to individual failures and starts seeing patterns.
This guide explains what observability means for Playwright teams, what your current setup is missing, and how to close the gap.
Standard Playwright reporting tells you what happened in one run. An observability platform tells you what's been happening across hundreds of runs.
Here's the difference:
| Capability | Playwright built-in reporters | Observability platform |
|---|---|---|
| Single-run results | HTML, JSON, JUnit | Plus stored permanently |
| Historical trends | Each run overwrites the last | Every run preserved and searchable |
| Flaky test detection | Manual investigation | Automatic detection with stability scores |
| Failure classification | You read the error message | AI categorizes: bug, flaky, infrastructure |
| Cross-run analytics | Not available | Duration trends, failure rates, pass rates |
| Team dashboards | Single HTML file, local only | Role-based views for QA, devs, managers |
| Trace/screenshot storage | CI artifacts expire | Permanent, centralized, searchable |
| Real-time streaming | Results after run completes | Results stream as tests execute |

Tip: The key difference isn't features. It's persistence. Built-in reporters generate files that exist for the duration of a CI job. An observability platform creates a permanent, queryable record of every test result your team has ever produced.
Why your current CI setup isn't enough
Most Playwright teams start with this configuration:
// playwright.config.ts
export default defineConfig({
  reporter: [
    ['html', { open: 'never' }],
    ['json', { outputFile: 'results.json' }],
  ],
  use: {
    trace: 'on-first-retry',
    screenshot: 'only-on-failure',
  },
});
This works fine for small teams with maybe 50 tests. It breaks down fast at scale.
Here's what goes wrong:
Problem 1: Reports disappear
The HTML report is a static file generated inside a CI runner. Once the job ends, the file is gone unless you explicitly save it as an artifact. Even then, CI artifacts typically expire in 7-30 days.
That test that failed 3 weeks ago? The one that might explain today's regression? Gone.
Problem 2: No cross-run visibility
Each Playwright run produces an isolated report. There's no way to answer questions like:
-
Is this test flaky, or did it just fail today?
-
Has this test been getting slower over the last 2 weeks?
-
Which tests fail most often on the main branch vs feature branches?
-
Is our overall suite health improving or declining?
You'd need to compare reports across dozens of runs manually. Nobody wants to do that.
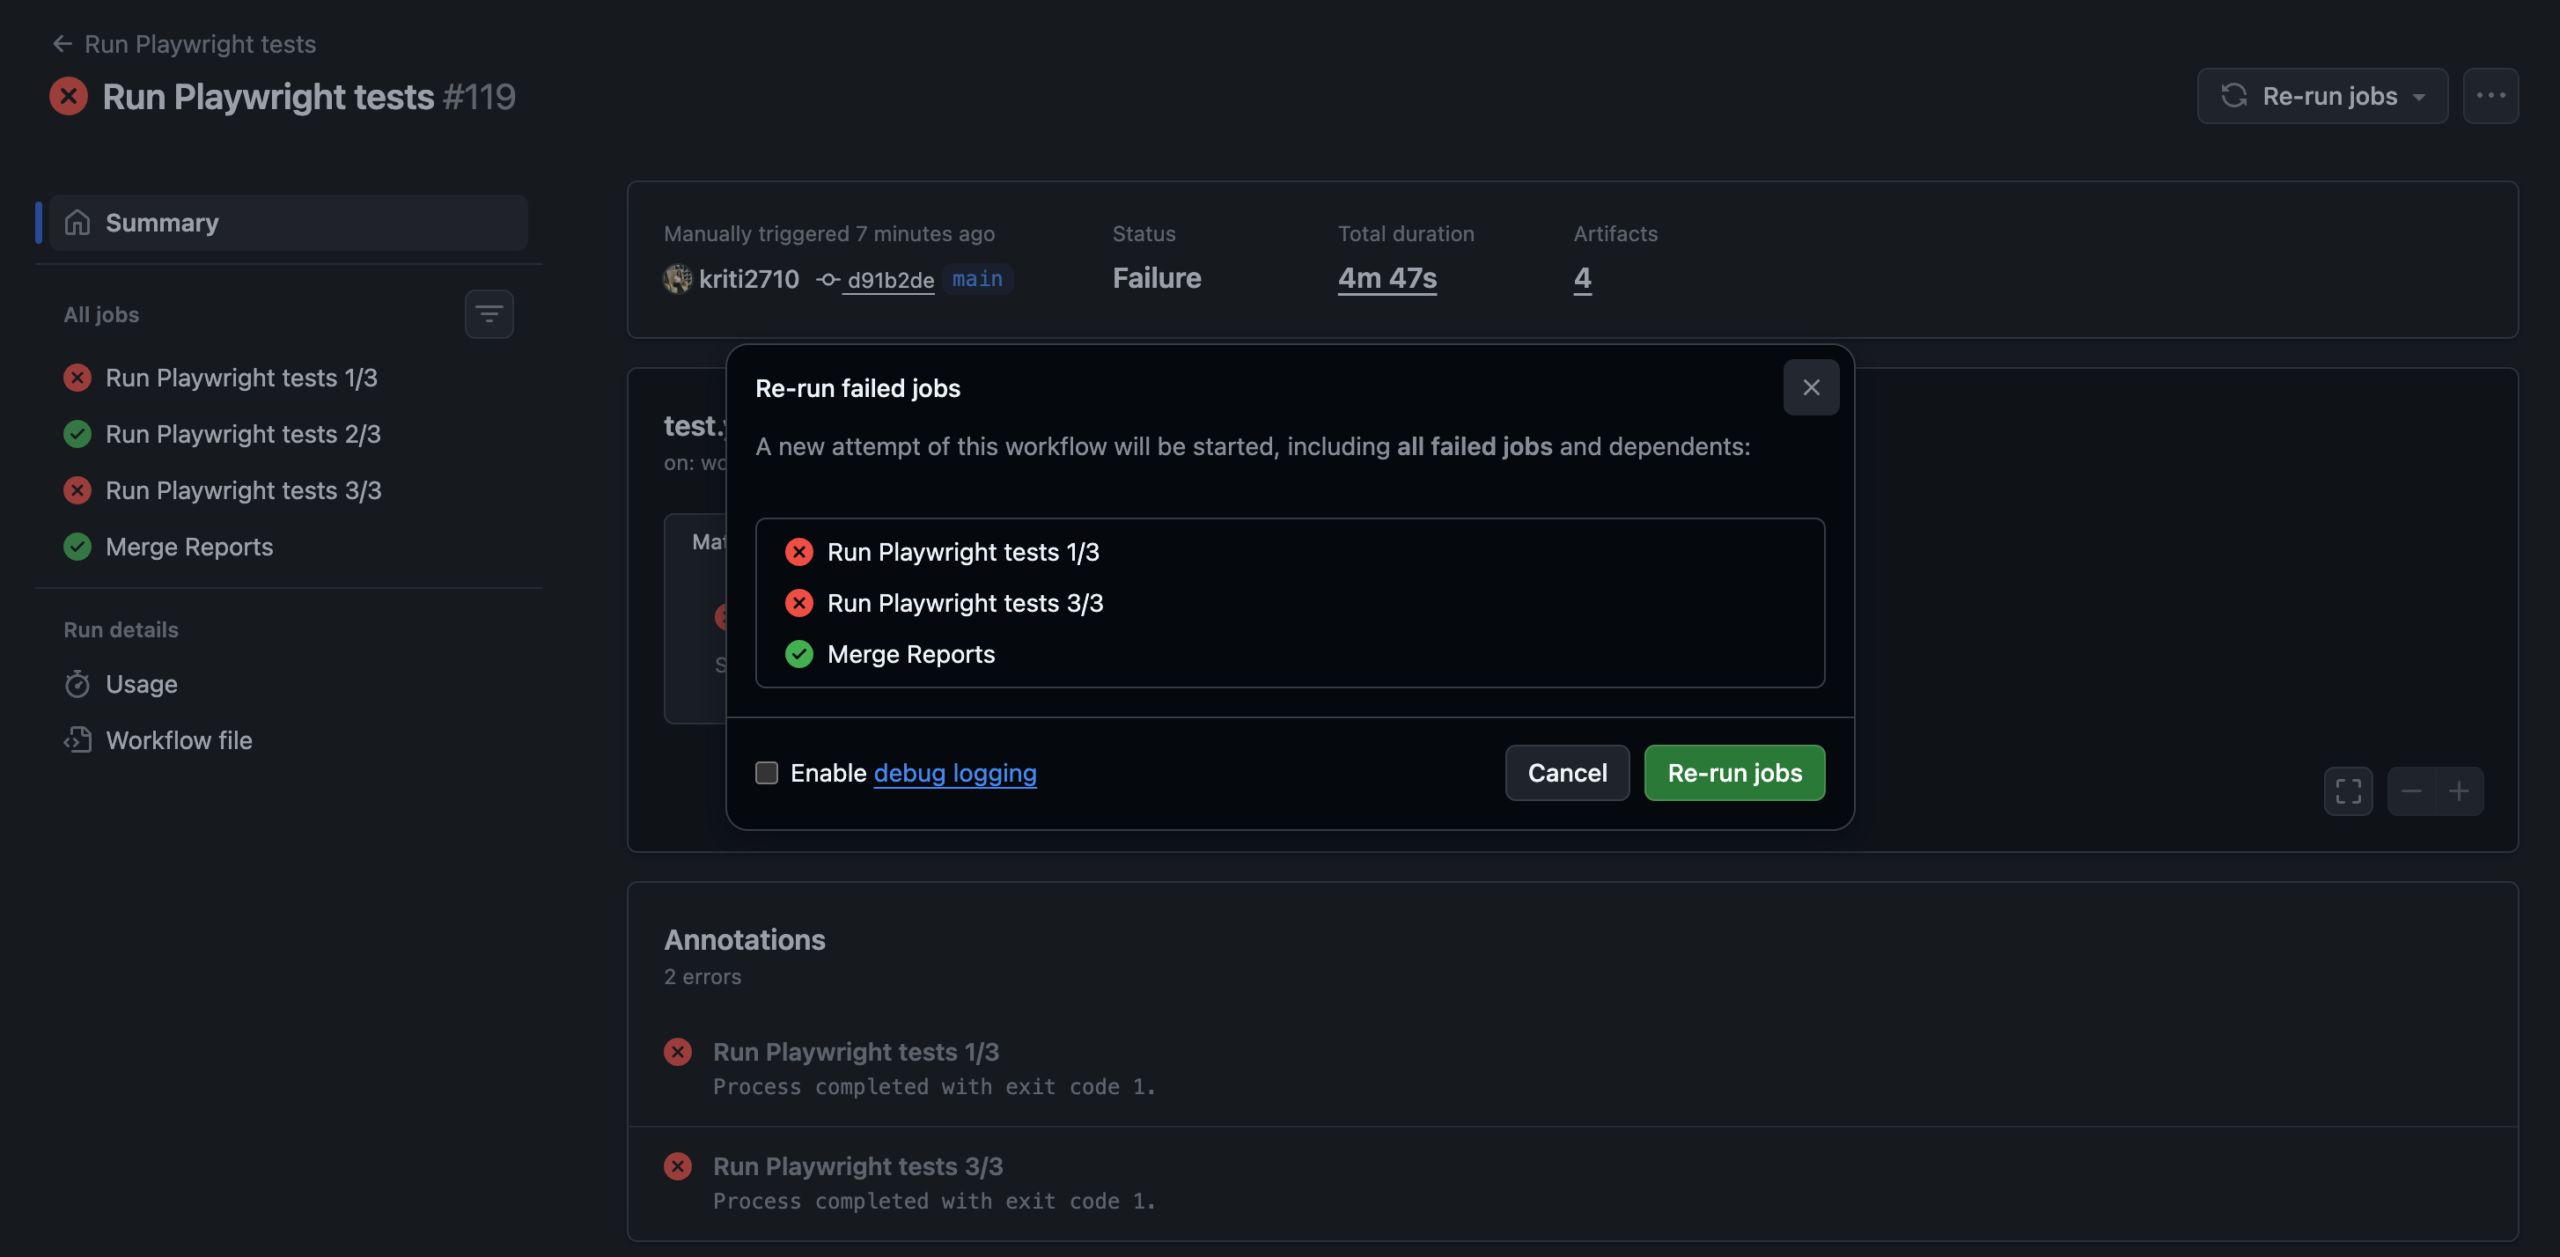
Problem 3: Debugging requires artifact archaeology
When a test fails in CI, the typical debugging workflow looks like this:
-
Open the CI job log
-
Find the failing test name
-
Navigate to the artifacts tab
-
Download the trace zip file
-
Unzip it locally
-
Run npx playwright show-trace trace.zip
-
Now you can finally start investigating
That's 5-10 minutes of setup before you even begin debugging. Multiply that by 3-5 failures per day across a team, and you're looking at hours of wasted effort every week.
Note: Slack saved 553 hours per quarter through automated flaky test detection alone. That's 23 full engineering days, or roughly one engineer working full-time for nearly 6 months a year, just on triage.
Problem 4: Flaky tests hide in plain sight
An estimated 15-30% of automated test failures are flaky, meaning the test itself or the environment caused the failure, rather than a real bug.
Without historical tracking, you can't distinguish a flaky test from a legitimate failure. Teams resort to rerunning pipelines, hoping the failure will go away.
A team running 500 tests daily with a 5% flakiness rate sees 25 false failures. If each investigation takes even 10 minutes, that's over 4 hours of wasted debugging daily.
The 8 capabilities of a Playwright observability platform
Not all platforms offer the same capabilities. Here's what separates a genuine observability platform from a basic reporting tool.
1. Real-time test streaming
Real-time streaming pushes individual test results to a dashboard the moment each test finishes, rather than waiting for the full suite to complete.
Standard reporters produce results only after the entire test suite finishes. In a 30-minute pipeline, that means 30 minutes of silence before you know anything failed.
Real-time streaming changes the feedback loop completely:
-
See failures as they happen, not after the pipeline ends
-
Stop wasting CI time on a build you already know is broken
-
Get Slack notifications instantly when a critical test fails, not 30 minutes later
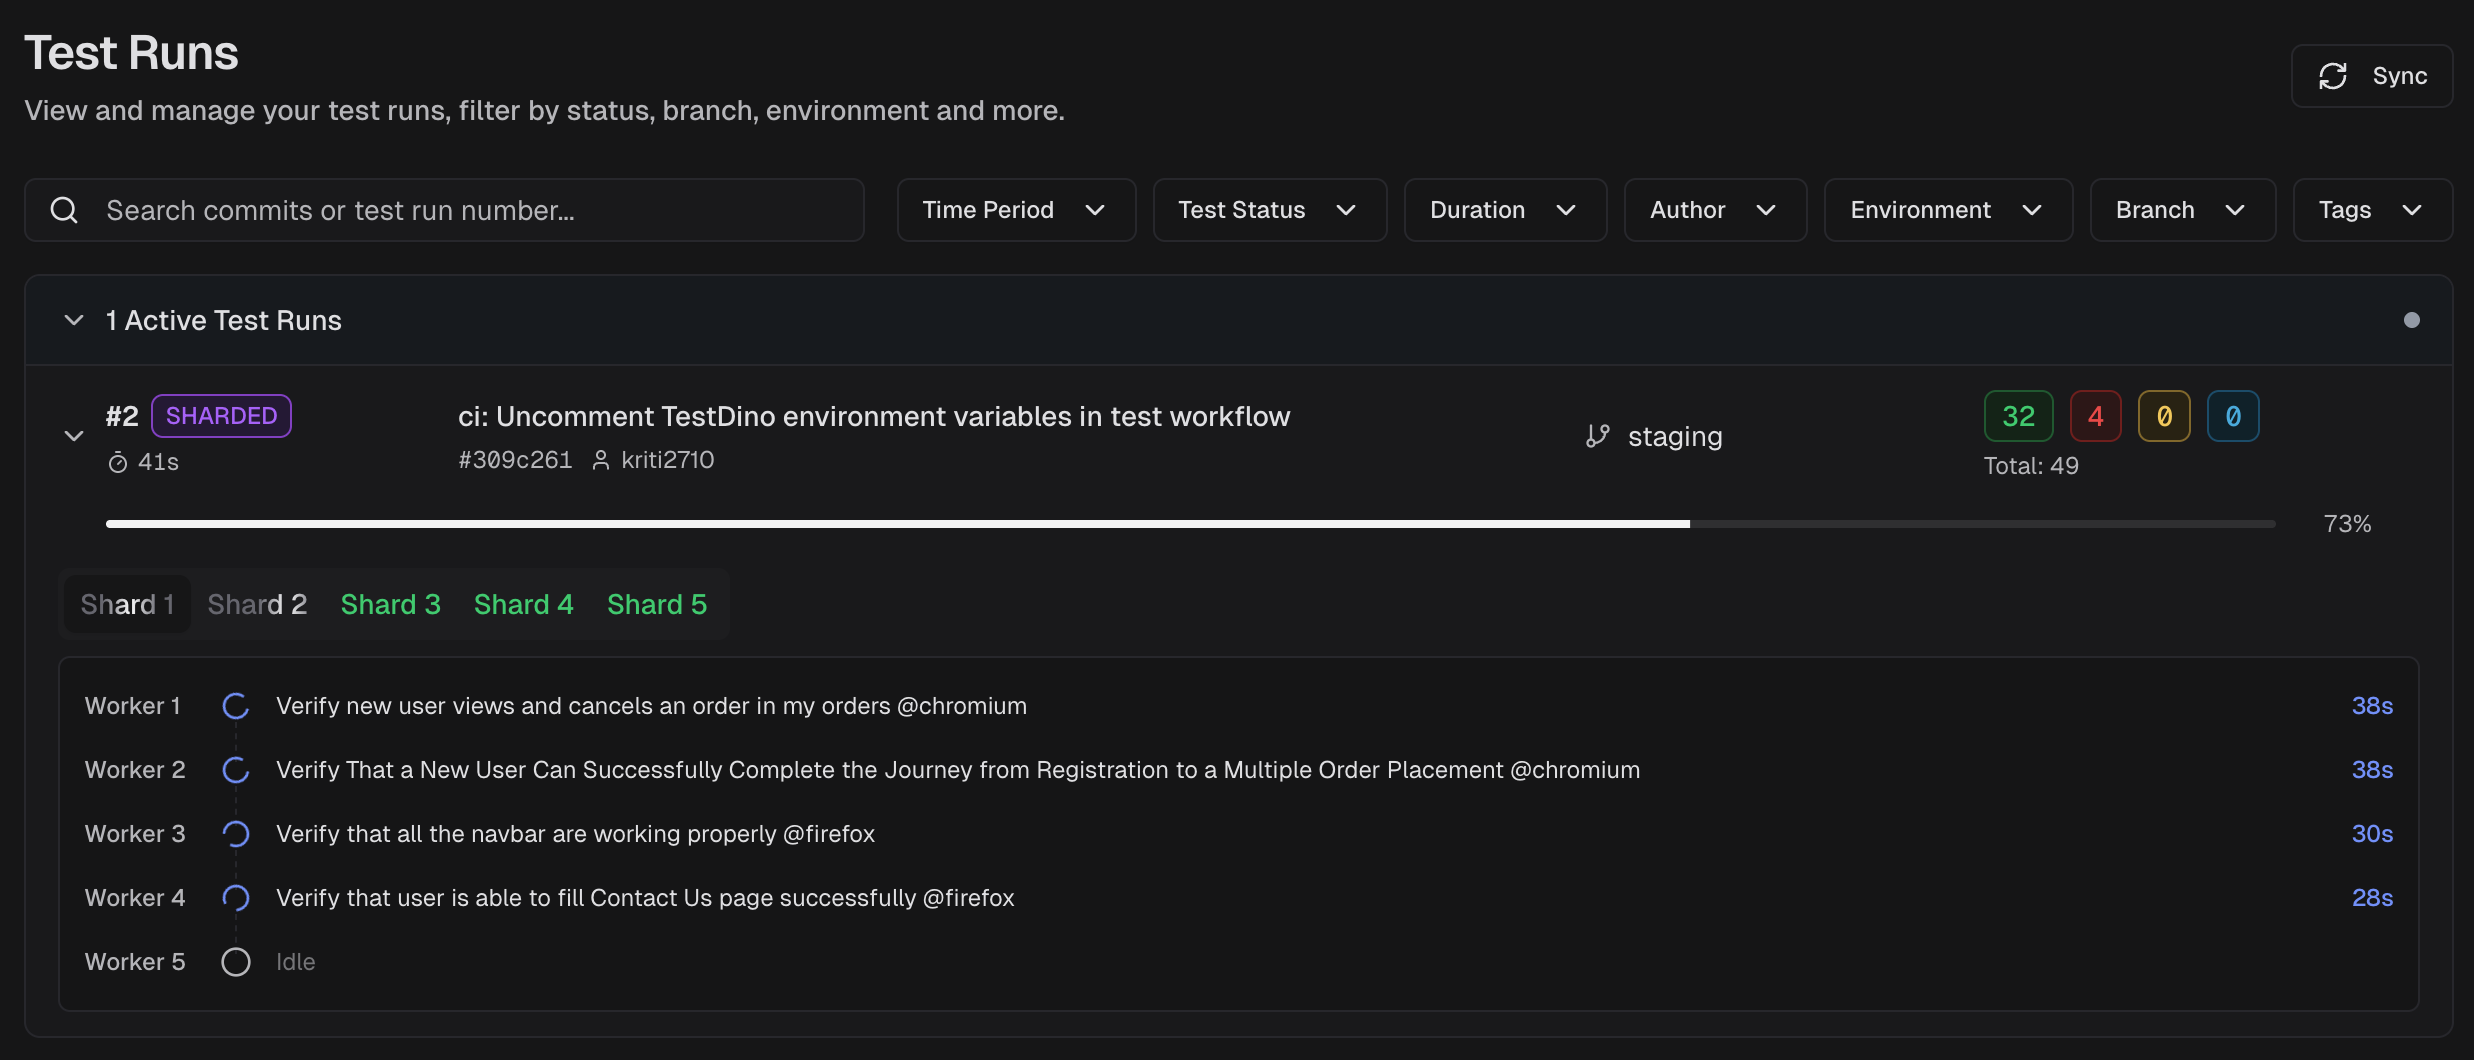
TestDino's real-time streaming sends results to the dashboard within seconds of each test completing.
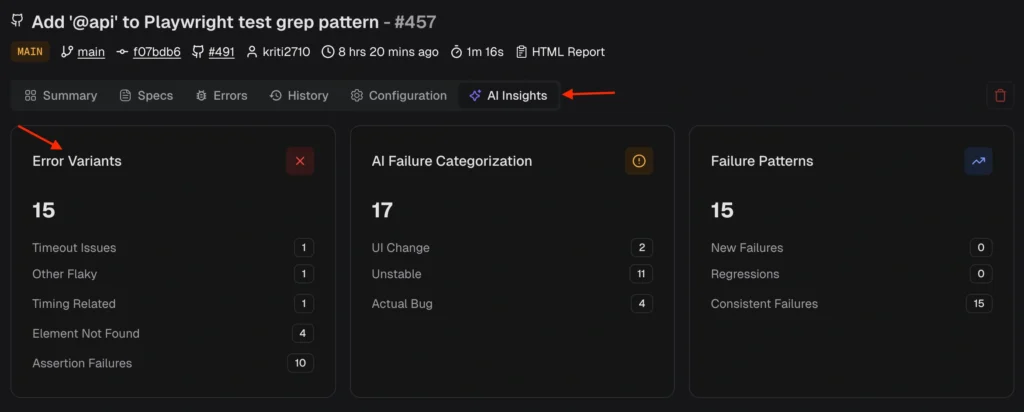
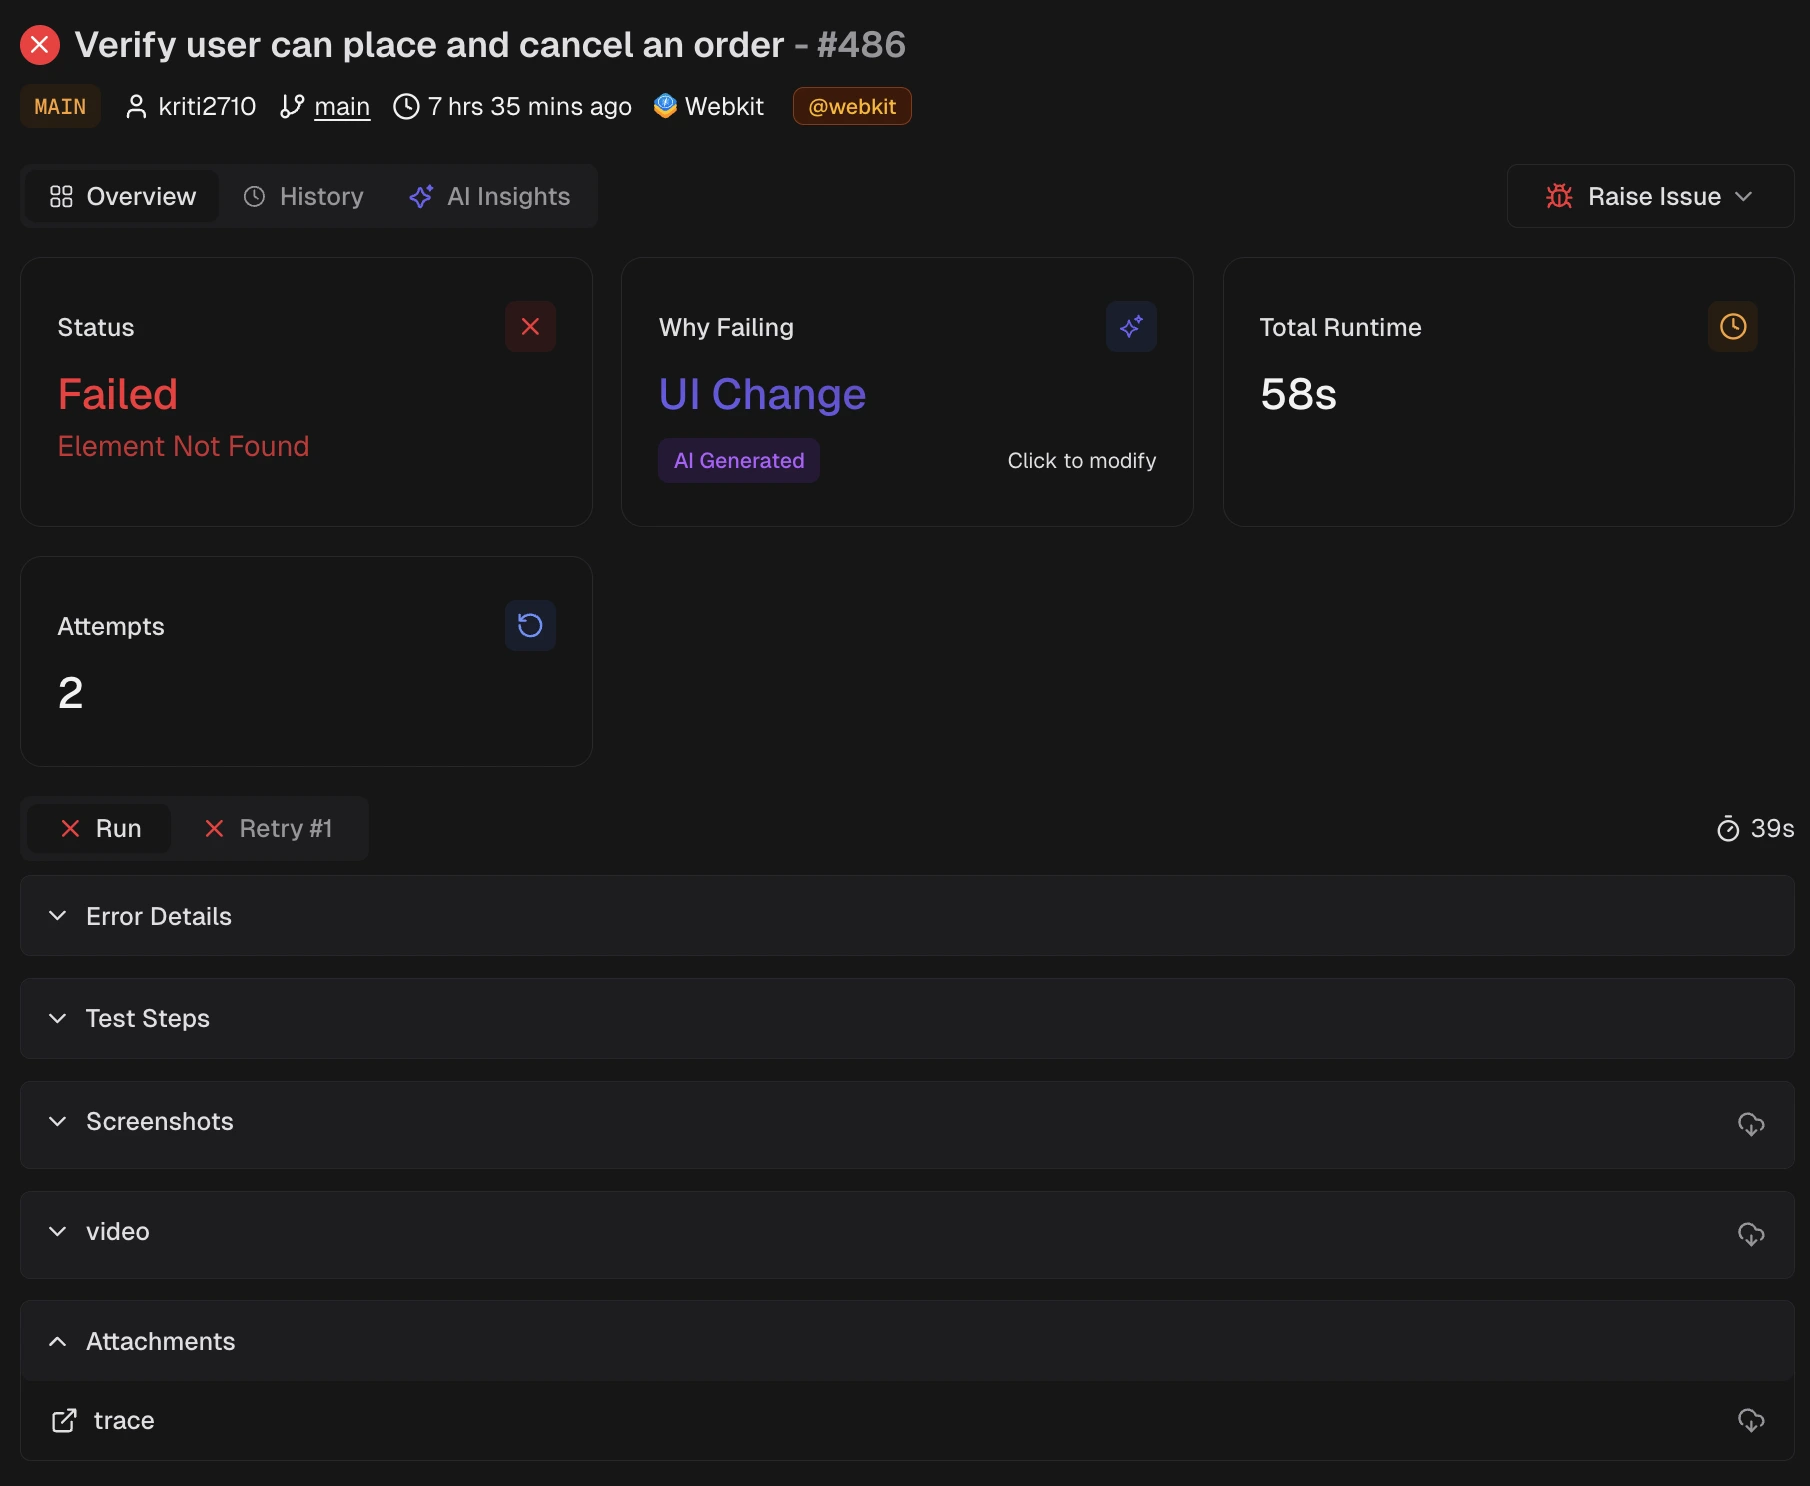
2. AI failure classification and error grouping
When a test fails, the first question is always: "Is this a real bug, or just noise?"
Answering that manually takes 10-20 minutes per failure. Reading the error message, checking the trace, comparing with previous runs, and using your judgment. Now multiply that by 15 failures in a morning.
AI failure classification automates this in two layers:
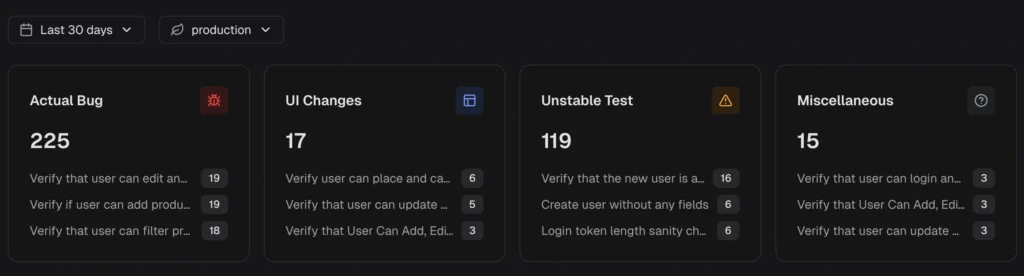
Layer 1: Classification
Each failure is categorized automatically:
| Category | What it means | Action |
|---|---|---|
| Actual Bug | Consistent failure indicating a product defect | Fix first, this is a real risk |
| UI Change | Selector or DOM change broke a test step | Update locators or flows |
| Unstable Test | Intermittent behavior, passes on retry | Stabilize, deflake, or quarantine |
| Miscellaneous | Setup, data, or CI issues | Resolve to prevent false signals |
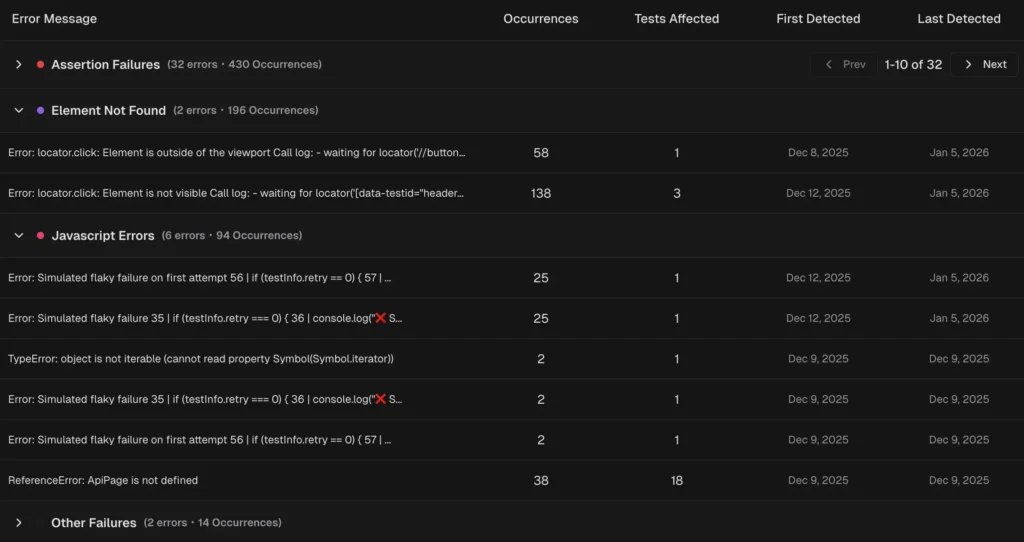
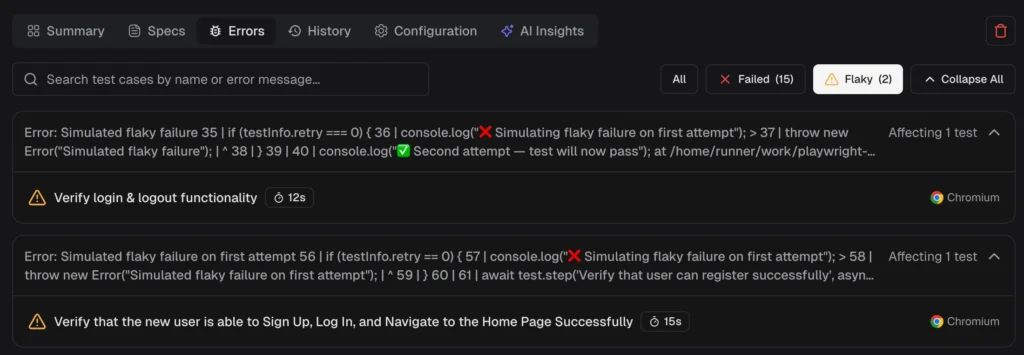
Layer 2: Error grouping
Failures with the same root cause are grouped. Instead of investigating 50 individual failures, your team fixes 3 root causes.
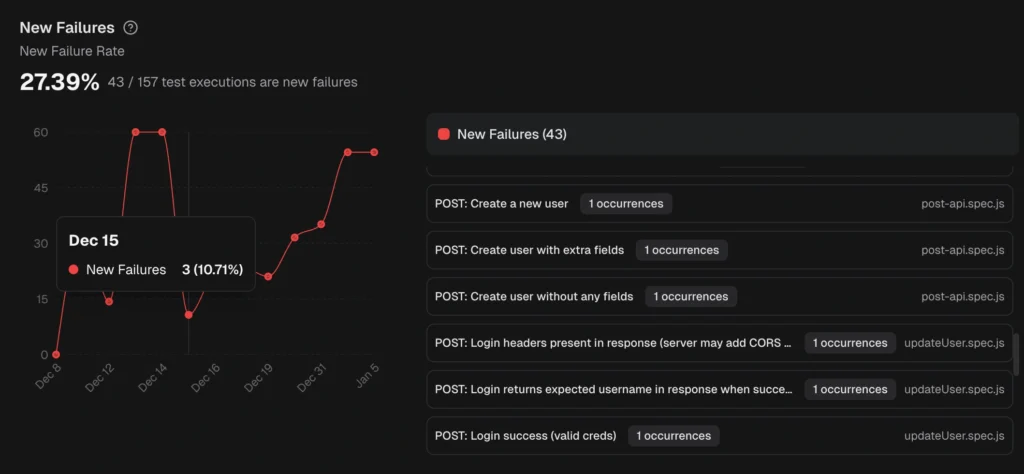
The platform also surfaces persistent failures (tests failing across multiple runs) and emerging failures (tests that started failing recently and are getting worse). This tells you where to look first.
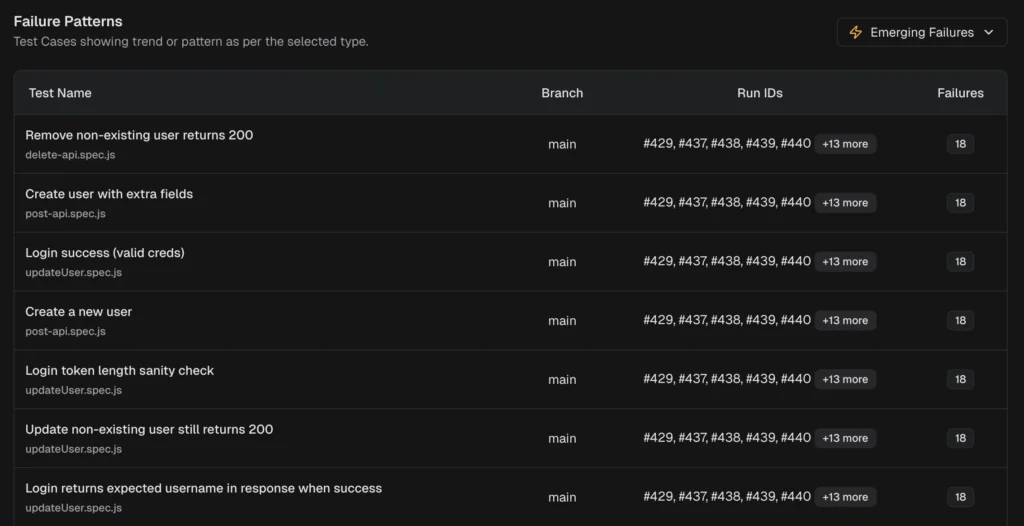
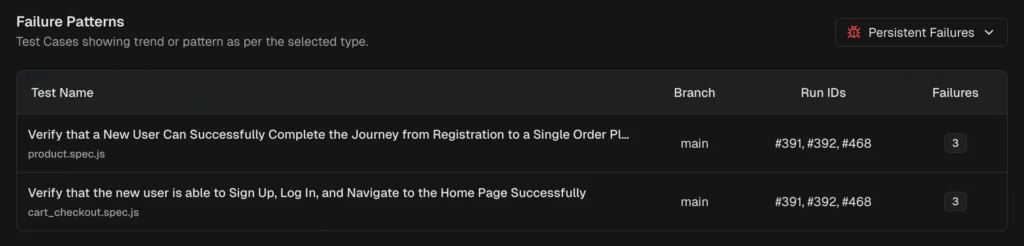
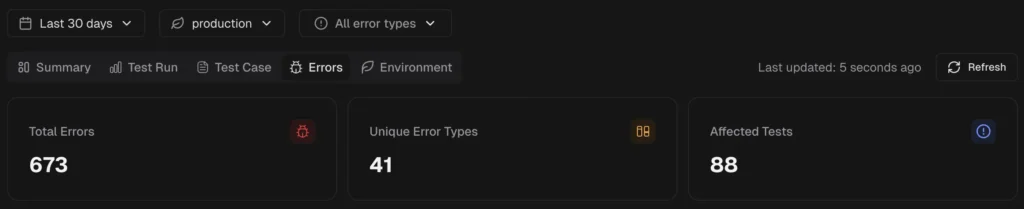
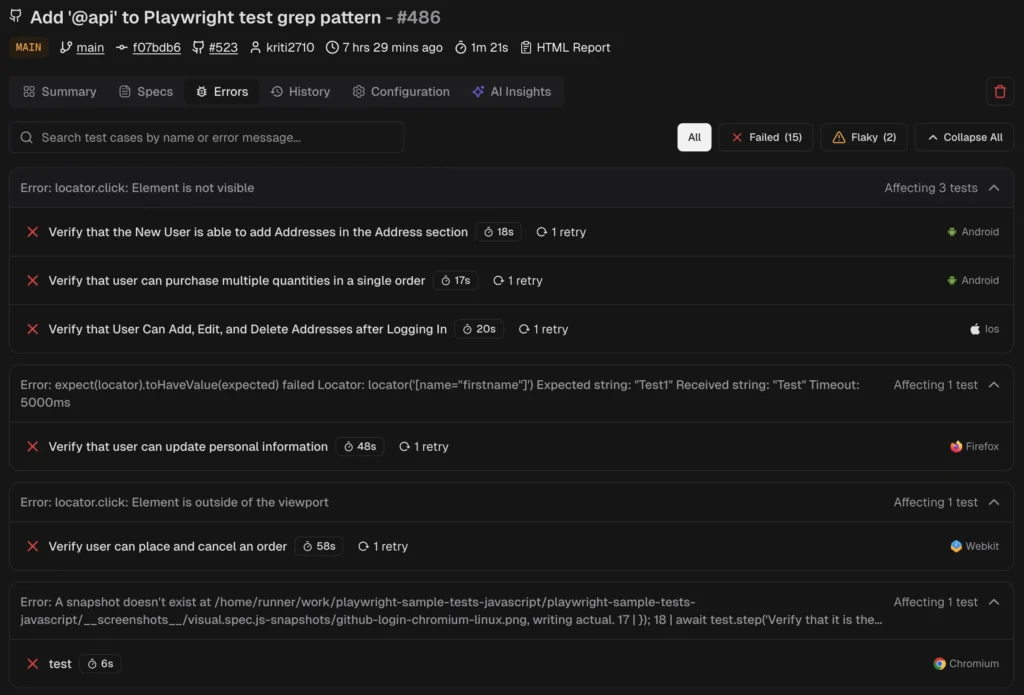
TestDino's AI insights classify failures and group similar errors, so you fix root causes instead of chasing individual test names.
Tip: The real value isn't accuracy on one test. It's the aggregate effect. When 80% of failures are pre-categorized, your team only manually triages the ambiguous 20%. That's a 4x reduction in triage effort.
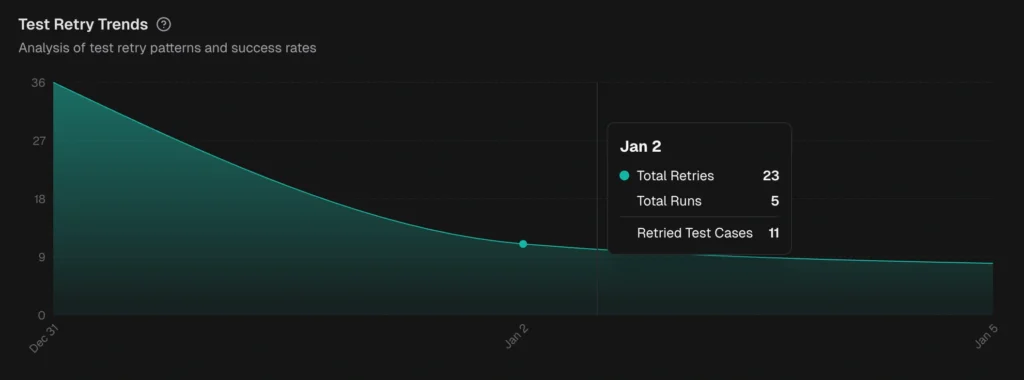
3. Flaky test detection and tracking
A flaky test produces different results across runs without any code changes. It passes on one execution and fails on the next.
Detecting flaky tests requires analyzing pass/fail patterns across many runs. A single run can't tell you whether a failure is flaky or legitimate.
A good flaky detection system works at two levels:
-
Within a single run: A test that fails initially but passes on retry is marked flaky immediately. This requires Playwright retries to be enabled.
-
Across multiple runs: Tests with inconsistent outcomes on the same code are flagged over time. The platform calculates a stability percentage for every test.
What you get:
-
Stability scores for every test (e.g., "this test passes 87% of the time")
-
Flaky categories by root cause: timing-related, environment-dependent, network-dependent, or assertion-intermittent
-
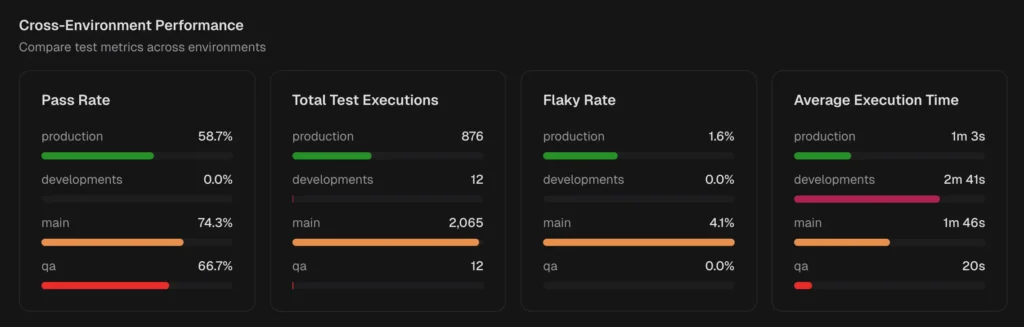
Cross-environment comparison showing whether a test is flaky everywhere or only on specific CI runners
-
Flakiness trends so you can see if it's getting worse or improving
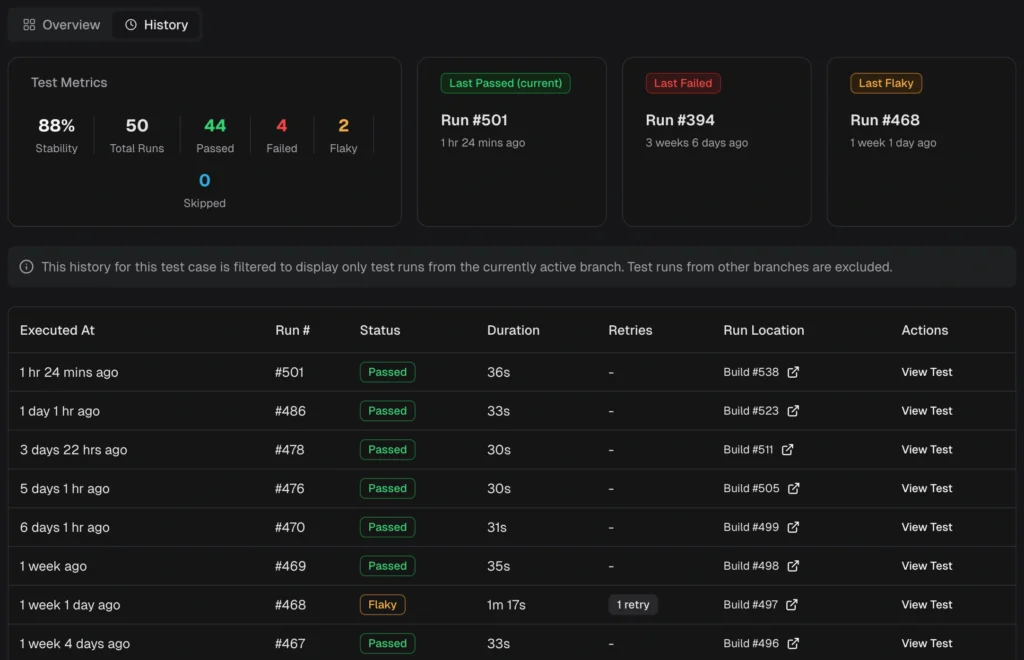
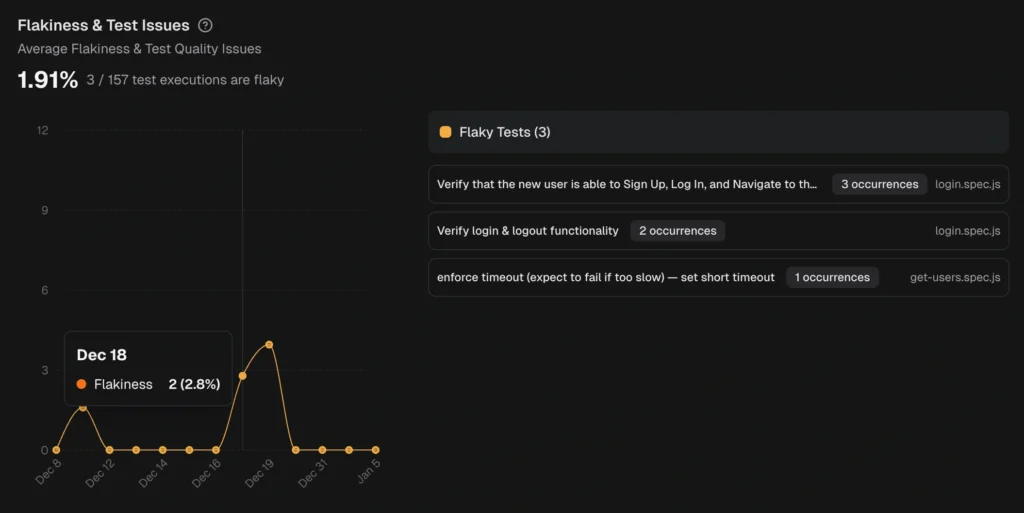
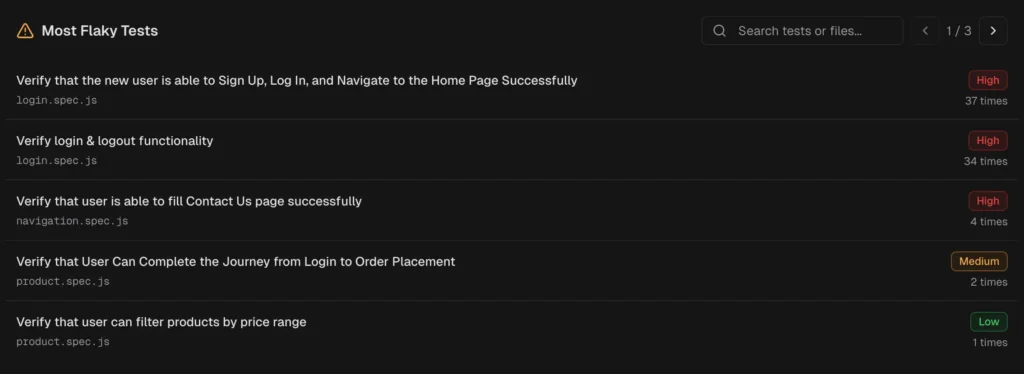
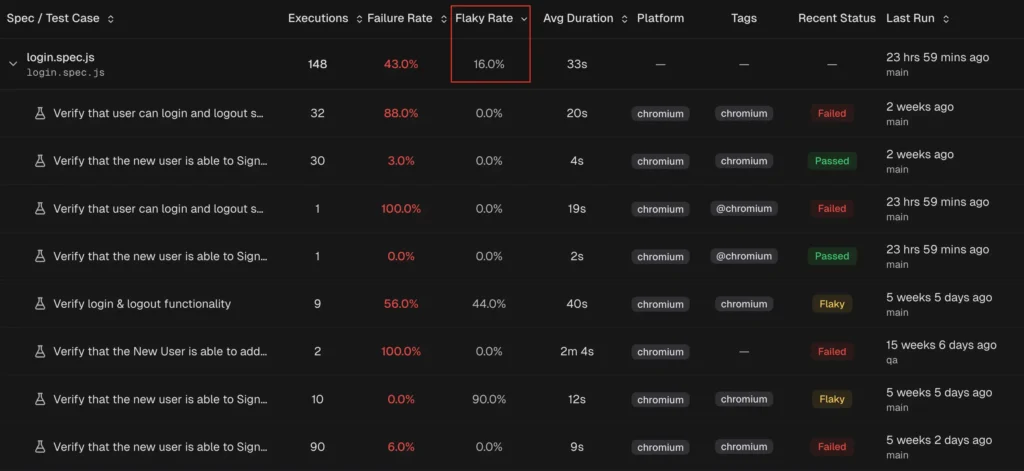
TestDino automatically detect flaky tests using both within-run and cross-run analysis and surfaces them in the QA dashboard, test explorer, and analytics.
4. CI optimization and selective reruns
This is where observability directly cuts your CI bill.
A full test suite might take 20 minutes. But if only 3 tests failed in the last run, why rerun all 500? Selective reruns execute only the tests that failed, using cached results for everything that passed.
How it works:
-
Cross-runner caching stores results that persist across different CI runners, not just the local machine
-
Shard awareness works with parallelized test execution, so cached results aren't invalidated when your sharding configuration changes
-
Branch and commit tracking tie cached results to specific code changes, so a cache from main doesn't pollute a feature branch
The result? CI pipelines that ran for 20 minutes now finish in 8 minutes. That's a 40-60% reduction in pipeline time and a proportional reduction in CI compute costs.
Smart orchestration takes this further. Instead of splitting tests evenly across shards (which creates imbalance when some tests run 10x longer than others), smart orchestration analyzes historical duration data and distributes tests so every shard finishes at roughly the same time. No more waiting for one slow shard while three others sit idle.
TestDino's CI optimization supports rerunning only failed tests with cross-runner caching and shard-aware persistence.
Tip: Combine selective reruns with GitHub status checks to create a fast feedback loop: first run catches failures, selective rerun confirms them, and status checks block the merge only on confirmed failures.
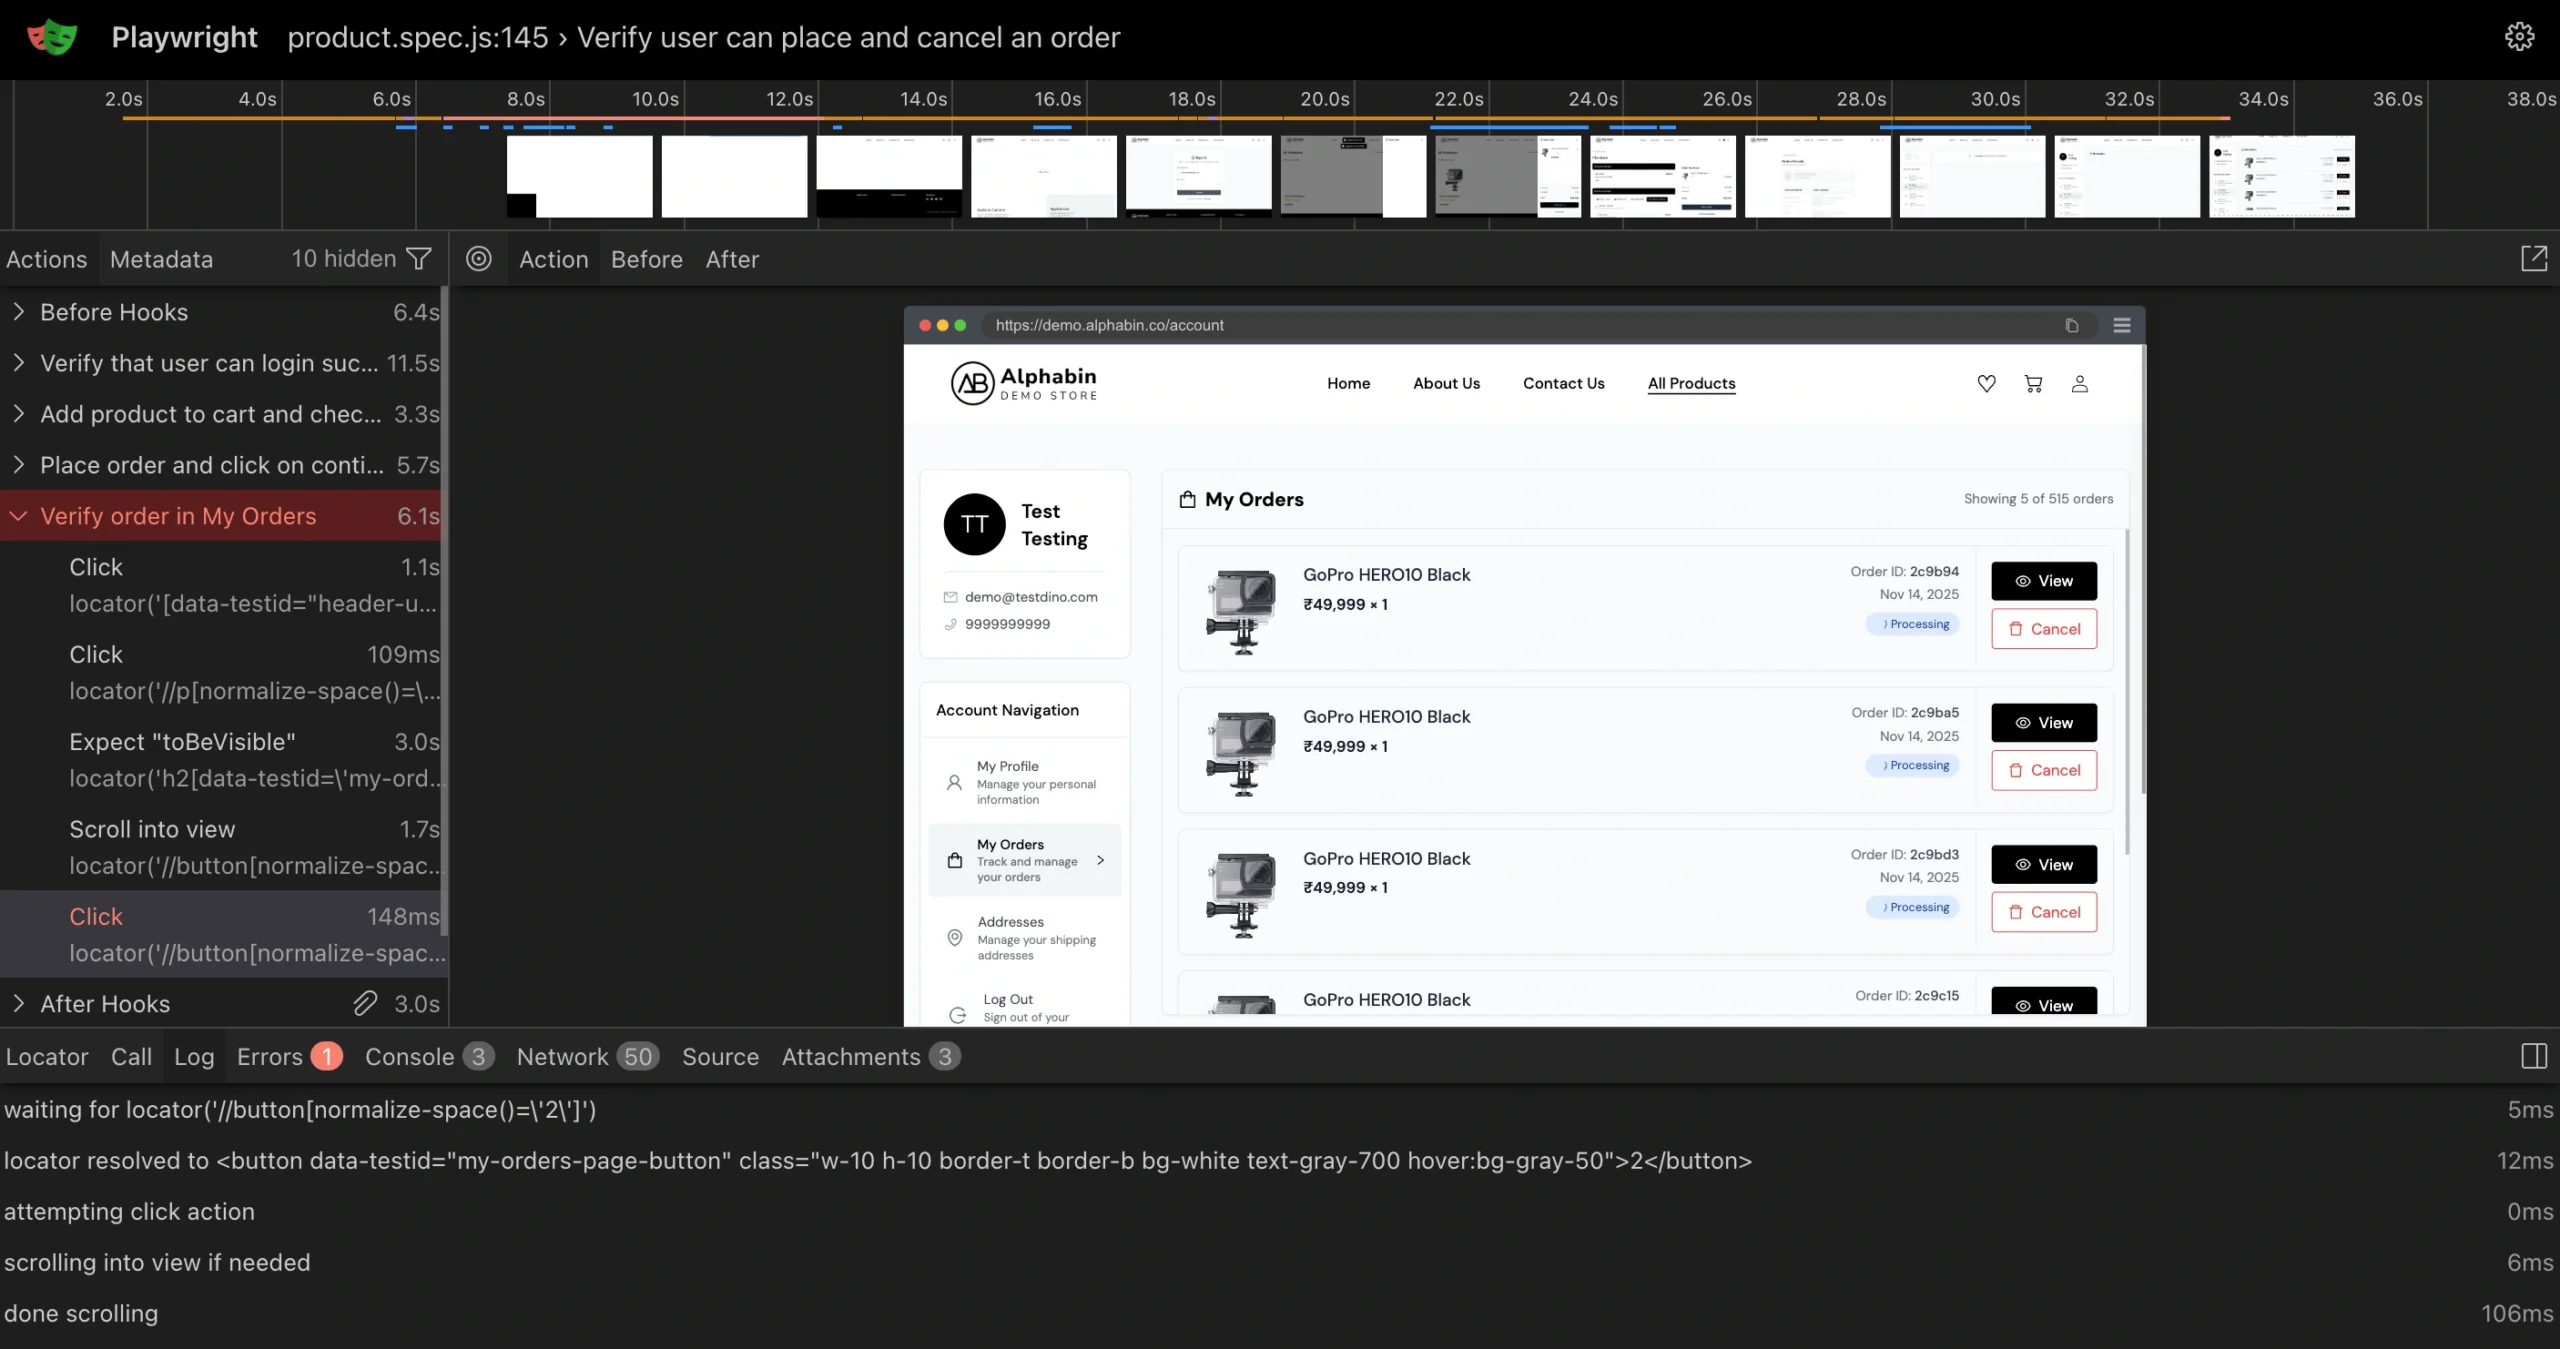
5. Centralized debugging (traces, screenshots, and evidence)
Playwright trace files are the most powerful debugging tool available. They capture DOM snapshots, network requests, console logs, and screenshots for every action.
But in a standard CI setup, accessing them means:
-
Open the CI job log
-
Navigate to artifacts
-
Download the trace zip
-
Unzip locally
-
Run npx playwright show-trace
For sharded runs, multiply that by the number of shards. That's 5-10 minutes of setup before you even start investigating.
An observability platform puts all evidence in one panel:
| Evidence type | What it shows | When it helps |
|---|---|---|
| Traces | Step-by-step timeline with DOM snapshots | Understanding what happened and when |
| Screenshots | Visual state at failure point | Catching UI regressions instantly |
| Videos | Full recording of the test execution | Seeing timing issues and animations |
| Console logs | Browser console output during the test | Finding JavaScript errors and warnings |
| Visual diffs | Before/after comparison of UI changes | Visual testing regression detection |
Click on a failing test. See everything. No downloads. No local commands.
TestDino's debug failures panel renders traces in the browser alongside visual evidence and AI analysis, all in one view.
6. MCP server for AI coding tools
What is MCP?
MCP (Model Context Protocol) is an open standard that lets AI coding assistants connect to external tools and pull real data into the conversation.
This is where observability meets the 2026 developer workflow.
When a test fails, you typically leave your IDE, open the CI dashboard, find the failing run, read the logs, and then go back to your editor to fix the code.
An MCP server lets AI assistants like Cursor, Claude Code, or VS Code Copilot pull test data directly into your editor. You stay in your IDE the entire time.
What AI agents can do with MCP access:
-
Pull the latest test run results and identify what failed
-
Read trace data and error messages for a specific test
-
Suggest code fixes based on the actual failure context
-
Query test case history to check if this test has been flaky before
TestDino's MCP server connects to Cursor, Claude Desktop, and other MCP-compatible tools. Setup takes one command: npx -y testdino-mcp. See the tools reference for the full list of available queries.
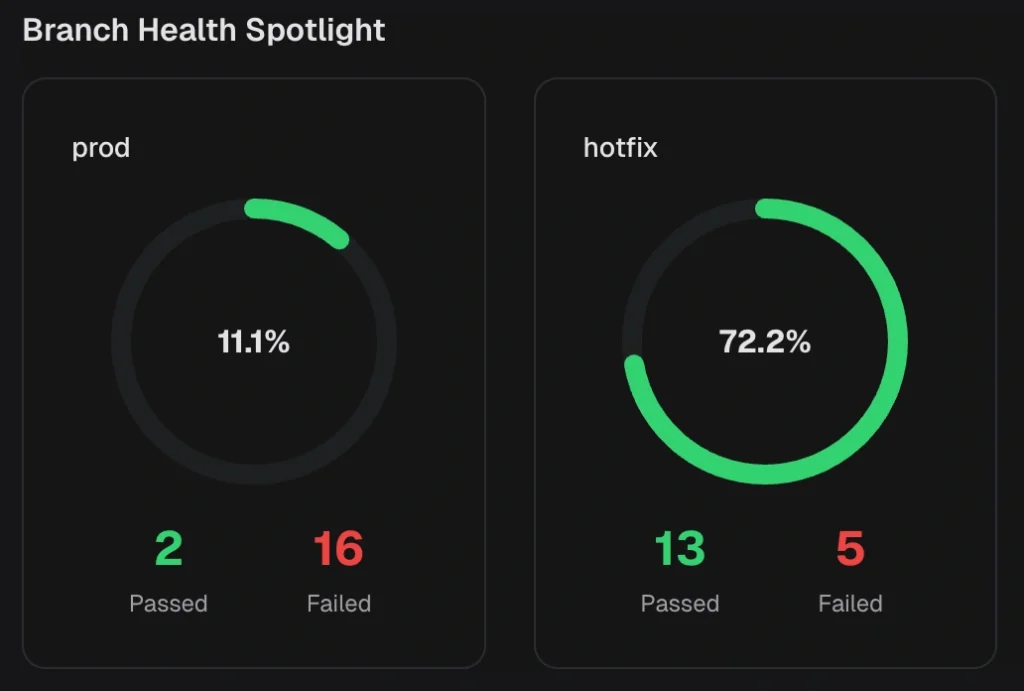
7. Dashboards, analytics, and automated reports
Different roles need different views of the same data.
| Role | What they need | Where they find it |
|---|---|---|
| Developer | My failing tests, traces, error details, PR impact | Developer Dashboard |
| QA lead | Suite health, flakiness rates, slowest tests, environment comparisons | QA dashboard |
| Engineering manager | Quality trends over time, release readiness, team velocity impact | Analytics summary |
Built-in Playwright reporters produce a single HTML file that shows the same view to everyone. An observability platform provides role-based views and analytics that track duration trends, failure rates, and coverage across runs.
For stakeholders who don't check dashboards, automated reports send scheduled PDF summaries (daily, weekly, or monthly) directly to their inbox or Slack channel. No login required.
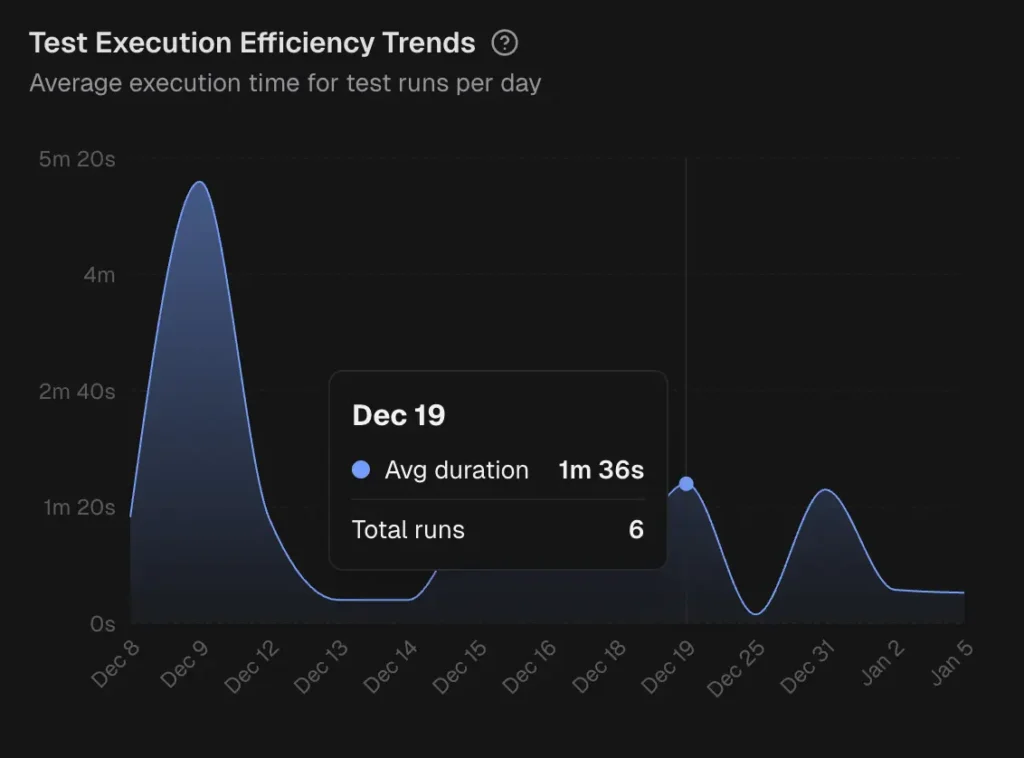
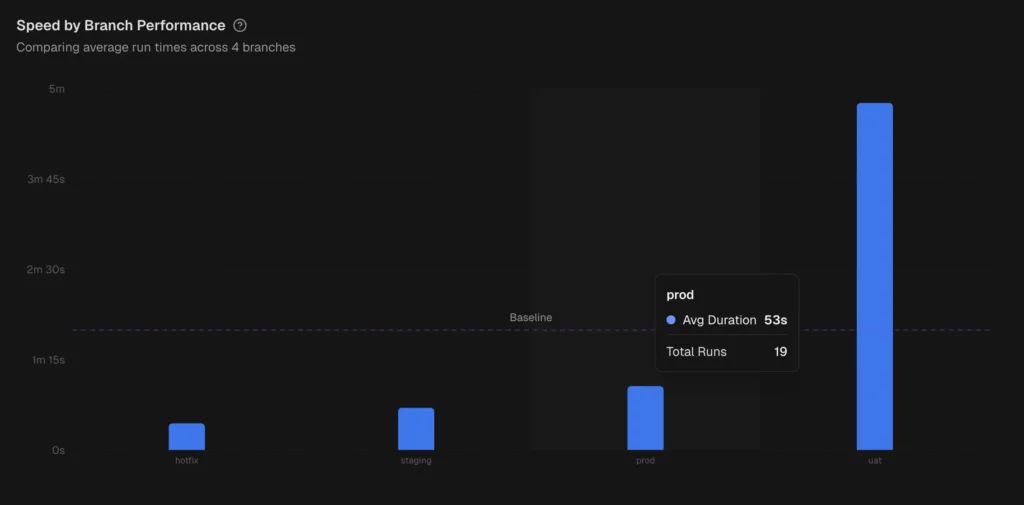
TestDino provides role-based dashboards , cross-run analytics, and automated reports on a configurable schedule.
8. Test management
As test suites grow beyond a few hundred tests, knowing what exists and who owns what becomes a problem in itself.
Test management in an observability platform means:
-
Organize tests into suites with logical grouping (by feature, team, or priority)
-
Link manual test cases to automated runs so you see which manual tests have automation coverage and which don't
-
Track ownership so when a test breaks, the right person gets notified
-
Bulk operations for managing large test inventories (tag, move, archive)
This is different from standalone test management tools like Xray or Zephyr. Those tools focus on manual test plans and regulatory traceability. An observability platform's test management is lighter weight, focused on connecting the test organization to real CI run data.
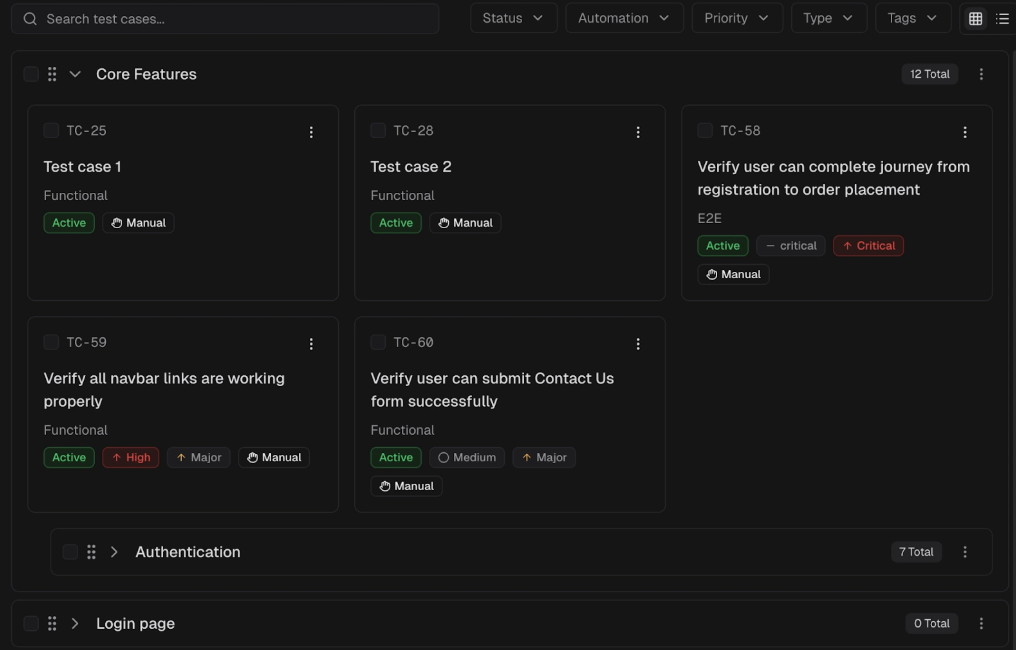
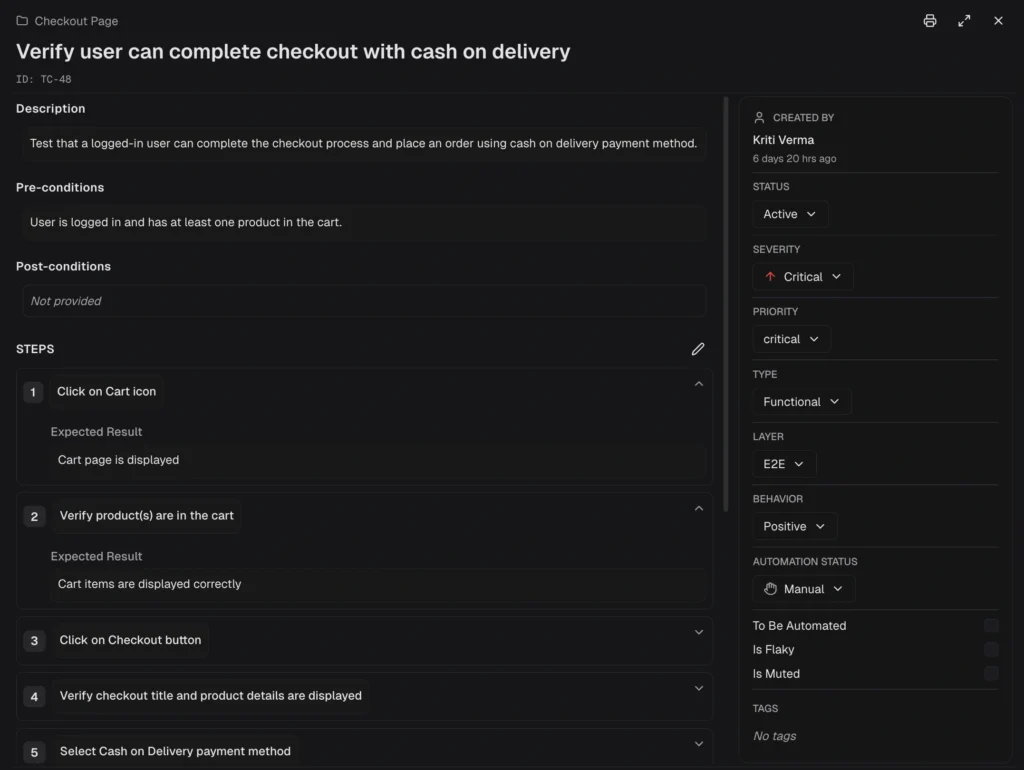
TestDino's test management lets you organize test cases, group them into suites, and manage them at scale with bulk operations.
How to set up Playwright observability (without changing your tests)
The best observability platforms integrate at the reporter level. You don't change how you write tests. You add a reporter that streams results to the platform.
Here's what a typical TestDino setup looks like. There are two methods: a CLI wrapper (fastest setup) or a Playwright reporter in your config (works with existing scripts).
Method 1: CLI wrapper (recommended)
This wraps npx playwright test and automatically streams results.
Step 1: Install
npm install @testdino/playwrightStep 2: Set your API token
export TESTDINO_TOKEN="your-api-token"You get this token during onboarding or from project settings. Store it in your CI provider's secret store for pipeline runs.
Step 3: Run your tests
npx tdpw testThat's it. The tdpw test command wraps npx playwright test, and streams results to TestDino in real time. All Playwright CLI options pass through:
npx tdpw test --headed --project=chromium --workers=4
npx tdpw test --shard=1/4
npx tdpw test --grep="login" --retries=2
Method 2: Playwright reporter (config-based)
If you prefer to keep using npx playwright test directly, add TestDino as a reporter in your config:
// playwright.config.ts
import { defineConfig } from '@playwright/test';
export default defineConfig({
  reporter: [
    ['@testdino/playwright', { token: process.env.TESTDINO_TOKEN }],
    ['html'],  // keep your existing reporters
  ],
  use: {
    trace: 'on-first-retry',
    screenshot: 'only-on-failure',
    video: 'retain-on-failure',
  },
});
Then run tests as normal:
npx playwright testTestDino works alongside HTML, JUnit, or any other Playwright reporter. Your existing reporters keep working. Nothing changes about how you write or run tests.
Note: Both methods stream results in real time as each test completes. The reporter captures test results, traces, screenshots, and videos as they're generated. If you remove it, everything goes back to exactly how it was before. See the Node.js CLI reference for the full list of options.
Tip: When running sharded tests across multiple CI machines, pass --ci-run-id to group all shards into a single run on the dashboard:
npx tdpw test --shard=1/4 --ci-run-id=${{ github.run_id }}
Prerequisites: Node.js >= 18.0.0, @playwright/test >= 1.52.0, and a Git initialized repository. See the full getting started guide for step-by-step setup with your CI provider (GitHub Actions, GitLab CI, Azure DevOps).
What observability unlocks for your team
Once you have historical, centralized test data, new workflows become possible.
PR quality gates
Instead of "all tests pass," you can check:
-
No new flaky tests introduced in this PR
-
Test suite pass rate stays above 95%
-
No test duration regression beyond 20%
TestDino's GitHub status checks and PR insights surface this data directly in your pull request, including a summary of what changed and a timeline of test behavior for files changed in the PR.
Root cause analysis
When a test fails, an observability platform can show:
-
Is this the first time it failed, or the 10th?
-
Does it fail in all browsers or only in WebKit?
-
Does it fail on all CI runners or just the slow one?
-
Did it start failing after a specific commit?
This kind of root cause analysis is impossible without cross-run historical data.
CI cost optimization
Test observability reveals waste:
-
Tests that run for 30 seconds but could be parallelized to 5 seconds
-
Flaky tests that trigger 3 retries every run, tripling CI costs
-
Slow tests that would benefit from sharding across more machines
TestDino's CI optimization tools include features such as rerunning only failed tests, which significantly reduce CI time for large suites.
When you need an observability platform (and when you don't)
Not every team needs this. Here's an honest assessment:
You probably DON'T need a platform if:
-
Your team has fewer than 50 tests
-
You run tests locally, not in CI
-
One person owns the entire test suite
-
Tests take under 5 minutes total
At that scale, Playwright's built-in HTML reporter is enough.
You probably DO need a platform if:
-
You run 100+ tests in CI regularly
-
Multiple developers contribute to and debug the test suite
-
You're spending more than 30 minutes per day on test failure investigation
-
You have flaky tests, but don't know which ones or how many
-
Your CI artifacts expire before you finish debugging
-
You use sharding and need unified results across shards
Tip: A useful litmus test: if your team has a Slack channel where someone regularly posts "Is this test flaky or real?", you need an observability platform. Data, not memory, should answer that question.
Best practices for Playwright observability
Configure traces correctly
Capture traces on first retry, not on every run. This keeps CI fast while ensuring you have debugging data when tests fail.
// playwright.config.ts
export default defineConfig({
  use: {
    trace: 'on-first-retry',    // captures trace only when a test fails and retries
    screenshot: 'only-on-failure',
    video: 'retain-on-failure',
  },
  retries: process.env.CI ? 2 : 0,  // retry in CI only
});
Tag tests with metadata
Use Playwright annotations to add metadata that makes filtering and analysis easier:
test('checkout flow @critical @payments', async ({ page }) => {
  // Observability platforms can filter by these tags
});
Set up automated alerts
Don't wait for someone to check the dashboard. Configure Slack alerts for:
-
New test failures on the
mainbranch -
Tests that cross a flakiness threshold
-
Suite pass rate dropping below your target
Review test health weekly
Schedule a 15-minute weekly review of your test analytics:
-
Top 5 flakiest tests (fix or quarantine)
-
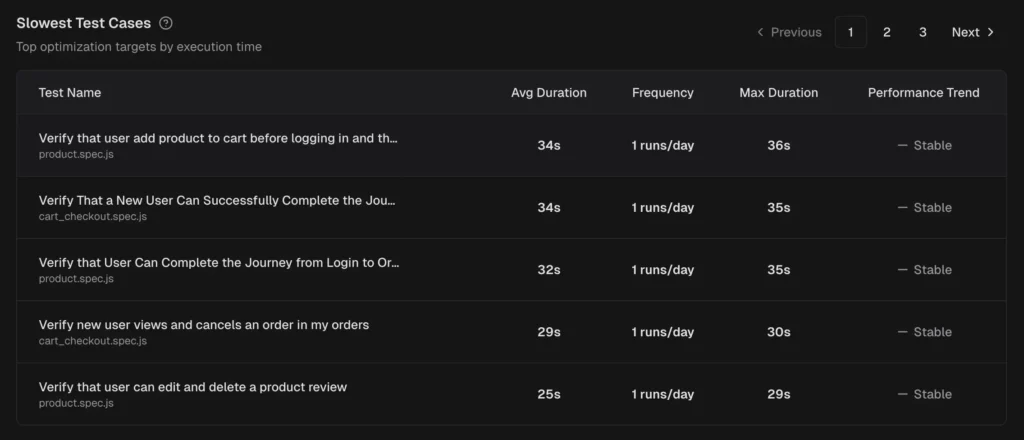
Top 5 slowest tests (optimize or split)
-
Pass rate trend (improving or declining?)
-
New failures introduced this week
This turns test quality from a reactive firefight into a proactive process. Track your test quality metrics over time using your observability dashboard, and use automated reports to share progress with stakeholders.
FAQs

Pratik Patel
Co-founder