Playwright 1.59 Release Guide
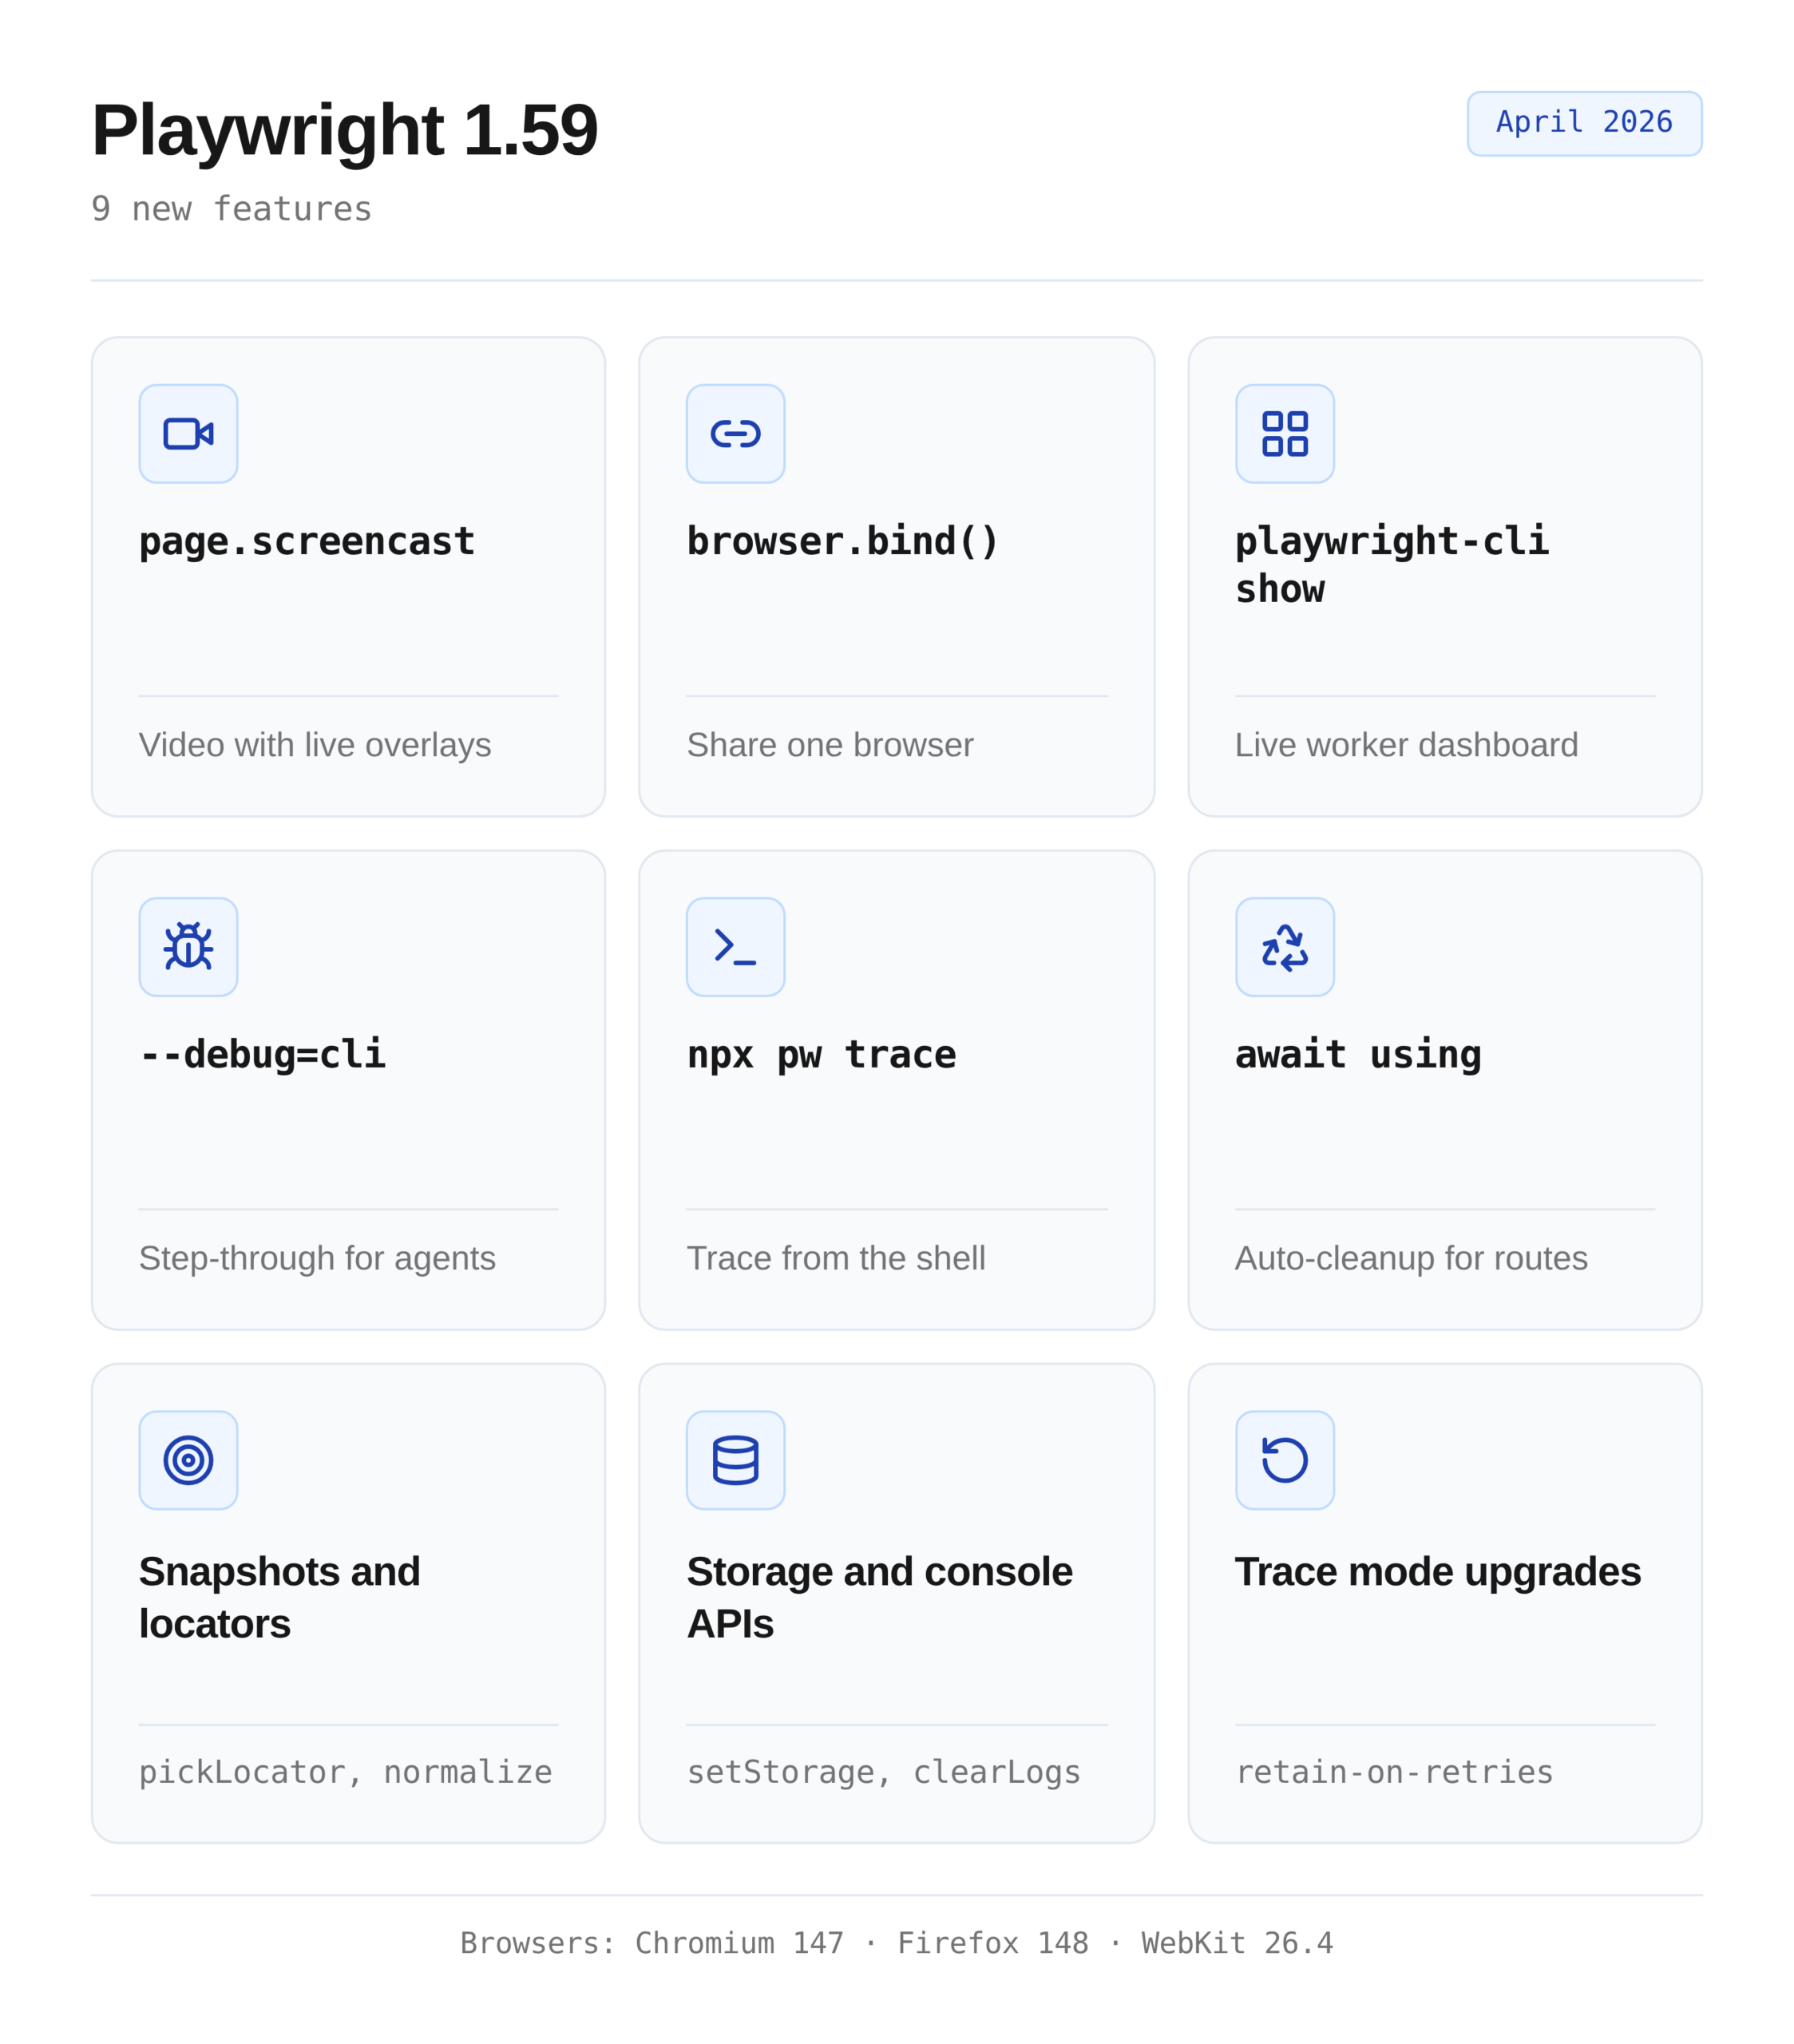
Playwright 1.59 adds page.screencast, browser.bind, a trace CLI, await using, pickLocator, and more. Check out the features with their working code samples.


Playwright 1.59 shipped on April 1, 2026. Patch 1.59.1 landed the same day.
Nine big additions.
Screencast replaces the old video recorder. browser.bind connects Playwright-CLI and MCP to a single running browser. The trace CLI turns a coding agent into a test debugger without opening any UI.
This guide walks through every 1.59 feature with code you can copy into a real Playwright + MCP project, plus one worked end-to-end demo where an agent fixes a failing test on its own.
Upgrading from Playwright 1.58 to 1.59
The one-line upgrade
npm install -D @playwright/[email protected]
npx playwright install
Use 1.59.1, not 1.59.0. More on that below.
Install 1.59.1, not 1.59.0
Playwright 1.59.0 shipped with a Windows regression that broke codegen, --ui, and show commands. The fix landed the same day as v1.59.1. If you pinned to 1.59.0, you will hit broken console handling on Windows runners.
Always pin the patch version on the first install after a release. Skip a day, then move to the ^1.59 caret range once the community has run it through CI.
Breaking changes
Two to handle before you upgrade:
- macOS 14 WebKit support is gone. If your team runs WebKit tests on macOS 14, upgrade to macOS 15 or pin to Playwright 1.58.
- @playwright/experimental-ct-svelte has been removed. Svelte component tests need to migrate to the main @playwright/test runner or stay on 1.58.
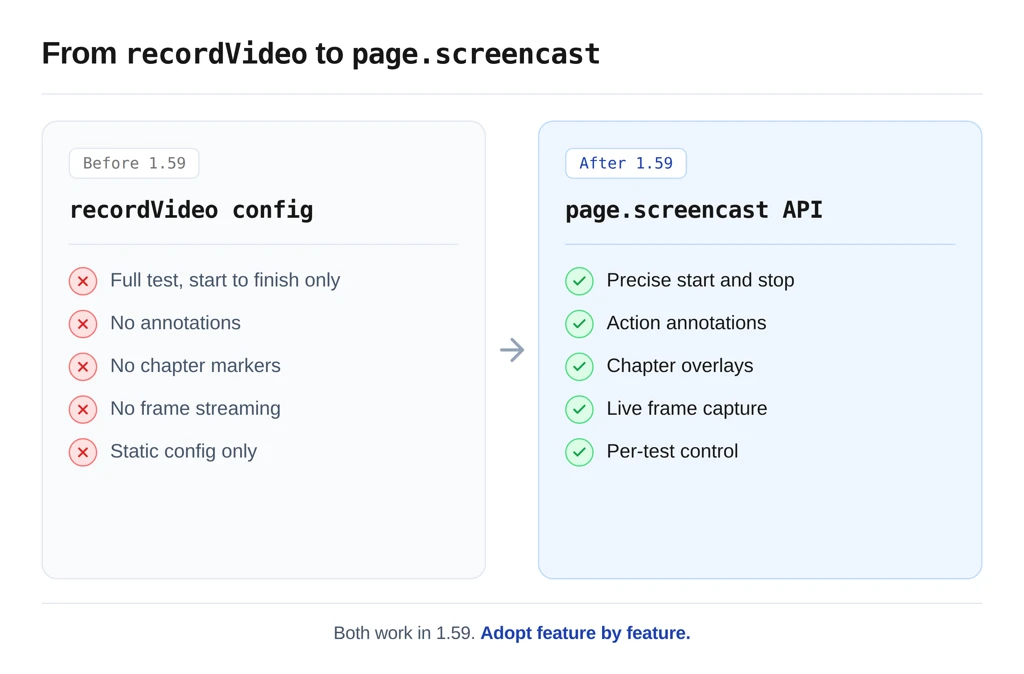
Every other 1.58 script still runs. The old recordVideo option keeps working, so you can adopt page.screencast feature by feature.
The new screencast API
The page.screencast API is the first big addition in 1.59. It replaces the old recordVideo option with a single surface that handles video recording, live frame streaming, and on-page overlays.
Before 1.59: recordVideo
// playwright.config.ts (Playwright 1.58 and earlier)
export default defineConfig({
  use: {
    video: 'on',
  },
});
You got a .webm file, with no annotations, no chapter markers, and no way to stream frames.
After 1.59: page.screencast
import { test } from '@playwright/test';
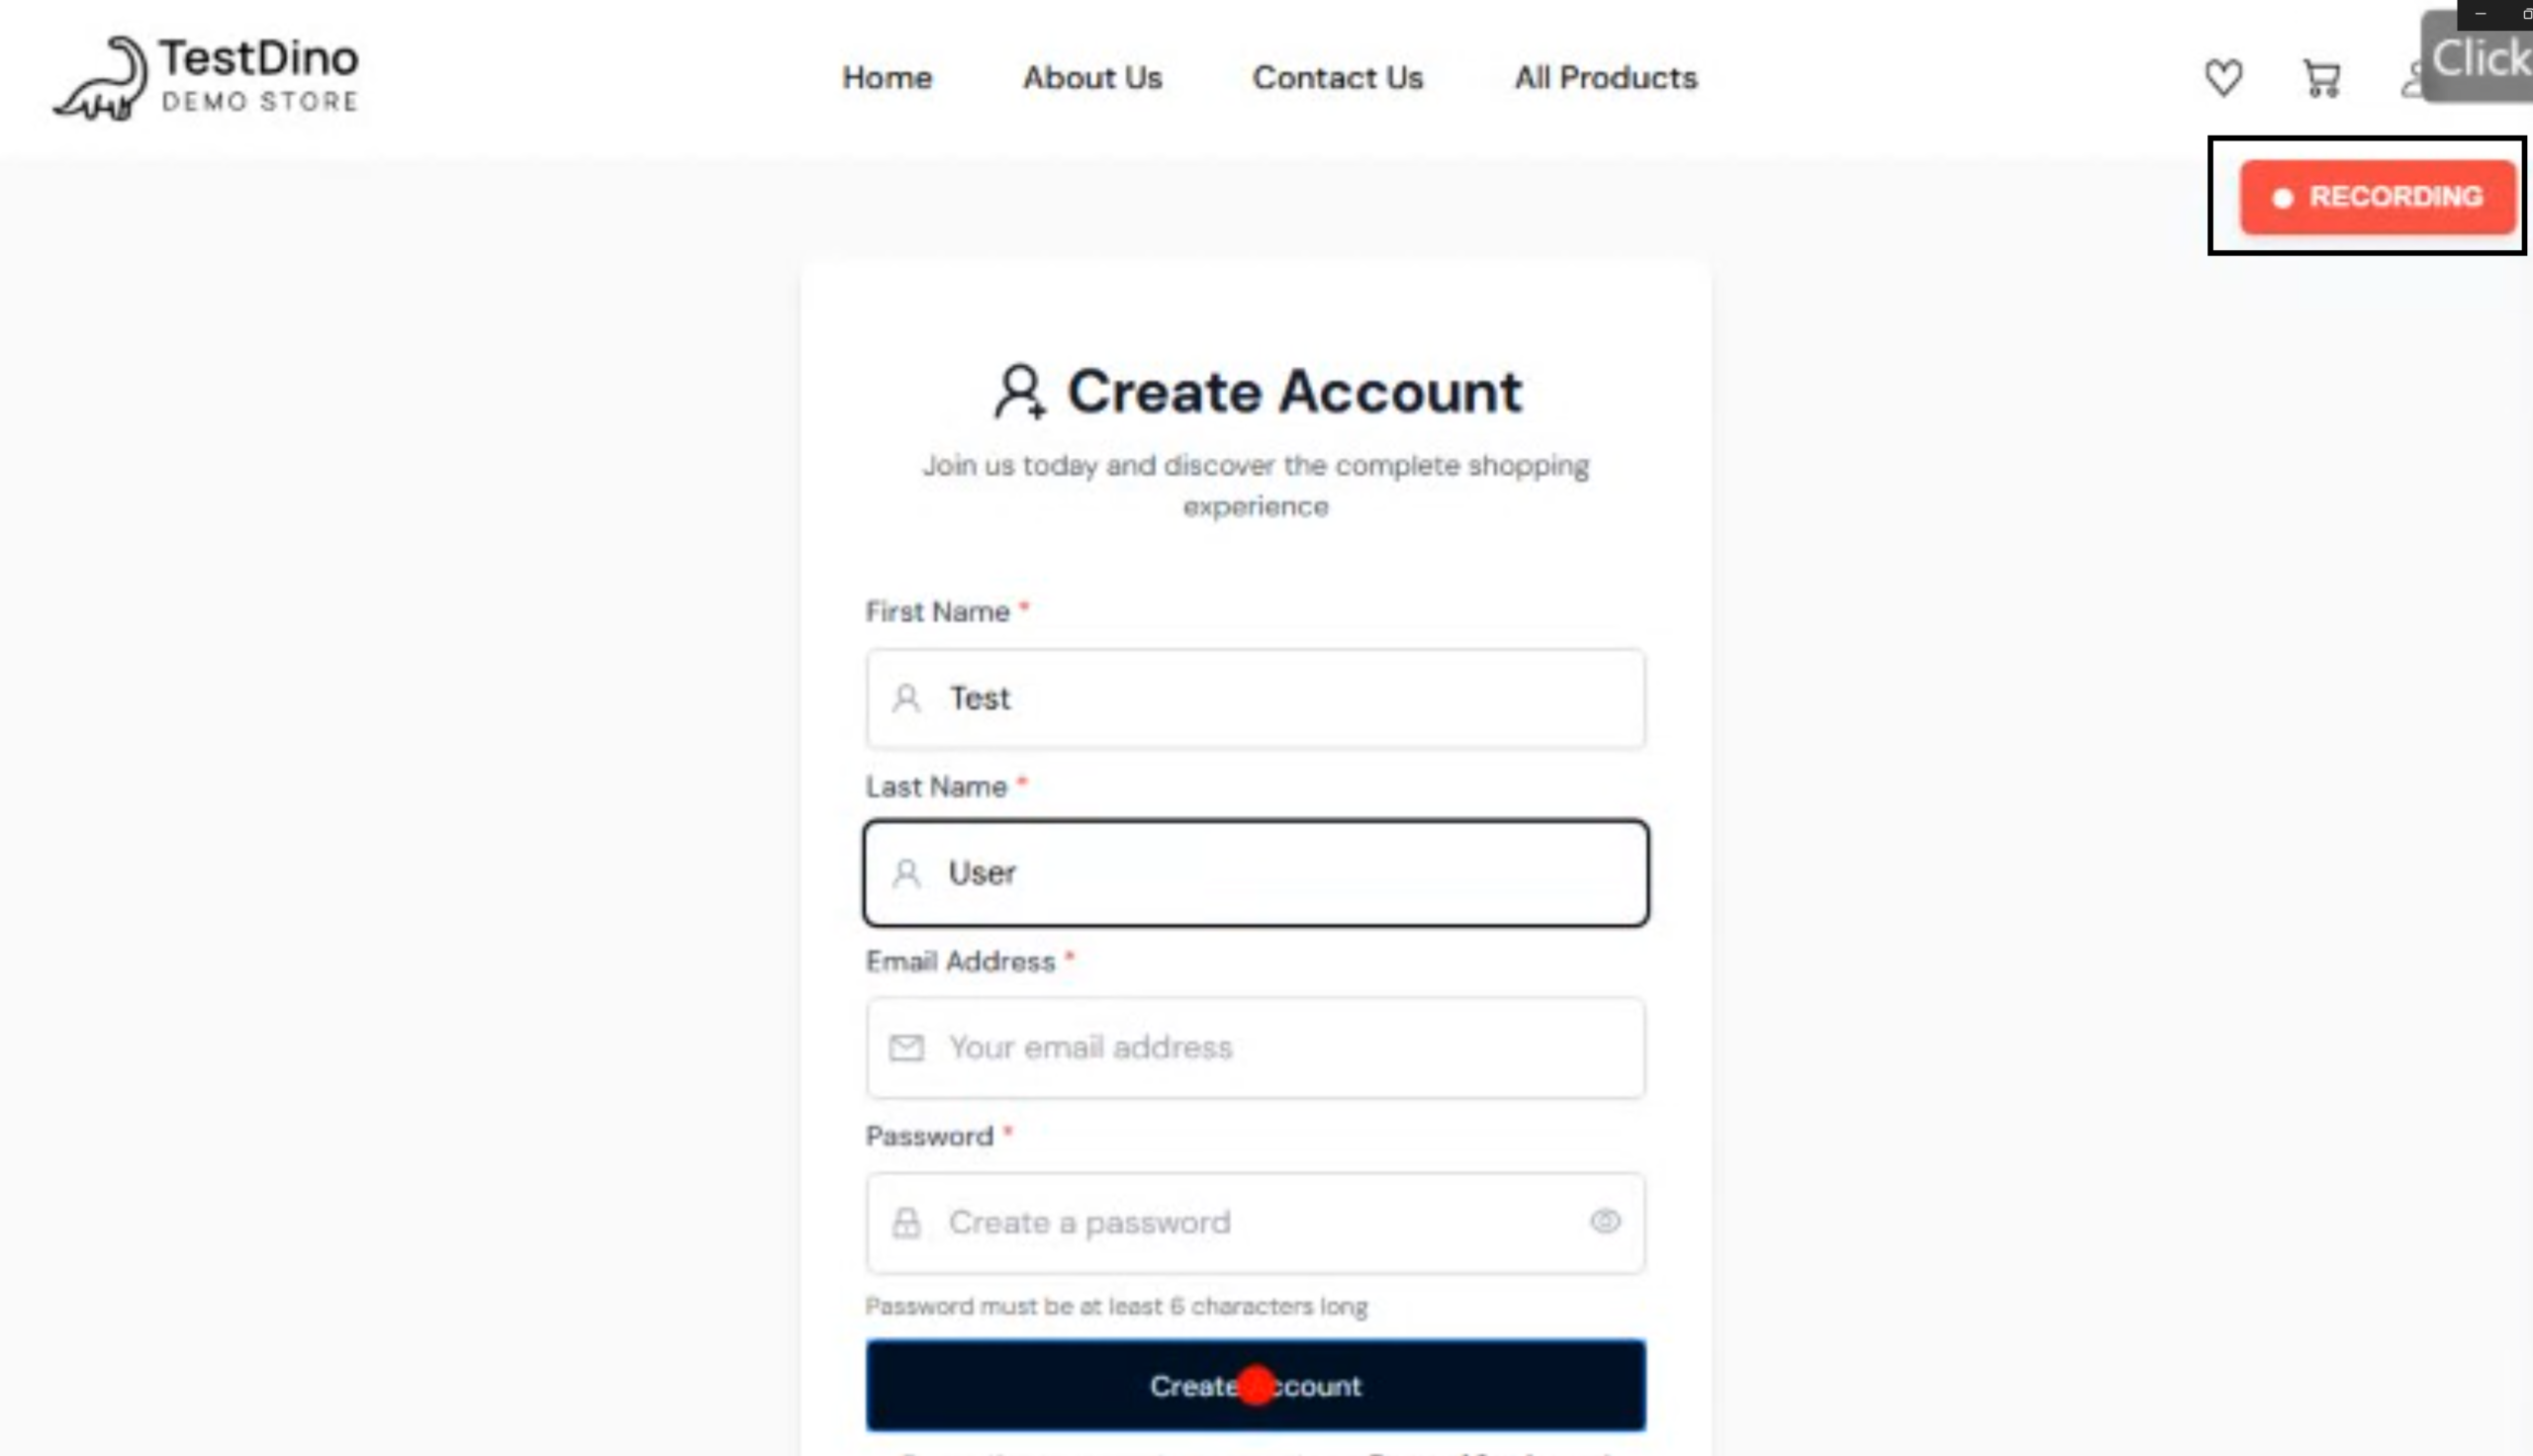
test('signup flow with video', async ({ page }) => {
await page.screencast.start({ path: 'signup.webm' });
await page.goto('https://storedemo.testdino.com/signup');
await page.getByPlaceholder('First Name').fill('Test');
await page.getByPlaceholder('Last Name').fill('User');
await page.screencast.stop();
});
Precise start and stop, just for the section of the test you care about. Skip the boring login and fixture setup, record only the interesting part.
Annotate every action
await page.screencast.start({ path: 'signup.webm' });
await page.screencast.showActions({ position: 'top-right' });
await page.getByPlaceholder('First Name').click();
await page.getByPlaceholder('First Name').fill('Test');
// A labeled annotation appears in the top-right corner
// showing "fill" and the target input field.
showActions() accepts position (6 values), duration in milliseconds, and fontSize in pixels. Full options in the screencast API docs.
Chapter markers for narrated runs
Chapters are useful when you want a reviewer to scrub to a specific phase of the test.
await page.screencast.showChapter('Adding item to cart', {
  description: 'Product page → Add to cart → Cart drawer',
  duration: 1500,
});
The overlay blurs the background, centers the title, and dismisses after duration.
Configure it at the framework level
For the full suite, switch annotations on once in the config:
export default defineConfig({
  use: {
    video: {
      mode: 'on',
      show: {
        actions: { position: 'top-left' },
        test: { position: 'top-right' },
      },
    },
  },
});
Now every test gets the overlay treatment without touching the test files.
Screencast API also supports real-time JPEG frame streaming via the onFrame callback for custom pipelines (live monitoring, vision models, thumbnails).
browser.bind(): One browser, many clients
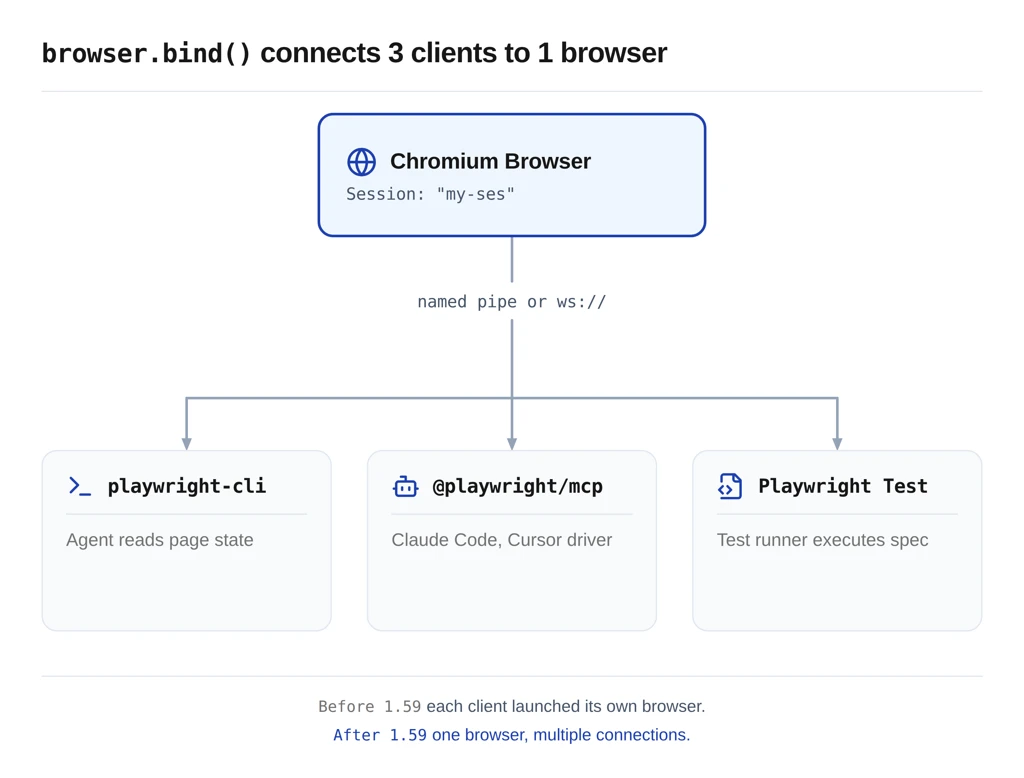
browser.bind() is the feature that quietly enables multi-client workflows. It makes a launched browser available to Playwright-CLI, @playwright/mcp, and any other Playwright client simultaneously.
The problem it solves
Before 1.59, running @playwright/mcp and a Playwright test against the same browser meant juggling two processes and two browser instances. Most teams just accepted the extra window.
Now you launch once, bind, and everyone talks to the same browser. If you haven't used playwright-cli yet, it's the token-efficient CLI mode that ships alongside MCP.
Bind a browser
import { chromium } from '@playwright/test';
const browser = await chromium.launch();
const { endpoint } = await browser.bind('my-session', {
  workspaceDir: '/my/project',
});
console.log('Endpoint:', endpoint);
// Keep the process alive so other clients can connect
workspaceDir scopes the session to a project folder. The session name, my-session here, is how every other client finds it.
Connect from playwright-cli
playwright-cli attach my-session
playwright-cli -s my-session snapshot
The CLI attaches to the live browser. A coding agent can use these commands to read page state without opening a window.
Connect from @playwright/mcp
Point the MCP server at the same session:
@playwright/mcp --endpoint=my-session
MCP now drives the same browser the as test runner. Your Claude Code or Cursor session sees everything the test sees. Compare this to the older MCP config from the uploaded pw-agent repo:
{
  "mcpServers": {
    "playwright-test": {
      "command": "npx",
      "args": ["playwright", "run-test-mcp-server"]
    }
  }
}
In 1.59, the MCP server can attach to a pre-bound browser rather than spinning up a fresh one every session.
Connect a Playwright client
Multiple Playwright clients against one browser, at the same time, using the connect API:
const browser = await chromium.connect(endpoint);
const context = await browser.newContext();
const page = await context.newPage();
WebSocket or named pipe
Default is a named pipe on the local machine. Pass host and port to get a WebSocket endpoint instead:
const { endpoint } = await browser.bind('my-session', {
  host: 'localhost',
  port: 0, // let the OS pick
});
// endpoint is a ws:// URL you can share over the network
Call browser.unbind() to stop accepting new connections. Existing ones keep working.
The playwright-cli dashboard
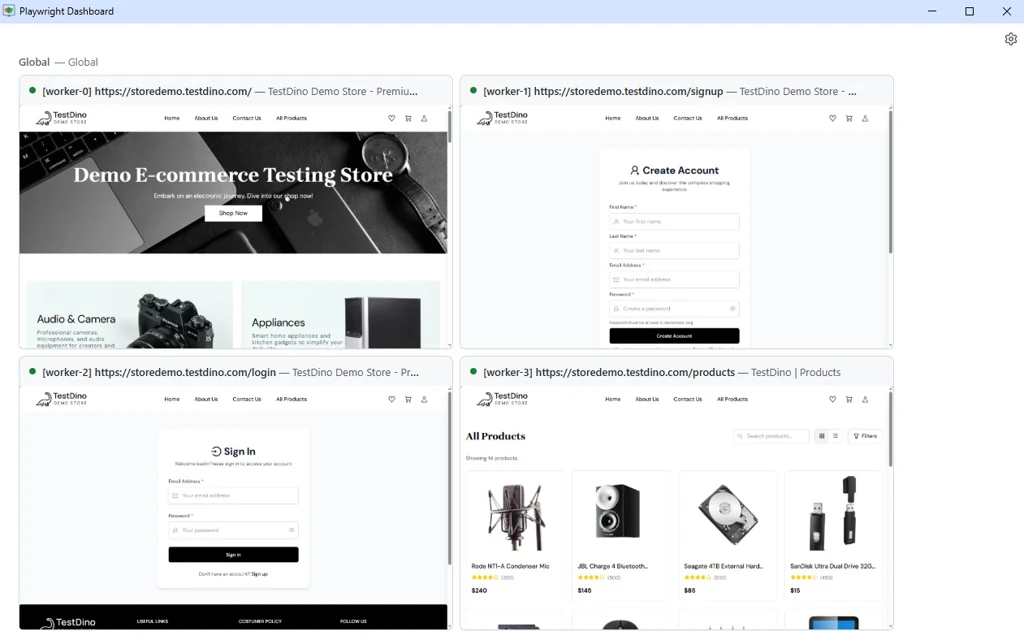
playwright-cli show opens a live dashboard that lists every bound browser and every active test worker in one view.
See every parallel worker on one surface
The honest win here is juggling. If your suite runs 6 workers in parallel, you used to have 6-headed browser windows fighting for screen space. The dashboard replaces all of them with a single UI that shows live page content from each worker.
# Start the dashboard
playwright-cli show
In a second terminal:
# Run tests and pipe them into the dashboard
PLAYWRIGHT_DASHBOARD=1 npx playwright test
Every @playwright/test worker now shows up in the dashboard. Click into a session to see the live page, open DevTools, or intervene manually.
Why this is worth adopting
Three wins that replace older hacks:
-
Live monitoring of a parallel suite without headed mode on every worker
-
Manual intervention on a stuck test without killing the run
-
DevTools access to any worker's browser while the suite is running
This is the fastest 1.59 feature to adopt. No code changes, one env variable, one CLI command.
--debug=cli: The step-through debugger
Coding agents now get a first-class debugger. Run:
npx playwright test --debug=cli
The test pauses. The agent attaches via playwright-cli and steps through the test one action at a time.
When to use step-through debugging
Use --debug=cli when the failure is logic-dense or state-dependent. Race conditions, flaky timing bugs, state-leak between tests. The kind of failure where the trace alone does not tell the whole story, and you need to watch the intermediate state. For the wider picture of debugging Playwright tests, trace-first and CLI-debugger-second is the pattern most teams settle on.
For pure selector or assertion failures, skip this and jump straight to npx playwright trace in the next section. That path is faster.
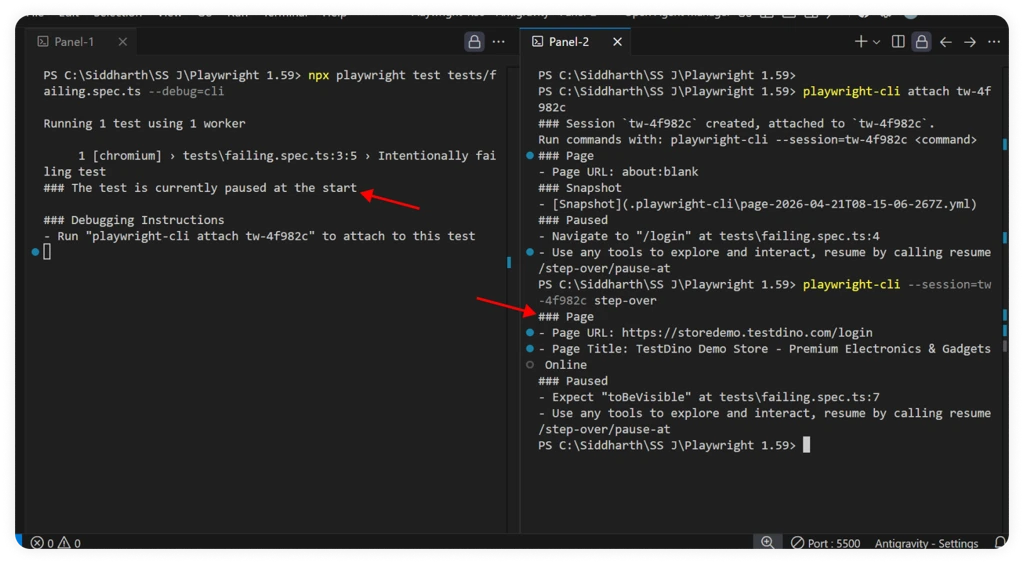
The debugger flow
$ npx playwright test --debug=cli
### Debugging Instructions
- Run "playwright-cli attach tw-87b59e" to attach to this test
$ playwright-cli attach tw-87b59e
### Session `tw-87b59e` created, attached to `tw-87b59e`.
Run commands with: playwright-cli --session=tw-87b59e <command>
### Paused
- Navigate to "/" at tests/example.spec.ts:4
$ playwright-cli --session tw-87b59e step-over
### Page
- Page URL: https://playwright.dev/
- Page Title: Fast and reliable end-to-end testing for modern web apps | Playwright
### Paused
- Expect "toHaveTitle" at tests/example.spec.ts:7
Every command the agent sends receives a structured reply with the page state, the next pending action, and any errors. Agents read this like a human reads a debugger's variable panel.
npx playwright trace: The trace CLI for agents
This is the feature that changes daily work. Agents can now read a full Playwright trace from the command line, without opening any UI.
Why it matters
A Playwright trace file already contains the complete context of a test run: every action, before and after DOM snapshots, network requests, console logs, and errors. Until 1.59, an agent had to either download the trace and re-render it or rely solely on text logs. The trace is now queryable from the shell.
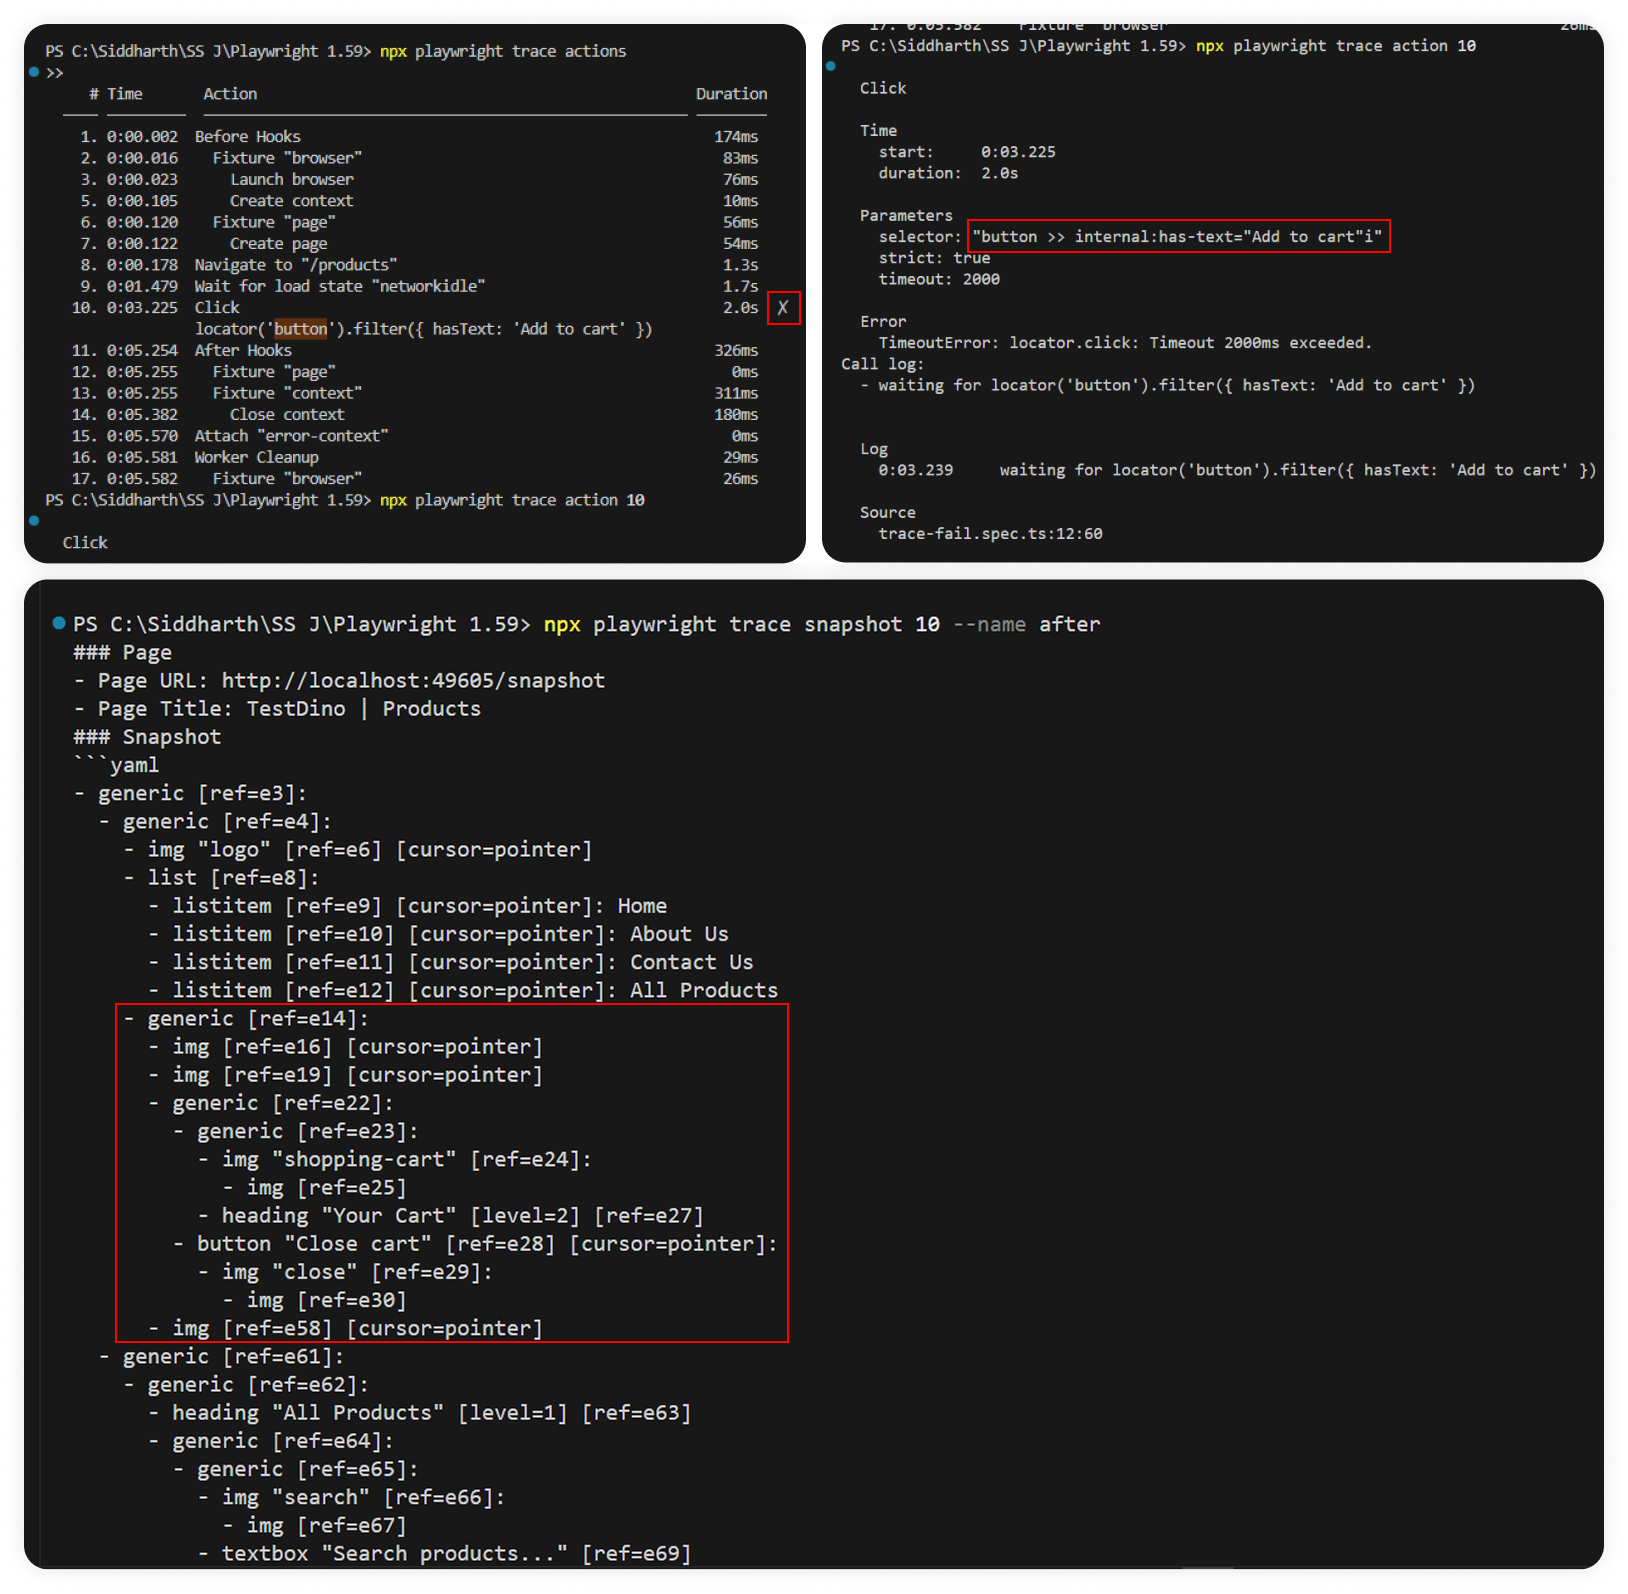
The four commands
# 1. Open a trace
npx playwright trace open test-results/checkout-chromium/trace.zip
# 2. List every action, filter with --grep
npx playwright trace actions --grep="expect"
# 3. Zoom into one action
npx playwright trace action 9
# 4. Inspect the page state before or after that action
npx playwright trace snapshot 9 --name after
# Close when done
npx playwright trace close
Each command returns structured text that an agent can parse. trace actions prints a numbered list with timings and a pass/fail marker. trace snapshot prints the page title, URL, and accessibility-tree snapshot at that moment.
The reusable agent-skill pattern
The agent-skill pattern turns the trace CLI workflow into something your coding agent can invoke by name.
Create a markdown SKILL file that tells the agent the exact sequence of commands, what to look for at each step, and where to apply the fix.
Drop the file in your agent's skills folder (.claude/skills/ for Claude Code, or the equivalent for Cursor and other agents) and call it whenever a test fails.
Here is the minimum viable skeleton. Save it as debug-playwright-trace.md:
debug-playwright-trace.md
---
name: debug-playwright-trace
description: Debug a failing Playwright test using CLI trace analysis
---
# Phase 1: Run the test with tracing
npx playwright test <test-name> --trace on --retries=0
# If the test passes, stop. If it fails, capture the trace.zip path.
# Phase 2: Open the trace and find the failing action
npx playwright trace open <trace-path>
npx playwright trace actions
# Record the action number marked with ✗.
# Phase 3: Inspect the failing action
npx playwright trace action <N>
npx playwright trace snapshot <N> --name before
npx playwright trace snapshot <N> --name after
# Phase 4: Pull supporting context only if Phase 3 is unclear
npx playwright trace network   # for 401, 500, hanging requests
npx playwright trace console   # for uncaught browser exceptions
# Phase 5: Report findings in 4 parts
# 1. Failing action, 2. Root cause, 3. Evidence, 4. Proposed fix
# Phase 6: Apply the fix, re-run. Stop after 3 failed attempts.
npx playwright trace close
That's the floor. Most teams will want to extend it in four places:
- Add a failure-pattern decision table. Map the common failures in your app (stale auth tokens, slow API calls, race conditions on specific routes) to the fix template for each. The agent picks the template that matches the trace output.
- Add project-specific grep filters. If your suite has 100+ actions per test, add filters like npx playwright trace actions --grep="checkout" so the agent narrows the search instead of scanning every step.
- Tune the retry limit. The skeleton stops the agent after 3 failed fix attempts. Tighten it if agent time is expensive, loosen it if you trust the agent to grind through edge cases.
- Define the report format. Tell the agent what fields to include in its write-up (failing test, root cause category, fix commit message). A structured report becomes ingestible by your ticketing system or CI.
The skeleton runs as-is. The extensions turn it into something that fits your stack.
await using: Automatic cleanup, if your tsconfig plays along
Many Playwright APIs now return async disposables. With await using, resources clean themselves up when they go out of scope. No more try/finally boilerplate for routes, init scripts, or ad-hoc pages.
The old pattern
test('old cleanup', async ({ context }) => {
  const page = await context.newPage();
  const route = await page.route('**/*', r => r.continue());
  try {
    await page.goto('https://playwright.dev');
    // run test
  } finally {
    await page.unroute('**/*');
    await page.close();
  }
});
The new pattern
test('auto-cleanup', async ({ context }) => {
  await using page = await context.newPage();
  {
    await using route = await page.route('**/*', r => r.continue());
    await using script = await page.addInitScript('console.log("init")');
    await page.goto('https://playwright.dev');
    // run test
  }
  // route and init script already disposed here
  // page disposed when test function returns
});
Cleaner read, no forgotten finally blocks, fewer test-isolation bugs at scale.
What you need to run this
Before you add await using to your suite, check three boxes:
- TypeScript 5.2 or newer. The syntax was added in TS 5.2. Earlier versions will fail to parse the file.
- Node.js 18.18+, 20.4+, or 22+. Older Node versions don't expose Symbol.asyncDispose at runtime, so the code parses but crashes on execution.
- tsconfig.json target set to ES2022 or later, with lib including ESNext.Disposable. Without the lib entry, TypeScript won't recognize the Symbol.asyncDispose API the runtime depends on.
{
  "compilerOptions": {
    "target": "ES2022",
    "lib": ["ES2022", "ESNext.Disposable", "DOM"]
  }
}
If you're on a Playwright project bootstrapped in the last 12 months, you probably already meet all three. If you're on an older repo with target: "ES2017" or "lib": ["ES2020"], you'll need the tsconfig update before the syntax works.
Snapshots and locators
Four locator and snapshot additions that quietly improve day-to-day test writing.
page.ariaSnapshot()
page.ariaSnapshot() gets a one-call shortcut for the full page accessibility tree, and locator.ariaSnapshot() gains depth and mode options for scoping the output.
const snapshot = await page.ariaSnapshot();
// Same as: await page.locator('body').ariaSnapshot()
Useful in debug logs when a test fails, and you want the full page state, not just one element.
locator.normalize()
Converts a locator that uses brittle CSS selectors into one that follows Playwright best practices, pulling test IDs and ARIA roles where available.
const button = page.locator('[data-testid="checkout-button"]');
const normalized = button.normalize();
// Converts to: page.getByTestId('checkout-button')
The pw-agent repo shipped with raw [data-testid="..."] selectors throughout:
checkout.spec.ts
// Before normalization
await page.locator('[data-testid="header-cart-icon"]').click();
await page.locator('[data-testid="checkout-button"]').click();
// After normalization (cleaner, more maintainable)
await page.getByTestId('header-cart-icon').click();
await page.getByTestId('checkout-button').click();
Run normalize() on any locator and commit the output. Your future self will thank you.
page.pickLocator()
An interactive locator picker, same idea as the browser extension, but built into the API.
const locator = await page.pickLocator();
// Hover elements in the browser window.
// Click the one you want.
// Returns a Locator for that element.
Combine this with page.pause() in a dev session, click the thing, get a clean locator, paste it into the test.
Storage, console, and errors
Four smaller APIs that cover state management and log handling.
Reset storage state without a new context
await browserContext.setStorageState(newState);
// Clears cookies, localStorage, IndexedDB for all origins
// Then loads newState. No need to dispose and recreate the context.
Before 1.59, you created a new context every time you wanted a clean slate. Now you flip state on the same one, which is faster and keeps page references alive.
Clear console messages and page errors
page.clearConsoleMessages();
page.clearPageErrors();
Useful in long-running test flows where you want to assert "no new errors after this point."
Filter console messages
const warnings = await page.consoleMessages({
  filter: (msg) => msg.type() === 'warning',
});
The filter option runs server-side, so you don't pull every message into Node to throw most of them away.
Trace and reporter upgrades
Two changes you will notice in CI.
retain-on-failure-and-retries
New trace mode that keeps a trace for every retry attempt, not just the final pass or fail:
// playwright.config.ts
export default defineConfig({
  use: {
    trace: 'retain-on-failure-and-retries',
  },
});
For a flaky test that passes on retry, you can now compare the failing trace against the passing one, side by side. This is the fastest way to diagnose timing-dependent flakes.
UI Mode filters
- Only show tests affected by source changes - narrows the list during development.
- Improved action filtering across UI Mode and Trace Viewer.
- HTML Reporter now shows the list of runs from the same worker and lets you search by test step.
A complete 1.59 workflow: Agent writes, runs, fixes
Every 1.59 feature works together in single scenario, using the uploaded pw-agent repo as the base. This is what agentic testing looks like in 1.59.
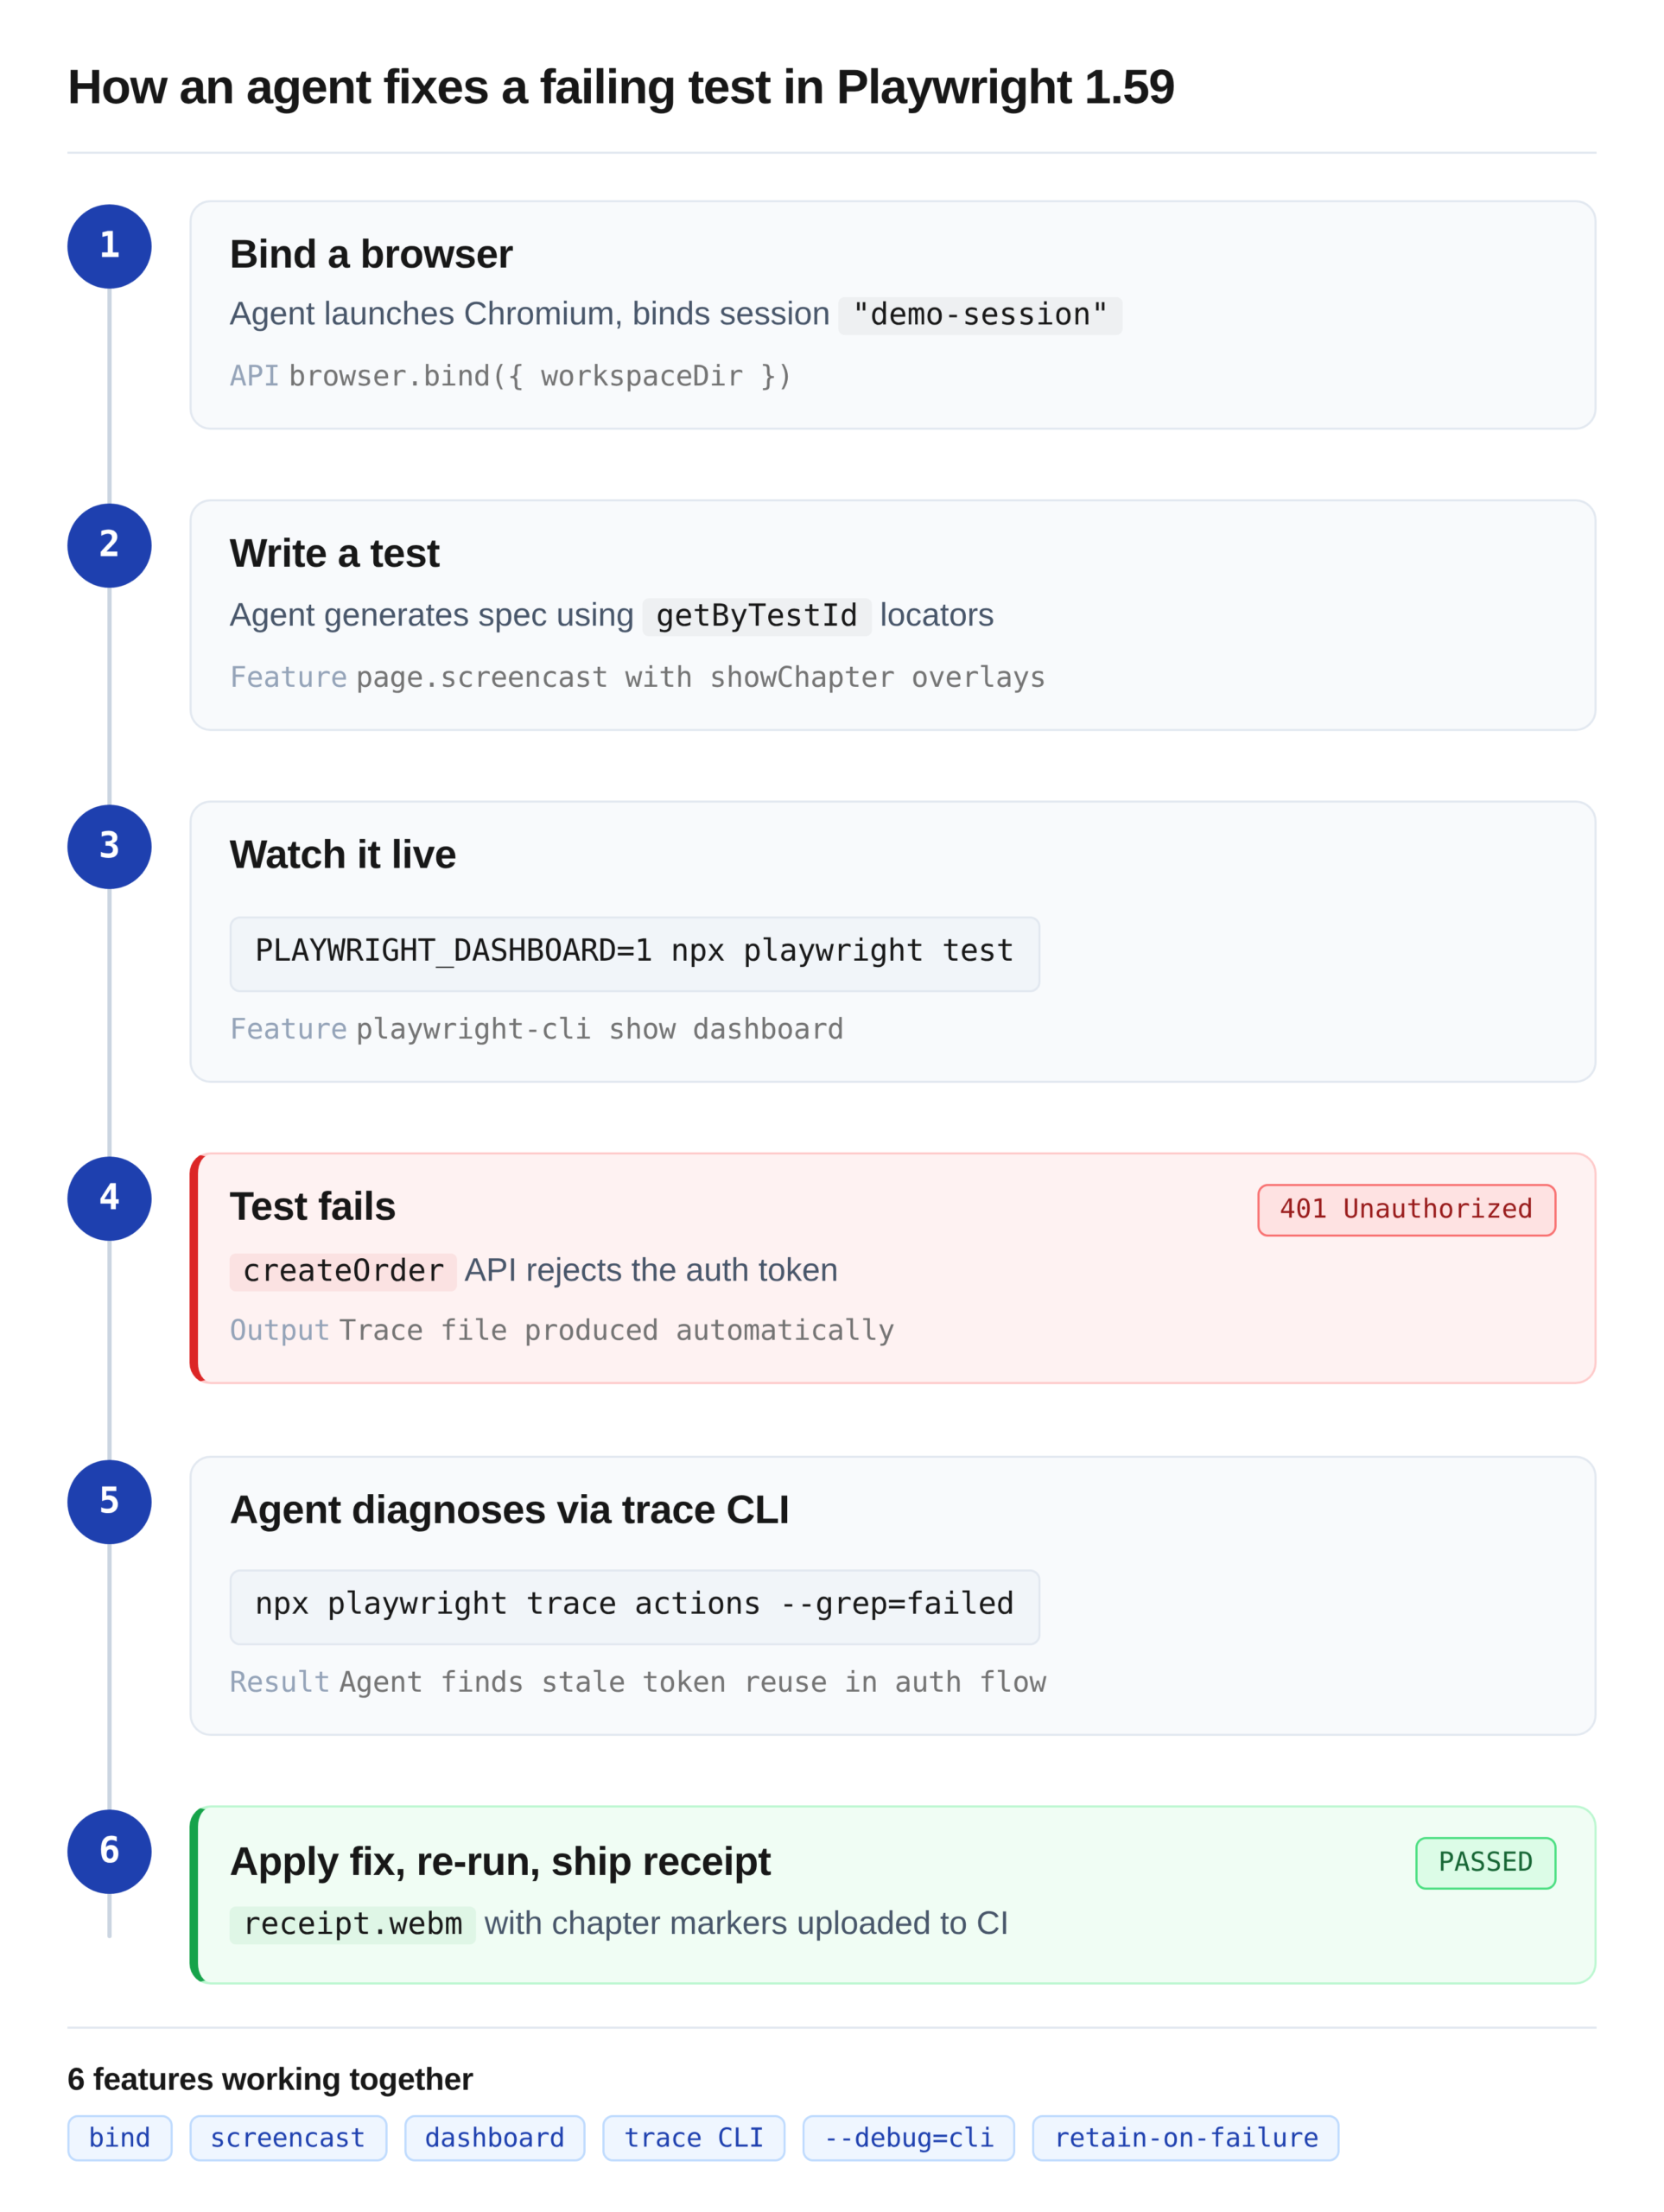
Setup: Bind a browser
The agent launches Chromium and binds it under a session name. Playwright-CLI and the MCP server both connect to the same browser.
setup.ts
const browser = await chromium.launch();
const { endpoint } = await browser.bind('demo-session', {
  workspaceDir: process.cwd(),
});
Phase 1: The agent writes a test
Given the pw-agent repo's structure, the agent writes a checkout test:
complete-purchase.spec.ts
test('complete purchase flow', async ({ page }) => {
  await page.screencast.start({ path: 'receipt.webm' });
  await page.screencast.showActions({ position: 'top-right' });
  await page.screencast.showChapter('Register', { duration: 1000 });
  await page.goto('/');
  await page.getByTestId('header-user-icon').click();
  await page.getByTestId('login-signup-link').click();
  // ... fill registration form
  await page.screencast.showChapter('Add to cart', { duration: 1000 });
  await page.getByTestId('header-menu-all-products').click();
  await page.locator('.product-card').first().click();
  await page.getByTestId('add-to-cart-button').click();
  await page.screencast.showChapter('Checkout', { duration: 1000 });
  await page.getByTestId('header-cart-icon').click();
  await page.getByTestId('checkout-button').click();
  // ... fill address, place order
  await page.screencast.stop();
});
Phase 2: Watch it live
PLAYWRIGHT_DASHBOARD=1 npx playwright test complete-purchase.spec.ts
Every worker shows in the dashboard. The human watches the chapter overlays flip through Register, Add to cart, and Checkout.
Phase 3: Test fails
The known createOrder 401 surfaces, same as documented in the pw-agent repo's README. The run produces a trace file.
Phase 4: Agent diagnoses via trace CLI
$ npx playwright trace open test-results/complete-purchase-chromium/trace.zip
$ npx playwright trace requests
  23  0:00.890  POST /api/orders  →  401 Unauthorized
$ npx playwright trace action 23
  Network request failed with 401
  Response body: {"error":"token_invalid"}
The trace tells the agent the token sent to createOrder is being rejected. The agent checks the auth flow, finds the token is generated once and reused, and sees the checkout API expects a freshly refreshed token.
Phase 5: Apply the fix and retry
The agent patches the test to refresh the token before the order call, re-runs with --debug=cli to step through the fix, and confirms the order submits.
Phase 6: Screencast receipt ships to CI
The re-run produces receipt.webm with chapter overlays. CI uploads it as an artifact. The next human reviewer scrubs to the "Checkout" chapter to confirm the fix.
Where 1.59 changes the practical workflow
The pattern breaks down across teams for one reason: a passing agent fix on one branch can hide a recurring failure on another. If the same 401 shows up in 3 branches this week, you want to see it as one issue, not three.
TestDino's AI groups failures across runs by root cause, so a repeated createOrder 401 surfaces as one recurring issue with a count, not three separate noisy failures in three branches. The agent fixes the symptom; the platform tracks the pattern.
Should you upgrade to Playwright 1.59?
Upgrade now if
- You run any coding agent (Claude Code, Cursor, Copilot) against your tests. The trace CLI and --debug=cli are the biggest practical wins in the release.
- Your suite runs 4+ workers in parallel. The dashboard pays for itself the first time you avoid opening 6-headed browsers.
- You care about flaky-test forensics. retain-on-failure-and-retries is the new default for serious CI setups.
Wait if
- Your team runs WebKit tests on macOS 14. Upgrade the OS first or stay on 1.58 until you can.
- You rely on @playwright/experimental-ct-svelte. You will need to migrate Svelte component tests before 1.59 is safe.
Install 1.59.1, always
Skip 1.59.0. Pin to 1.59.1 or later, or the Windows regression will bite you on the first CI run.
Key takeaways
Playwright 1.59 is a workflow release, not a syntax release.
The screencast API and the dashboard cover the observability gap that pushed teams toward third-party test recorders. browser.bind() and the trace CLI plus the --debug=cli options are built specifically for coding agents, turning the trace file into a queryable resource rather than a GUI-only artifact.
Upgrade to 1.59.1 on a clean branch, run the dashboard once, and wire the trace CLI into your agent's skill folder. Those three steps deliver most of the value in the release.
FAQs
Table of content
Flaky tests killing your velocity?
TestDino auto-detects flakiness, categorizes root causes, tracks patterns over time.
Follow Us