BrowserStack Test Reporting & Analytics (previously called Test Observability) provides test run analytics, flaky test detection, and failure categorization. It works with or without BrowserStack execution infrastructure.
The Pro tier starts at $299/month and includes AI-based failure tagging, custom dashboards, and quality gates. The free tier covers basic reporting with 30-day retention.
But teams running Playwright on GitHub Actions, GitLab CI, or Azure DevOps often find that BrowserStack Test Reporting is built around a broader platform ecosystem. Features like test management, CI/CD optimization, and Playwright-specific debugging are either limited or absent.
Here are the 7 best BrowserStack alternatives for 2026.
Best BrowserStack Alternatives: How to Choose the Right Tool
We evaluated each tool based on test reporting depth, AI failure analysis, flaky test detection, test management, CI/CD integration, Playwright support, and pricing transparency.
How to Compare BrowserStack Test Reporting Alternatives
Here is a quick comparison of the top alternatives to Allure TestOps that can help you identify your preferred test reporting tool:
 TestDino |  BrowserStack |  ReportPortal |  TestMu AI |  Katalon | |
|---|---|---|---|---|---|
| PricingLowest paid plan, per the listed billing terms. | $39/month (billed annually) | Free / $299/month (Pro) | $599/month (SaaS) | $199/month | $67/seat/month (intro, 5-seat pack) |
| Best for | Playwright test intelligence & management | Cross-browser testing teams | Reporting with history and clustering | Cross-browser cloud execution at scale | All-in-one Katalon platform analytics |
| Playwright integration | Native (trace viewer, error grouping, MCP) | Via SDK | Via agents | Reporter integration | Via reporter plugin |
| Ease of use |  |  |  | | |
| One-step CI setup | SDK integration per framework | Docker Compose setup | YAML + CLI config | Via Runtime Engine / CLI | |
Dashboards & Reporting | |||||
| Unified Playwright dashboard | Custom widgets (Pro) | Custom widgets | Pre-built templates | Unified multi-framework report | |
| Multi-tab test run detail | Summary, History, AI Insights & more | Build-level view | Launch-level view | Basic summaries | |
| Pull request insightsSee test results and history for each pull request. | |||||
| Test ExplorerBrowse tests as a hierarchy, a flat list, or by tag. | Launch tree | ||||
| Real-time streaming | Per-shard/worker | ||||
| Scheduled PDF reportsGet report PDFs emailed on a set schedule. | Daily/Weekly/Monthly | Email/Slack alerts | |||
Test Analytics | |||||
| Analytics: trends & patterns | Build trends and stability | Widget-based | Basic charts | ||
| Code coverage, per-file | Istanbul, run-level | ||||
| Environment analytics | Pass-rate/flaky by env | Via attributes | |||
Debugging & Evidence | |||||
| Built-in Playwright trace viewer | |||||
| Screenshots & video replay | Embedded | Via reporter attachments | |||
| Console logs | Node + browser | Session logs | If attached | Session logs | Via attachments |
| Visual diff comparison | |||||
| Smart error grouping | Message/stack/location | Unique error analysis | Pattern matching | Basic clustering | AI root cause analysis |
| Flaky detectionSpot tests that pass and fail inconsistently, with a stability score. | Requires config | Flaky tests view (no %) | |||
| Playwright tags & annotations | Priority/owner/links/metrics | Smart tags | Custom attributes | ||
CI/CD Optimization | |||||
| Rerun only failed tests | Re-run from dashboard | ||||
| GitHub CI Checks quality gates | Per-env + mandatory tags | Build verification rules | Release readiness gates | ||
| Branch → environment mappingMatch each Git branch to the environment it runs against. | Exact/regex | ||||
| Smart rerun historyTrack reruns tied to each branch and commit. | |||||
| Sharded / parallel run support | Per-shard live view | Parallel launches | |||
| Native CI breadth | GitHub, GitLab, Azure DevOps, TeamCity, Bitbucket, CircleCI, Jenkins | CI plugins | Agents/plugins | GitHub, GitLab | Jenkins, GitHub Actions, CircleCI, GitLab, Azure DevOps, Bamboo, Bitbucket |
| Self-managed GitLab | |||||
Test Management | |||||
| Test case management | |||||
| Bulk test creationGenerate many test cases at once from PRDs, Jira, or user stories. | via MCP | ||||
| Release trackingGroup test results by release, cycle, or sprint. | |||||
| Exploratory / manual sessions | |||||
| Import / export test cases | JSON/CSV/ZIP | Via API | |||
AI & Automation | |||||
| Local MCPLet AI coding assistants in your editor query test data directly. | Cursor/Claude Code/Copilot | Limited scope | |||
| Remote MCPLet web-based AI tools query your test data. | |||||
| AI test run summary on GitHub PRs | GitHub/GitLab/Slack | New failure, always-failing tags | |||
| AI test auditAI scores your test suite and gives a downloadable report. | Release readiness reports | ||||
| AI failure classification | Failure reason tagging | ML auto-analysis | AI root cause analysis | ||
Integrations & Collaboration | |||||
| Bug tracking breadth | Jira, Linear, Asana, monday | Jira | Jira, Rally | Jira, Trello | Jira, Azure DevOps, GitHub |
| Slack notifications | App + webhooks | ||||
Platform & Security | |||||
| Public API & CLIs | REST + tdpw / testdino | REST API | REST API | REST API | REST API + CLI |
| Project-level AI controls | Per-feature toggles | Tenant-level governance | |||
| Compliance & certifications | ISO 27001, SOC 2 Type II, GDPR | ISO 27001, SOC 2 Type II | Self-managed (your infra) | ISO 27001, SOC 2 | SOC 2, SSO, SCIM (Ent) |
Plans & Pricing | |||||
| Plan tiers | Free · Pro $39 · Team $79 · Enterprise | Free · Pro $299 · Enterprise | OSS free (self-hosted) · SaaS $599 · Enterprise | Free · Pro from $199 · Enterprise | Free Trial · Team $67-167/seat · Enterprise |
| Free executions | 5,000/mo | Varies | Unlimited (self-host) | 300 min | 30-day trial |
| Support | Chat + Slack Connect + Priority email | 24/7 email | Community / Paid | Chat + email | Digital 24/5 (Team) · Live + CSM (Ent) |
| Try for free | Learn more | Learn more | Learn more | Learn more | |
Best BrowserStack Competitors for Modern Test Analytics
Here are the 7 best alternatives to BrowserStack Test Reporting for teams that want focused test intelligence:
1. TestDino
$49
/monthBest for:
Playwright-first teams that need test reporting, test management, and CI/CD optimization in one platform, without stitching multiple tools together.
Platform Type:
Test reporting, dashboards, test management, and CI observability platform for Playwright
Integrations with:
GitHub Actions, GitLab CI, Azure DevOps, TeamCity, Jira, Linear, Asana, monday, Slack
Key Features:
 Test management and automated reporting in one place
- AI failure classification into 4 categories
- Built-in trace viewer with DOM snapshots and network logs
- Error grouping by message and stack trace
- GitHub CI Checks as merge quality gates
- Rerun only failed tests to cut CI pipeline time
- MCP Server for AI agent queries from your IDE
- Flaky test detection across run history
- AI summaries posted to GitHub commits
- Real-time results streaming via WebSocket
- Code coverage per file breakdown

Pros
- Playwright-native with under 10-minute setup
- Test management and automated reporting on the same platform
- Broad CI/CD support: GitHub Actions, GitLab CI, Azure DevOps, TeamCity
- AI summaries posted to GitHub commits, GitLab MRs, and Slack
- 1-click bug filing into Jira, Linear, Asana, or monday
- Affordable at $39/month billed annually

Cons
- Purpose-built for Playwright (multi-framework support on the roadmap)
First Hand Experience
BrowserStack Test Reporting & Analytics provides test analytics across frameworks. Still, the features that matter most for Playwright teams, like trace viewing, code coverage, and test management, are either absent or require SDK configuration per framework. For teams that run only Playwright, the platform is broader than they need.
TestDino is built entirely around Playwright test intelligence. Test management and automated test reporting live on the same platform. Manual test cases sit in suites up to 6 levels deep with ownership, custom fields, and version history. Results flow in from CI and link to test cases in the UI without SDK adapters.
The Test Explorer gives you both manual and automated tests side by side, sortable by flaky rate, tags, and coverage status. Every feature is purpose-built for Playwright workflows.
Debugging That Saves You from Re-running Locally
Each failed test in TestDino comes with screenshots, video, browser console logs, and a trace you can step through action by action. Available right after the CI run finishes.
AI Insights classifies each failure as Actual Bug, UI Change, Unstable Test, or Miscellaneous. Bug filing is 1-click into Jira, Linear, Asana, or monday, pre-filled with error details, stack trace, failure history, and links to the run and CI job.
CI/CD Speed and Merge Safety
Rerun failed tests re-executes only failures, not the full suite. Works across sharded runs and different CI runners.
GitHub CI Checks adds quality gates to your PRs. Set a minimum pass rate, mark critical tags as mandatory, and configure different rules per environment. AI-generated summaries are posted to GitHub commits and GitLab merge requests with pass/fail/flaky counts.
Flaky Test Detection That Tells You Why
Flaky test detection classifies unstable tests by root cause: timing-related, environment-dependent, network-dependent, or assertion-intermittent. Each test gets a stability percentage, and you can compare flaky rates across environments to spot infrastructure problems.
Real-Time Streaming and Scheduled Reports
Results appear on the dashboard as each test completes via real-time streaming, not after the full suite finishes. Automated PDF reports deliver test health summaries on daily, weekly, or monthly schedules. Slack notifications send run summaries filtered by environment and branch.
MCP Server for AI-Assisted Workflows
The MCP Server connects your AI assistant (Cursor, Claude Code, Copilot) to your test data. List test runs, pull debugging context, perform root cause analysis, and manage manual test cases through natural language. It covers both automated debugging and test management without switching tools.
Pricing & Value
Pricing may vary. Check the pricing page for the latest details.
Final Verdict
TestDino is the most direct BrowserStack Test Reporting alternative for Playwright teams. Where BrowserStack Test Reporting offers broad multi-framework analytics at $299/month, TestDino delivers Playwright-specific intelligence with AI failure classification, a built-in trace viewer, error grouping, and test management at $39/month billed annually.
It also includes CI/CD optimization features like rerun-failed-tests and GitHub CI Checks, which BrowserStack Test Reporting handles through build verification rules rather than native Playwright support. For teams that run Playwright on their own CI infrastructure, TestDino provides deeper, more focused reporting at a lower cost.
Pricing & Value
Four plans available on TestDino, each built for a different stage of team growth.
2. ReportPortal
Best for:
Teams that want self-hosted, open-source test reporting with ML-based failure pattern matching.
Platform Type:
Open-source test reporting platform (self-hosted or SaaS)
Integrations with:
Jenkins, GitHub, GitLab, Jira, Rally
Key Features:
- ML-based pattern matching for failure clustering
- Custom dashboard widgets for run data
- Multi-framework result aggregation
- Self-hosted with full data control
- Launch-level run history
Pros
- Open source with self-hosting option
- Supports many test frameworks
- Custom dashboard widgets for reporting
Cons
- Setup requires Docker Compose and maintenance
- SaaS starts at $599/month
- Limited Playwright-specific debugging features
First Hand Experience
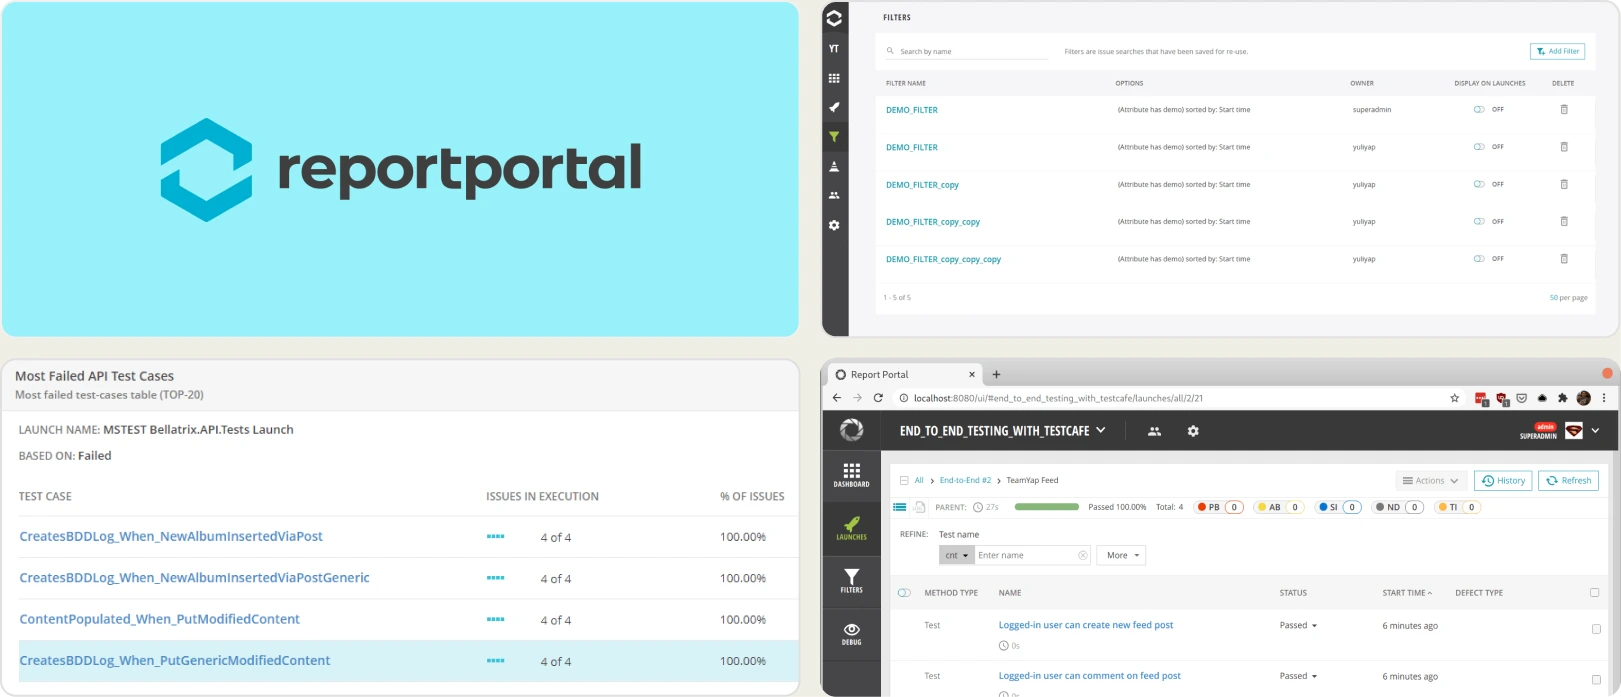
ReportPortal aggregates test results from multiple frameworks and uses ML-based pattern matching to identify recurring failure clusters. The self-hosted option gives full data control. Setup requires Docker Compose, database configuration, and ongoing infrastructure maintenance. As an open source alternative to BrowserStack test reporting, it trades managed hosting for data control.
Pricing & Value
Free (open source, self-hosted). SaaS starts at $599/month for the Startup tier.
Final Verdict
ReportPortal fits teams that want self-hosted test reporting with ML-based failure analysis. For teams that prefer managed platforms with Playwright-specific intelligence, simpler options exist.
3. TestMu AI
Best for:
Teams running cross-browser and cross-device test execution in the cloud.
Platform Type:
Cloud test execution and analytics platform
Integrations with:
Jira, Slack, GitHub, GitLab, CI/CD pipelines
Key Features:
- Cloud browser and device grid for test execution
- Test analytics with flaky test flags
- Screenshots, video, and session logs
- Visual regression testing
- CI/CD pipeline integrations
Pros
- Wide browser and device coverage
- Free tier with 300 minutes included
- Parallel execution reduces test cycle time
Cons
- Primarily an execution platform, reporting is secondary
- Playwright-specific analytics are surface-level
- Costs increase quickly with parallel usage
First Hand Experience
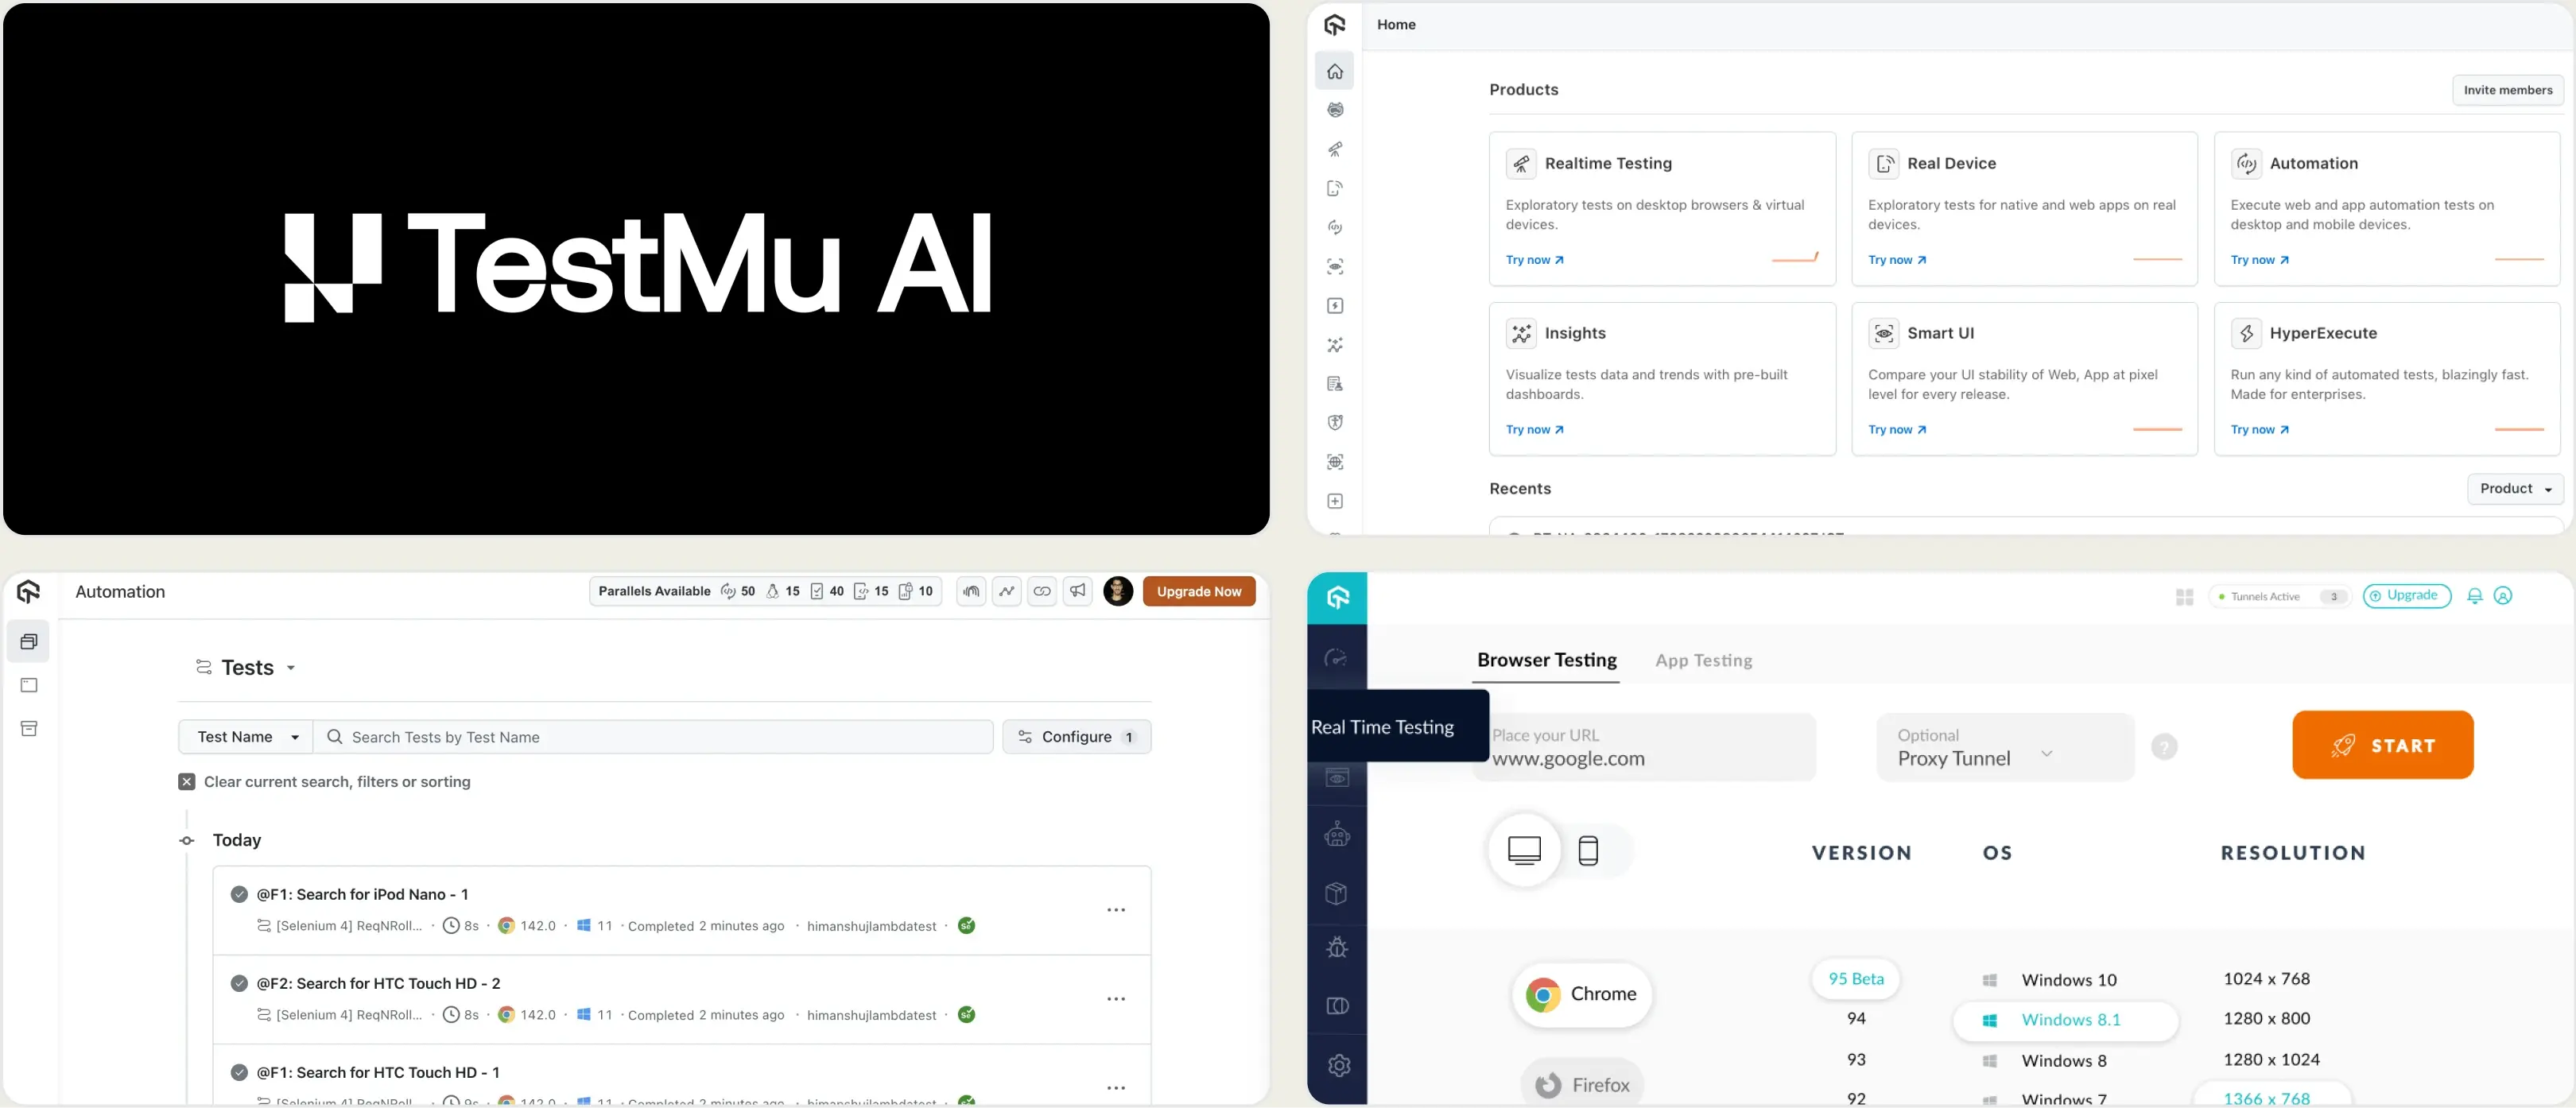
TestMu AI provides cloud infrastructure for running tests across browsers and devices. The QA reporting dashboard shows pass/fail summaries, flaky test flags, and session recordings. For teams that need a cloud execution grid with basic reporting, it covers the essentials. Teams looking for deeper test failure analysis or Playwright-specific intelligence may find the analytics limited to execution-level data.
Pricing & Value
Starts at $159/month billed annually for cloud execution. Free tier includes 300 minutes.
Final Verdict
TestMu AI is a reasonable option for teams that need cross-browser cloud execution with basic analytics. For teams focused on Playwright test reporting and failure analysis depth, evaluate whether an execution-first platform matches your needs.
4. Katalon True Platform
Best for:
Teams using Katalon Studio for test authoring and execution.
Platform Type:
Test management and analytics platform within the Katalon ecosystem
Integrations with:
Jira, Jenkins, CI/CD tools
Key Features:
- Test case management with execution history
- Run scheduling and orchestration
- Flaky test detection and analytics
- Custom dashboard widgets
- CI/CD pipeline triggers
Pros
- Integrated with Katalon Studio ecosystem
- Test management included in the platform
- Analytics dashboard with trend views
Cons
- Tightly coupled to Katalon Studio
- Limited value for non-Katalon frameworks
- Custom pricing requires contacting sales
First Hand Experience
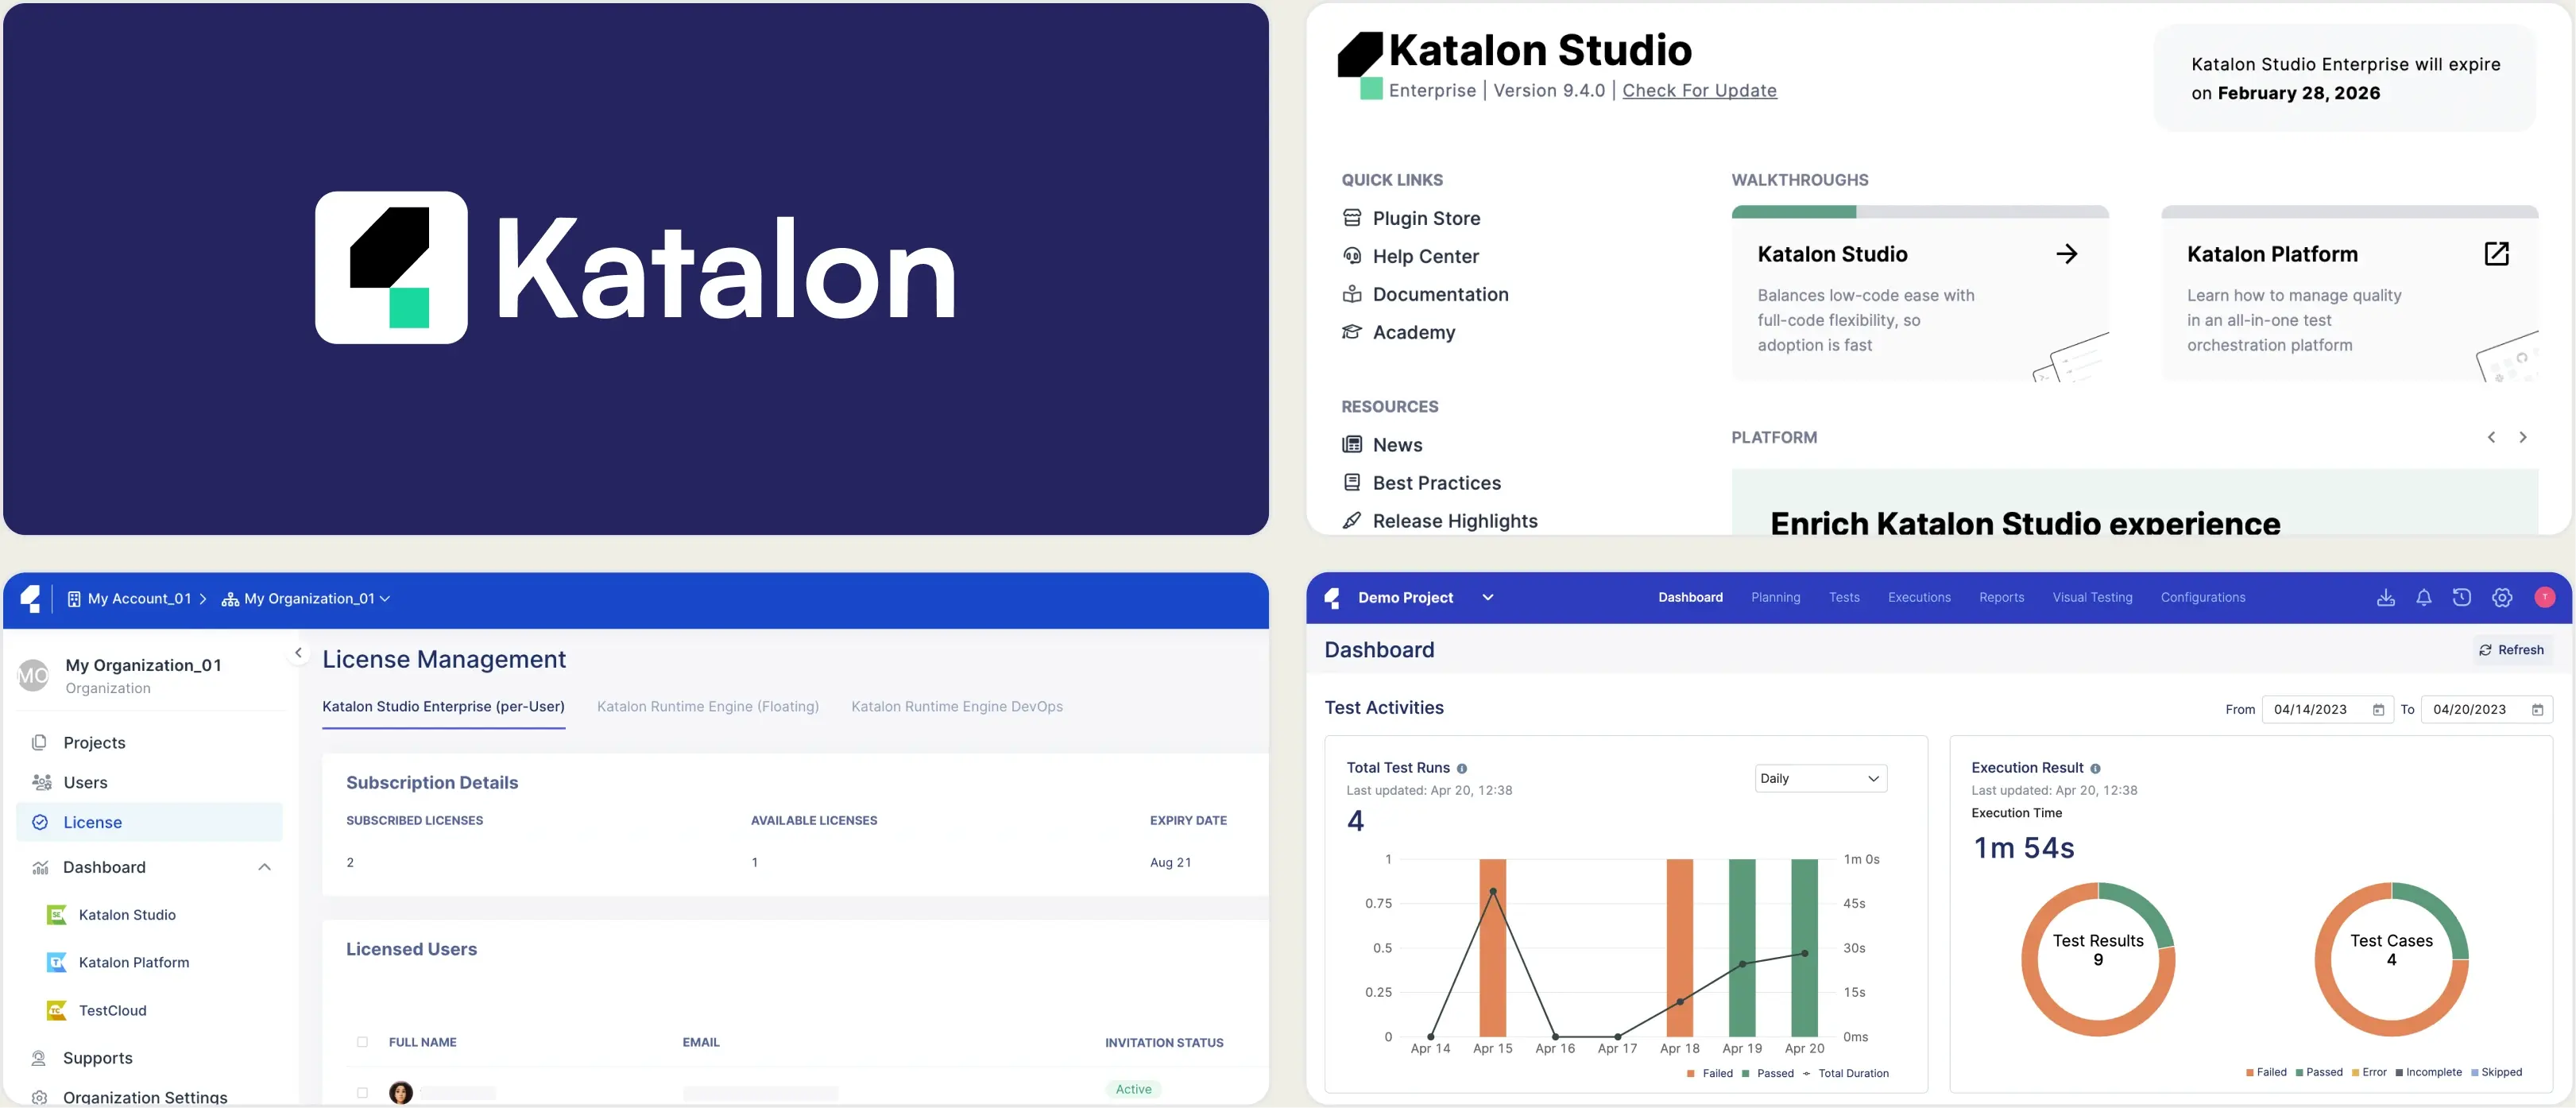
Katalon True Platform provides test management and analytics within the Katalon ecosystem. It handles run scheduling, execution history, and flaky test detection for tests authored in Katalon Studio. Teams using other frameworks such as Playwright or Cypress may find the platform's value tied to the Katalon toolchain, limiting its usefulness as a standalone reporting tool.
Pricing & Value
Custom pricing (contact sales). Free plan available with limited features.
Final Verdict
Katalon True Platform fits teams already using Katalon Studio. For teams running Playwright or other open-source frameworks, the dependency on the Katalon ecosystem limits the platform's standalone reporting value.
5. Datadog Test Optimization
Best for:
Teams already using Datadog for system monitoring who want test run visibility in the same dashboard.
Platform Type:
CI pipeline monitoring with test analytics add-on
Integrations with:
CI/CD, Slack, Jira, PagerDuty
Key Features:
- Test run visibility inside CI pipeline views
- Flaky test detection and tracking
- Custom dashboards and alert rules
- Test execution tracing with flame graphs
- CI pipeline performance metrics
Pros
- Fits well if Datadog is already your monitoring tool
- Flaky test detection is mature
- Good CI pipeline-level visibility
Cons
- Built for system monitoring, not test reporting
- QA teams find the interface complex and broad
- Costs grow with data ingestion and retention
First Hand Experience
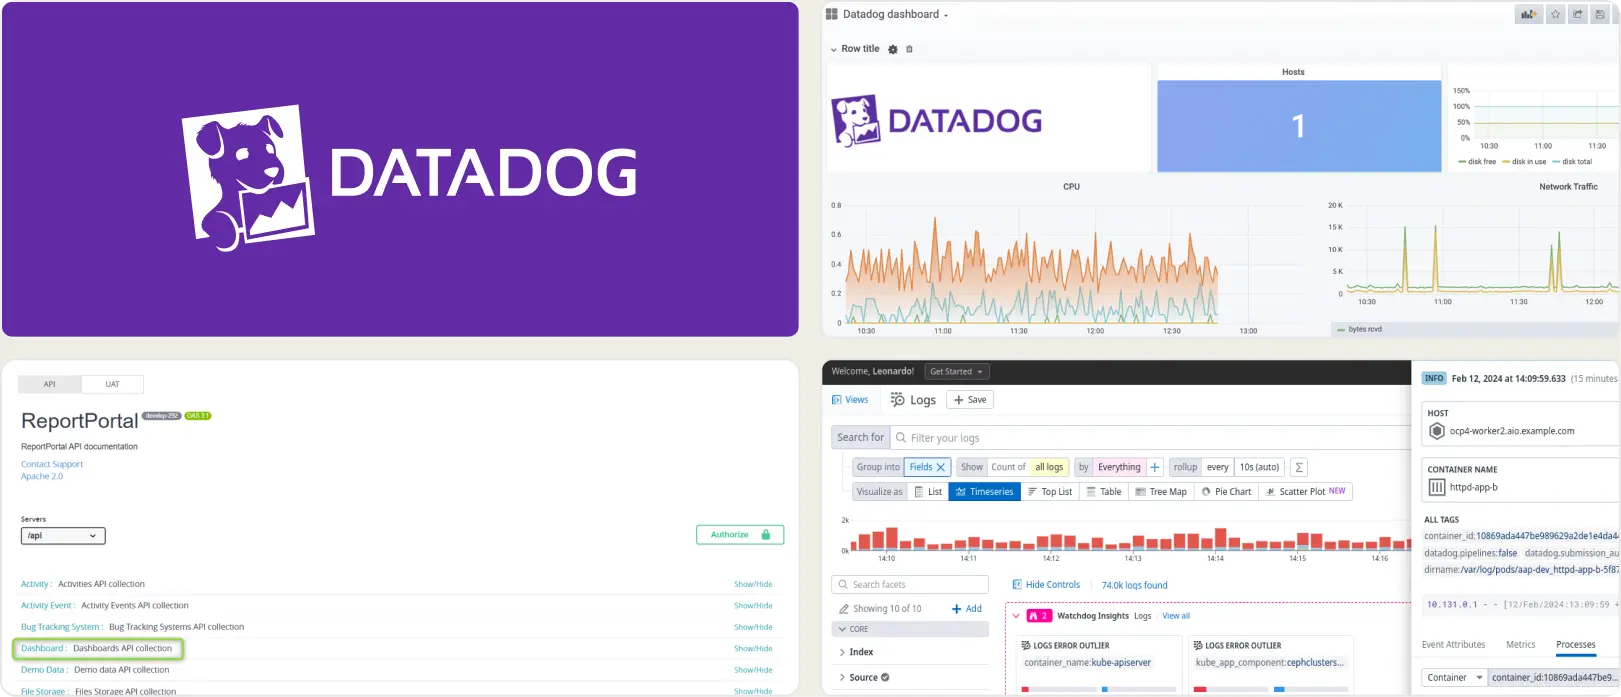
Datadog Test Optimization adds test analytics to an existing monitoring stack. It works best when your team already uses Datadog for infrastructure and wants test data in the same place. QA engineers navigate through system monitoring interfaces to reach test-specific insights. Teams looking for focused test reporting will need to pair it with a separate tool.
Pricing & Value
Per-committer, usage-based pricing starts at $20/month/committer. Costs are hard to predict as test artifacts and logs scale. Test spans are retained for 3 months.
Final Verdict
Datadog fits teams already using it for system monitoring. For QA-led teams looking for focused test reporting and management, purpose-built platforms offer a more direct path.
6. Allure TestOps
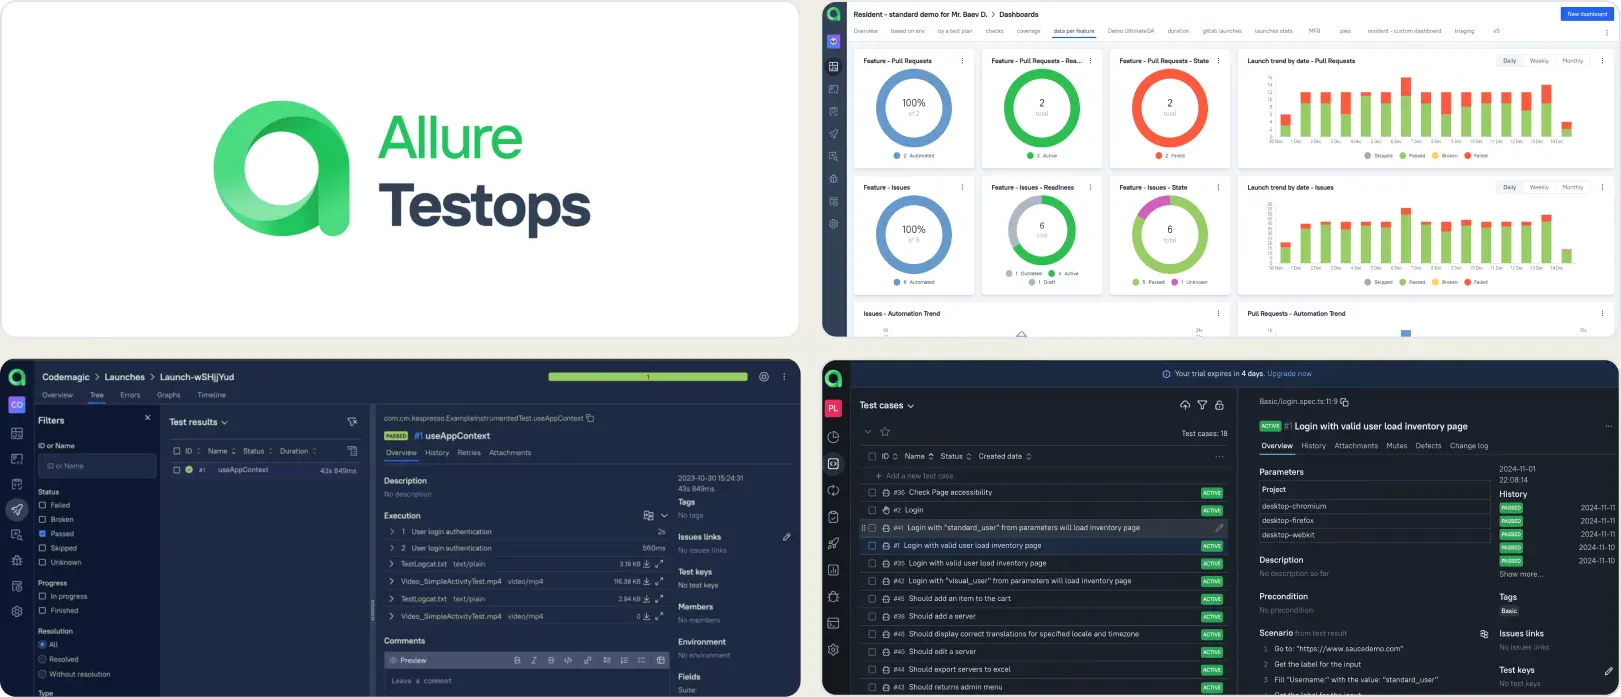
Best for:
QA teams with formal test management processes that need structured reporting workflows.
Platform Type:
Test management and reporting platform
Integrations with:
Jira, GitHub, GitLab, Jenkins
Key Features:
- Test case organization with launch history
- CI/CD adapter integrations
- Configurable dashboards via AQL queries
- Access control and permissions
- Report exports and sharing
Pros
- Established feature set for structured QA
- Works across multiple test frameworks
- Configurable dashboards and reports
Cons
- Setup and adapter configuration require effort
- Smaller teams may find the overhead heavy
- Reporting requires manual dashboard building
First Hand Experience
Allure TestOps provides a structured workspace for organizing test cases and viewing launch results. The platform works best when teams have defined QA processes and the bandwidth to set up adapters and configure dashboards. Teams looking for faster onboarding and built-in failure intelligence may find the configuration effort slows time-to-value.
Pricing & Value
Custom pricing. Targets teams that need formalized test management with governance.
Final Verdict
Allure TestOps fits teams that follow structured QA processes. For teams prioritizing fast setup and focused test analytics, lighter platforms get to value faster.
7. Trunk
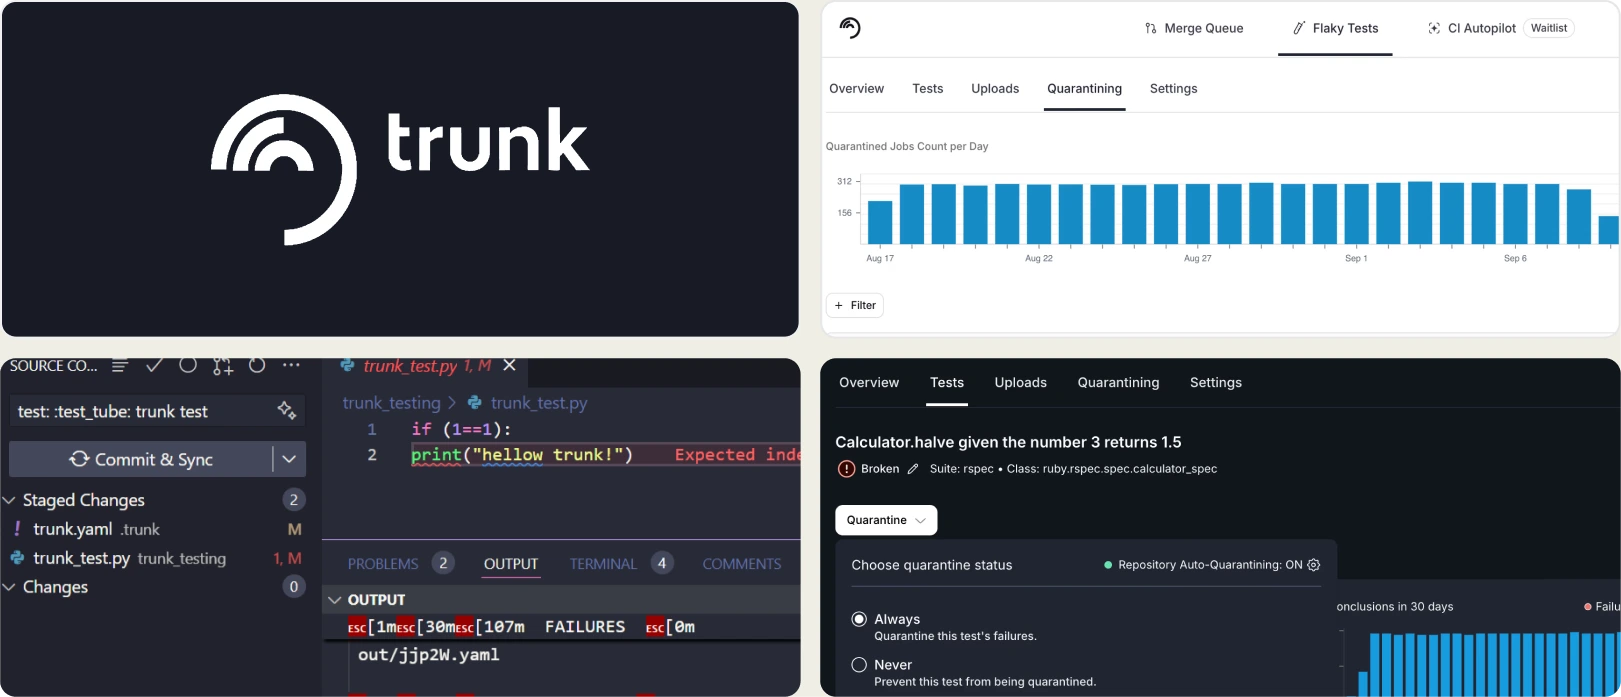
Best for:
Engineering teams focused on CI reliability and flaky test quarantine at scale.
Platform Type:
CI reliability platform with flaky test detection
Integrations with:
GitHub, Jira, Linear, Slack
Key Features:
- Flaky test detection with auto-quarantine
- AI failure clustering for similar errors
- Environment-variant detection for flakes
- CI pipeline analytics and health trends
- Jira and Linear ticket auto-creation
Pros
- Strong flaky quarantine keeps CI green
- Works across all languages and frameworks
- Jira/Linear auto-ticketing for flaky tests
Cons
- No test reporting dashboards or run views
- No Playwright-specific debugging features
- Pricing requires contacting sales
First Hand Experience
Trunk focuses on keeping CI pipelines moving by automatically detecting and quarantining flaky tests. AI-powered failure clustering groups similar failures and tracks stability trends. It integrates with Jira and Linear for ticket creation. Teams that need Playwright-specific reporting, an embedded trace viewer, or test management will need to pair Trunk with a separate QA analytics platform.
Pricing & Value
Contact sales for pricing. Free tier available for getting started.
Final Verdict
Trunk is a strong option for teams focused on CI reliability and flaky test quarantine. For teams that also need Playwright test reporting, failure classification, and test management, it works best as a complementary tool alongside a dedicated reporting platform.
What to look for when replacing BrowserStack Test Reporting & Analytics
BrowserStack has a capable analytics tool, but at $299/month, it competes with platforms that include test management, CI optimization, and Playwright-specific debugging. Here is what matters when evaluating alternatives.
Playwright-specific debugging, not just multi-framework coverage
Multi-framework support sounds flexible, but for Playwright teams, it often means generic reporting. Look for platforms with a built-in Playwright trace viewer, DOM snapshots per action, and console log capture per test.
These features reduce debugging time more than any test execution dashboard widget. The difference between session-level cross-browser test reports and test-level Playwright debugging is the time between "this test failed" and "here is exactly why."
Test management on the same platform
If your reporting tool does not include test case management, you need a separate tool for that, plus integrations to link them. Platforms that combine manual and automated test management with test suite analytics eliminate the integration layer.
A single platform gives you one source of truth for coverage, automation progress, and test run history without maintaining separate subscriptions and data sync.
AI failure classification that prioritizes fixes
Failure reason tagging is helpful. AI classification that separates real defects from flaky tests, UI refactors, and environment issues is more actionable. Look for tools that automatically classify test failure analysis results and surface persistent patterns versus new regressions.
The best test reporting platforms 2026 go beyond tagging to provide automated test insights that prioritize what your team should fix first.
CI/CD optimization beyond build verification
Build verification rules to check pass/fail status. CI optimization goes further: rerunning only failed tests, blocking merges with configurable quality gates, and posting AI summaries directly to commits and pull requests.
These features reduce pipeline time and improve merge safety. If your current tool only verifies builds but does not optimize the CI/CD test analytics workflow, you are leaving pipeline efficiency on the table.
Predictable pricing at a lower cost
$299/month for test analytics is significant, especially for small and mid-size teams. Flat monthly pricing with published plans lets you evaluate total cost before committing. Compare what you get at $39/month versus $299/month with test stability metrics, error grouping, and test management included.
For teams looking to switch from BrowserStack test reporting, the cost comparison should factor in what is included at each price point, not just the headline number.
Wrapping Up
BrowserStack Test Reporting provides solid multi-framework test analytics with flaky detection, failure tagging, and custom dashboards. At $299/month for the Pro tier, it is positioned as an add-on to the BrowserStack ecosystem.
ReportPortal offers self-hosted ML-based reporting. TestMu AI provides cross-browser execution with basic analytics. Katalon True Platform works within the Katalon ecosystem. Datadog adds test visibility to system monitoring. Allure TestOps targets QA teams with formal processes.
For Playwright-first teams that want AI failure classification, test management, flaky test detection, and CI/CD optimization in one platform at a fraction of the cost, TestDino combines test intelligence, management, and reporting at $39/month billed annually.
Get clarity beyond pass and fail
Pinpoint failure causes fastShare PR-ready test insightsFAQs
They serve different scopes. BrowserStack Test Reporting aggregates results from many frameworks. TestDino focuses on Playwright test intelligence with AI failure classification, trace viewer, and test management. Teams can use BrowserStack for cross-browser execution and TestDino for Playwright-specific reporting.