Cypress Cloud is widely adopted as the official dashboard for Cypress tests, offering run recordings, flaky test detection, and parallelization out of the box.
But Cypress Cloud is designed specifically for Cypress test suites. Teams using Playwright, Selenium, or multiple testing frameworks may prefer alternatives that provide broader framework support and unified test reporting across their testing ecosystem.
In this guide, we compare 5 of the best Cypress Cloud alternatives worth considering in 2026 on reporting, analytics, and team collaboration.
The goal is to help you find the right tool to improve your testing workflow.
Best Cypress Cloud Alternatives: How to Choose the Right Tool
A modern tool must fit into how teams already work. We assessed how well each platform embeds quality insights directly into the developer workflow, including the MCP server, dashboards, automated test summaries in pull requests, and native integrations with Slack, Jira, and Linear. This creates a shared, real-time view of quality across the team.
How to Compare Cypress Cloud Alternatives
Here is a quick comparison of the top alternatives to Cypress Cloud to help you identify your preferred test reporting tool:
TestDino |  Cypress Cloud |  BrowserStack |  Sauce Labs |  ReportPortal | |
|---|---|---|---|---|---|
| PricingLowest paid plan, per the listed billing terms. | $39/month (billed annually) | Free (limited) / $75/month | $299/month | $19/month | $599/month (SaaS) |
| Best for | Playwright test intelligence & management | Cypress-native recording & parallelization | Cross-browser cloud execution | Multi-framework cloud execution | Self-hosted open-source reporting |
| Playwright integration | Native (trace viewer, error grouping, MCP) | Cypress only | Via reporter | Via reporter | Via agents |
| Ease of use |  | |  | |  |
| One-step CI setup | Cypress only | YAML + CLI config | CLI + config | Docker Compose setup | |
Dashboards & Reporting | |||||
| Unified Playwright dashboard | Cypress runs only | Pre-built templates | Custom dashboards | Custom widgets | |
| Multi-tab test run detail | Summary, History, AI Insights & more | Overview/Timeline/Runs | Basic summaries | Basic summaries | Launch-level view |
| Pull request insightsSee test results and history for each pull request. | Branch-level only | ||||
| Real-time streaming | Per-shard/worker | ||||
| Scheduled PDF reportsGet report PDFs emailed on a set schedule. | Daily/Weekly/Monthly | Custom monitors | |||
Test Analytics | |||||
| Analytics: trends & patterns | For test runs, test cases & more | Trend graphs only | Basic charts | Basic charts | Widget-based |
| Environment analytics | Pass-rate/flaky by env | Via attributes | |||
| Code coverage, per-file | Istanbul, run-level | ||||
Debugging & Evidence | |||||
| Built-in Playwright trace viewer | |||||
| Screenshots & video replay | Embedded | Embedded | |||
| Console logs | Node + browser | Via attachment | Session logs | Session logs | If attached |
| Visual diff comparison | |||||
| Smart error grouping | Message/stack/location | Basic grouping | Pattern matching | ||
| Flaky detectionSpot tests that pass and fail inconsistently, with a stability score. | Requires config | ||||
CI/CD Optimization | |||||
| Rerun only failed tests | Cypress only | ||||
| GitHub CI Checks quality gates | Per-env + mandatory tags | ||||
| Branch → environment mappingMatch each Git branch to the environment it runs against. | Exact/regex | ||||
| Self-managed GitLab | |||||
| Sharded / parallel run support | Per-shard live view | Parallel launches | |||
| Native CI breadth | GitHub, GitLab, Azure DevOps, TeamCity, Bitbucket, CircleCI, Jenkins | GitHub, GitLab, CircleCI | Major CI providers | Major CI providers | Agents/plugins |
Test Management | |||||
| Test case management | |||||
| Bulk test creationGenerate many test cases at once from PRDs, Jira, or user stories. | via MCP | ||||
| Release trackingGroup test results by release, cycle, or sprint. | |||||
| Exploratory / manual sessions | |||||
| Import / export test cases | JSON/CSV/ZIP | Via API | |||
AI & Automation | |||||
| MCP ServerLet AI coding assistants in your editor query test data directly. | Cursor/Claude Code/Copilot | ||||
| AI test suite auditAI scores your test suite and gives a downloadable report. | |||||
| AI summaries posted to commits | |||||
| AI failure classification | ML-based auto-analysis | ||||
Integrations & Collaboration | |||||
| Bug tracking breadth | Jira, Linear, Asana, monday | Jira (link via annotations) | Jira, PagerDuty | Jira, Slack | Jira, Rally |
| Slack notifications | App + webhooks | ||||
Platform & Security | |||||
| Public API & CLIs | REST API + CLI | REST API | REST API | REST API | REST API |
| Project-level AI controls | Per-feature toggles | ||||
| Compliance & certifications | SOC 2 Type II, ISO 27001, GDPR | Not published | ISO 27001, SOC 2 | SOC 2 | Self-managed (your infra) |
Plans & Pricing | |||||
| Plan tiers | Free · Pro $39 · Team $75 · Enterprise | Free · Cloud $75 · Business $200 | Free trial · Plans from $29/mo | Free trial · Live from $39/mo · Virtual Cloud from $149/mo | OSS free · SaaS $599 · Enterprise |
| Free executions | 5,000/mo | 500 recordings | 100 min | Unlimited (self-host) | |
| Support | Chat + Slack Connect + Priority email | Email + community | Email + docs | Chat + email | Community / Paid |
| Try for free | Learn more | Learn more | Learn more | Learn more | |
Best Cypress Cloud Competitors for Persistent Test Analytics
Here are the 5 best alternatives to Cypress Cloud you can choose from to improve your test reporting:
1. TestDino
Best for:
Playwright-first teams that need test reporting, test management, and CI/CD optimization in one platform, without stitching multiple tools together.
Platform Type:
Test reporting, dashboards, test management, and CI observability platform for Playwright.
Integrations with:
GitHub Actions, GitLab CI, Azure DevOps, TeamCity, Jira, Linear, Asana, monday, Slack.
Key Features:
 Test management and automated reporting in one place
- AI failure classification into 4 categories
- Built-in trace viewer with DOM snapshots and network logs
- Error grouping by message and stack trace
- GitHub CI Checks as merge quality gates
- Rerun only failed tests to cut CI pipeline time
- MCP Server for AI agent queries from your IDE
- Flaky test detection across run history
- AI summaries posted to GitHub commits
- Code coverage per file breakdown

Pros
- Playwright-native with under 10-minute setup
- Test management and automated reporting on the same platform
- Broad CI/CD support: GitHub Actions, GitLab CI, Azure DevOps, TeamCity
- AI summaries posted to GitHub commits, GitLab MRs, and Slack
- 1-click bug filing into Jira, Linear, Asana, or monday
- Affordable at $39/month billed annually

Cons
- Purpose-built for Playwright (multi-framework support on the roadmap)
First-Hand Experience
Cypress Cloud does one thing well for Cypress users: it records test runs, parallelizes execution, and gives you a timeline view per spec. As testing requirements evolve, some teams adopt Playwright for its broader browser automation. In these cases, organizations often look for reporting platforms that support their preferred framework and workflow.
TestDino removes that fragmentation. Results persist automatically across runs, with dashboards, analytics, and AI failure classification working from the first CI run: no history file management, no hosting, no custom scripts.
Test management and automated reporting live on the same platform. Manual test cases sit in suites up to 6 levels deep with ownership, custom fields, and version history. The Test Explorer shows both manual and automated tests side by side, sortable by flaky rate, tags, and coverage status.
Debugging That Saves You from Re-running Locally
Each failed test in TestDino comes with screenshots, video, browser console logs, and a trace you can step through action by action, available right after the CI run finishes.
AI Insights classifies each failure as an Actual Bug, a UI Change, an Unstable Test, or Miscellaneous. Bug filing is 1-click into Jira, Linear, Asana, or monday, pre-filled with error details, stack trace, failure history, and links to the run and CI job.
CI/CD Speed and Merge Safety
Rerun failed tests re-executes only the failures, not the full suite. It works across sharded runs and different CI runners.
GitHub CI Checks adds quality gates to your PRs. Set a minimum pass rate, require critical tests to pass, and apply different rules per environment. AI-generated summaries are posted to GitHub commits and GitLab merge requests with pass/fail/flaky counts.
Flaky Test Detection That Tells You Why
Flaky test detection classifies unstable tests by root cause: timing-related, environment-dependent, network-dependent, or assertion-intermittent. Each test gets a stability percentage, and you can compare flaky rates across environments to spot infrastructure problems.
Real-Time Streaming and Scheduled Reports
Results appear on the dashboard as each test completes via real-time streaming, not after the full suite finishes. Automated PDF reports deliver test health summaries on daily, weekly, or monthly schedules. Slack notifications send run summaries filtered by environment and branch.
MCP Server for AI-Assisted Workflows
The MCP Server connects your AI assistant to your test data. List test runs, pull debugging context, perform root cause analysis, and manage manual test cases through natural language. It covers both automated debugging and test management without switching tools.
Pricing & Value
Pricing may vary. Check the pricing page for the latest details.
Final Verdict
Cypress Cloud gives you a snapshot of one Cypress run. TestDino provides persistent analytics and historical reporting for Playwright test suites across every run.
The total cost of ownership matters here. Cypress Cloud charges per recorded run and keeps advanced analytics on higher plans. TestDino replaces that overhead with historical test analytics, AI failure classification, error grouping, flaky detection, and test management for $39/month billed annually.
For teams that have outgrown Cypress-only dashboards and want test observability without building their own reporting infrastructure, TestDino is the closest match.
2. BrowserStack Test Reporting & Analytics
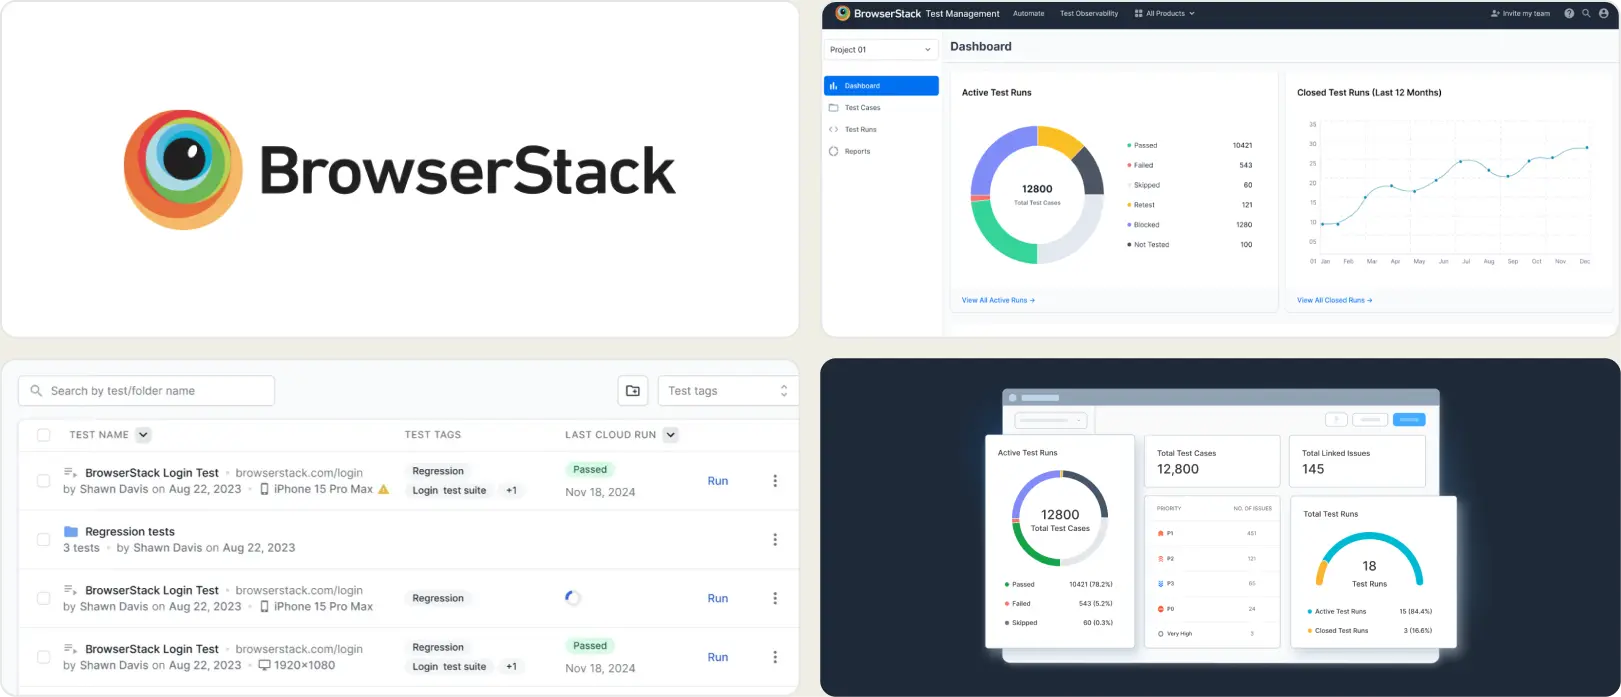
Best for:
Teams already using BrowserStack for cross-browser testing who want test visibility add-ons.
Platform Type:
Test analytics platform.
Integrations with:
Jira, CI/CD tools, Slack, PagerDuty.
Key Features:
- Test execution reports across browsers and devices
- Cross-browser insights
- Screenshots and video recording
- Basic trends and error grouping
- Custom dashboards with widgets (Pro plan)
- Flaky test detection and tracking
Pros
- A natural fit if your team is already on BrowserStack
- Easy cloud onboarding
- Works well for cross-browser runs
- Parallel execution reduces test cycle time
Cons
- Pro tier starts at $299/month
- Limited analytics depth for Playwright-specific debugging
- Execution-centric, not analysis-centric
- SDK integration required per framework
First-Hand Experience
BrowserStack Test Reporting provides visibility into execution across browsers and devices. Logs, screenshots, and videos are easy to access, which helps during active triage.
Over time, teams that rely on historical signals, role-specific views, or granular root-cause patterns may find the reporting layer relatively basic for long-term optimization. The Pro tier at $299/month adds custom dashboards and quality gates. Teams that started with Cypress Cloud and want a cross-browser layer on top often land here, though the value is clearest for Selenium or cross-device tests rather than Playwright-native workflows.
Pricing & Value
Reporting is bundled with execution plans, which simplifies procurement. Pricing scales with browser minutes and test volume, so costs can rise as automation and parallelism increase.
Final Verdict
A solid choice for organizations prioritizing cloud execution and quick visibility across devices. For buyers researching BrowserStack Test Reporting competitors, evaluate whether your roadmap emphasizes execution coverage or advanced test analytics and debugging depth.
3. Sauce Labs
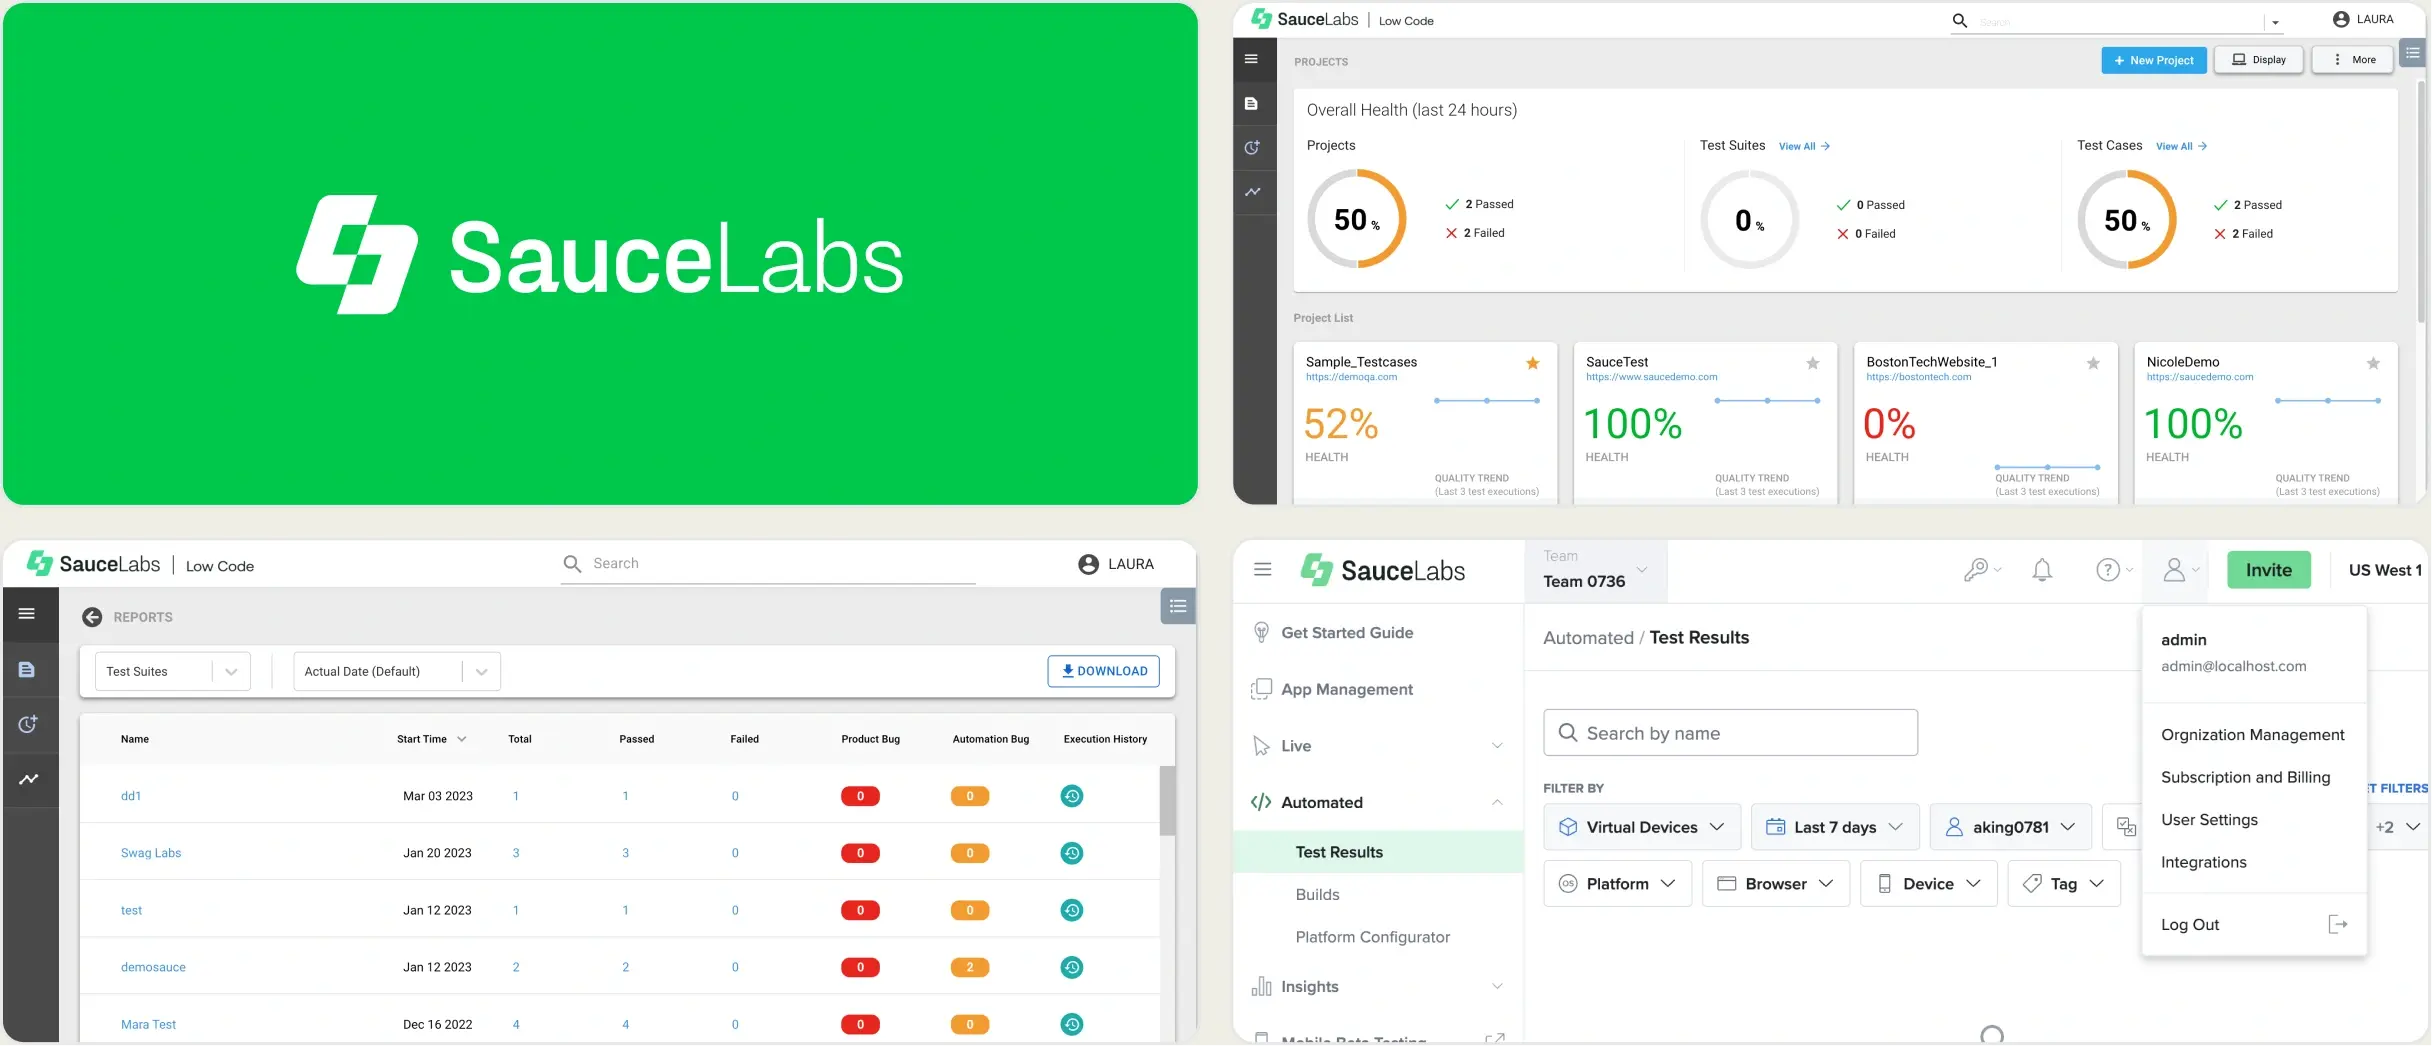
Best for:
Teams running multi-framework automated tests across large browser and device grids in the cloud.
Platform Type:
Cloud test execution and analytics platform.
Integrations with:
Jira, Slack, GitHub, GitLab, Jenkins, CircleCI.
Key Features:
- Cloud browser and device grid for test execution
- Test analytics with pass/fail trends
- Screenshots, video, and session logs
- Parallel and cross-browser execution
- CI/CD pipeline integrations
- Error reporting per session
Pros
- Wide browser, OS, and device coverage
- Supports Cypress, Playwright, Selenium, and WebdriverIO
- Free tier available
- Strong parallelization capabilities
Cons
- Primarily an execution platform; reporting is secondary
- Playwright-specific analytics are surface-level
- Costs increase quickly with parallel usage and data retention
- No built-in trace viewer or Playwright-native evidence panel
First-Hand Experience
Sauce Labs is a cloud execution grid that offers wide coverage across browsers and real devices. For teams that need to validate across many environments simultaneously, it covers that infrastructure layer.
Teams that have moved to Playwright often find that the Sauce Labs reporting layer does not go deep enough. Pass/fail per session is useful for execution validation, but triage workflows, including grouping failures by root cause, tracking flaky history, and getting AI summaries into PRs, require additional tooling on top.
Pricing & Value
Sauce Labs offers a free tier with limited parallel sessions. Paid plans start at $19/month but scale significantly with parallelism and data retention. Teams that run large suites frequently will want to model total monthly usage before committing.
Final Verdict
Sauce Labs is a reasonable option for teams that need multi-framework cloud execution at scale. For teams focused on Playwright test intelligence and persistent reporting, evaluate whether an execution-first platform matches your analytics needs.
4. ReportPortal
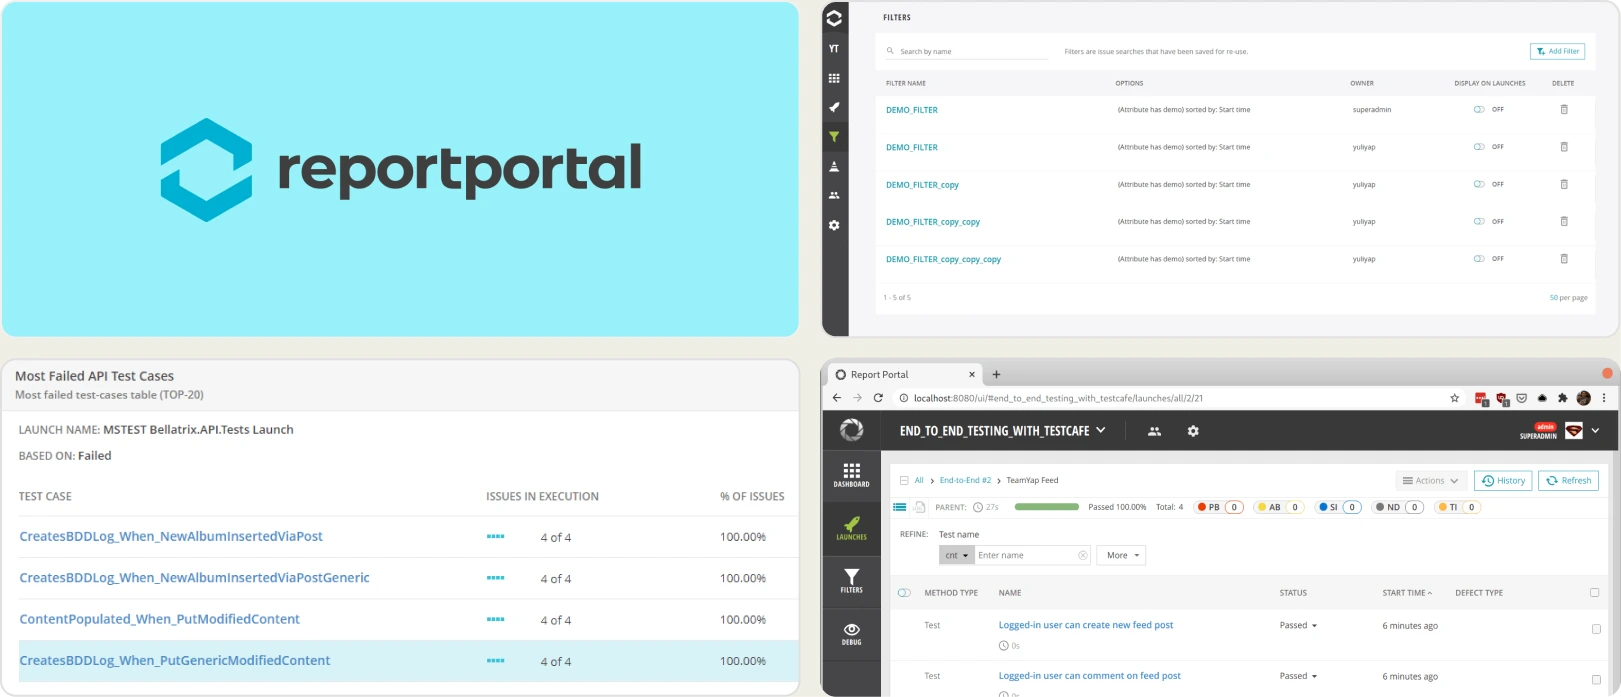
Best for:
Teams that want self-hosted, open-source test reporting with ML-based failure pattern matching.
Platform Type:
Open-source test reporting platform (self-hosted or SaaS).
Integrations with:
Jenkins, GitHub, GitLab, Jira, Rally.
Key Features:
- Open source test reporting
- Custom dashboard widgets for run data
- Self-hosted with full data control
- Launch-level run history
- Multi-framework support
Pros
- Free open source core
- Supports many test frameworks
- Persistent history across launches
- Full data ownership and control
Cons
- Limited AI-driven insights out of the box
- Requires hosting, setup, and ongoing maintenance
- Setup requires Docker Compose and maintenance
- SaaS version starts at $599/month
First-Hand Experience
ReportPortal provides the transparency and extensibility typical of open source, plus useful auto-analysis for grouping failures. In practice, teams often allocate ongoing developer time for upgrades, scaling, and fine-tuning dashboards.
The interface is functional, though it may feel dated for stakeholders who expect polished, role-specific views. For teams migrating away from Cypress Cloud, ReportPortal can store multi-framework results in one place, but the setup overhead is a real cost that should be considered.
Pricing & Value
The open source tier is attractive for cost control, but the total cost of ownership includes servers, observability, backups, and engineering effort. Managed SaaS plans reduce operational burden yet move pricing into an enterprise bracket.
Final Verdict
ReportPortal fits organizations that prioritize open source, need multi-framework aggregation, and can invest in maintenance. If speed to value and minimal upkeep are priorities, shortlist managed Playwright-specific platforms instead.
What to Look for in a Cypress Cloud Alternative
Choosing the right alternative means moving from a single-framework recording tool to an intelligent analytics platform. Your decision should be guided by your team's need for speed, collaboration, and data-driven insights.
Smart reporting and failure analysis
A modern Cypress Cloud alternative should help teams understand why tests fail, not just show pass/fail results. Look for AI failure classification, error grouping, flaky test detection, and root cause analysis.
Tools that classify failures and group related issues reduce triage time and help teams focus on real defects instead of investigating every failure manually.
Team collaboration and bug workflow
Test results should be easy to share across QA, developers, and managers. Look for integrations with Jira, Slack, Linear, and other collaboration tools.
Automated notifications, one-click bug creation, and shared dashboards help teams move from failure detection to resolution faster.
Analytics, test history, and flaky test detection
Reporting should extend beyond a single test run. Look for historical analytics, trend tracking, test stability metrics, and flaky test monitoring across environments.
Long-term visibility helps teams identify recurring issues, measure quality improvements, and make informed release decisions.
CI/CD integration and pipeline optimization
The best Cypress Cloud alternatives integrate directly with GitHub Actions, GitLab CI, Azure DevOps, Jenkins, and other CI/CD platforms.
Quality gates, rerun failed tests, pull request reporting, and automated summaries reduce pipeline time and improve deployment confidence.
Setup simplicity and ease of use
A reporting tool should provide value quickly without extensive configuration or infrastructure management.
Look for platforms with simple onboarding, clear dashboards, managed hosting options, and responsive support so teams can focus on testing rather than maintaining reporting infrastructure.
Wrapping Up
Cypress Cloud provides reporting and run visibility for Cypress teams, but organizations adopting Playwright often look for reporting platforms that align with their broader testing and quality engineering goals.
BrowserStack and Sauce Labs combine reporting with cloud execution infrastructure. ReportPortal focuses on centralized reporting and analytics across testing environments. Each addresses a different need.
For Playwright-first teams that want AI-powered failure classification, flaky test detection, test management, and CI/CD optimization in a single platform, TestDino combines reporting, analytics, and collaboration starting at $39/month billed annually.
Move from one run to full history
Keep analytics across every runClassify failures by root causeFAQs
Cypress Cloud is great for Cypress run recordings, but it is tightly coupled to one framework and charges per recorded run. A hosted analytics platform stores history across frameworks, shows trends, and gives searchable evidence so teams can track stability and spot regressions over time.