Compare CircleCI Test Insights vs TestDino. See how TestDino adds AI failure classification, inline Playwright traces, and an MCP Server.
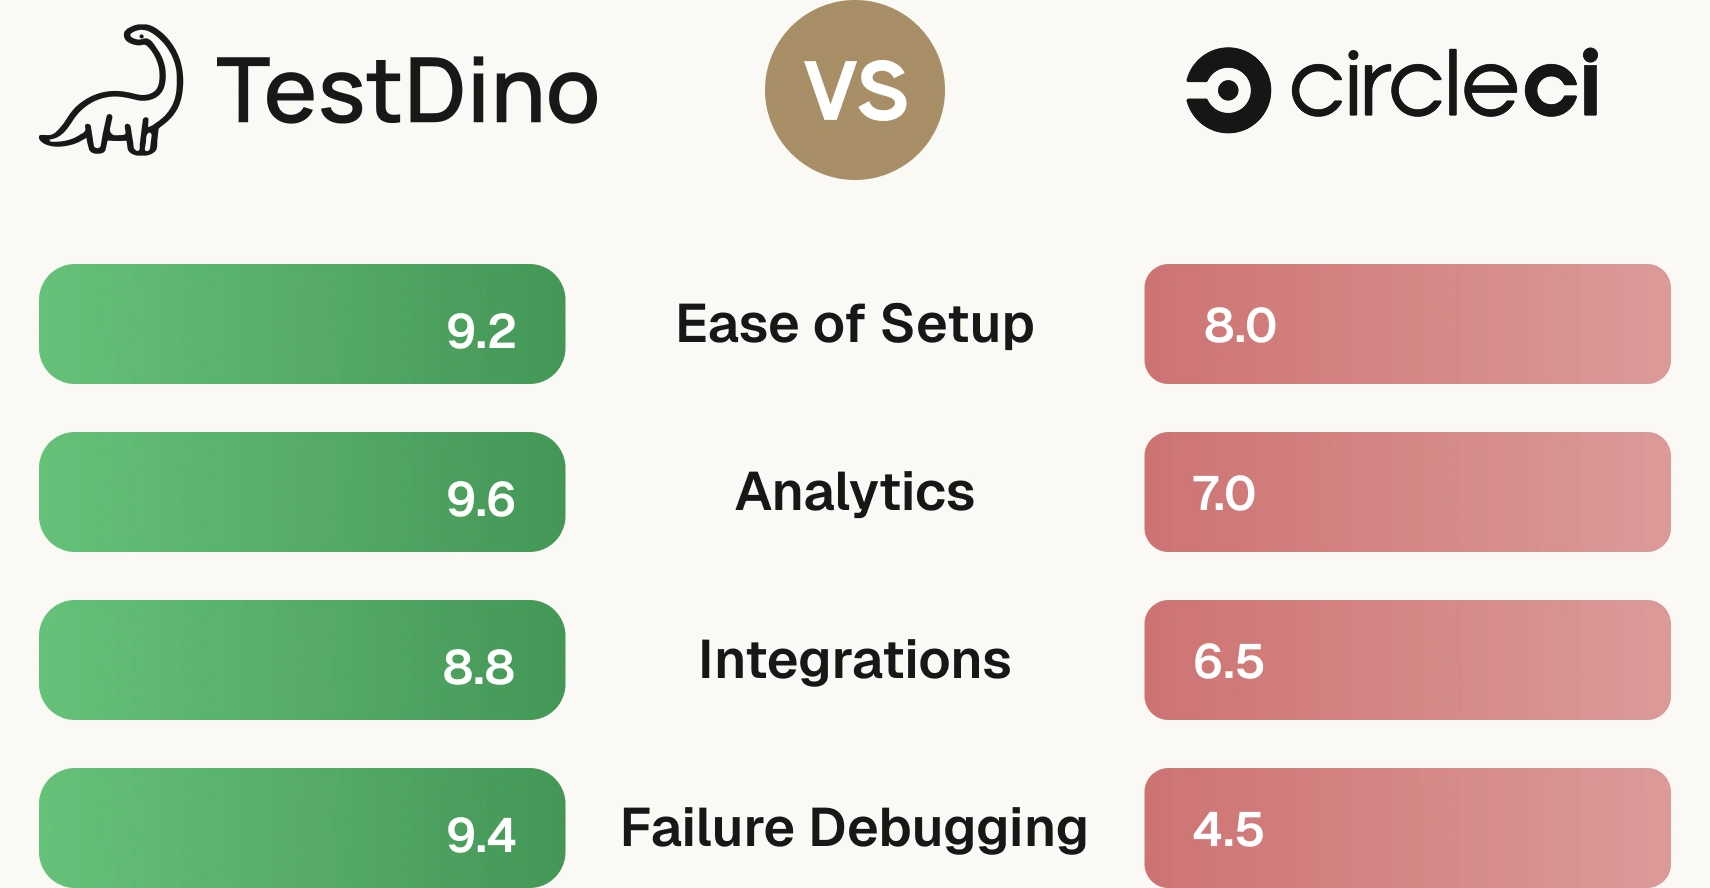
CircleCI Test Insights is a generic CI analytics dashboard. It parses JUnit XML results to display success rates, identify flaky tests, and highlight slow tests. TestDino does all of that too and goes further. So if you're weighing CircleCI Test Insights vs TestDino for your Playwright team, TestDino is a Playwright-focused test intelligence platform. It groups errors by root cause, ties each run to its pull request, and hands your test data to Claude Code, Cursor, or any MCP-compatible agent.
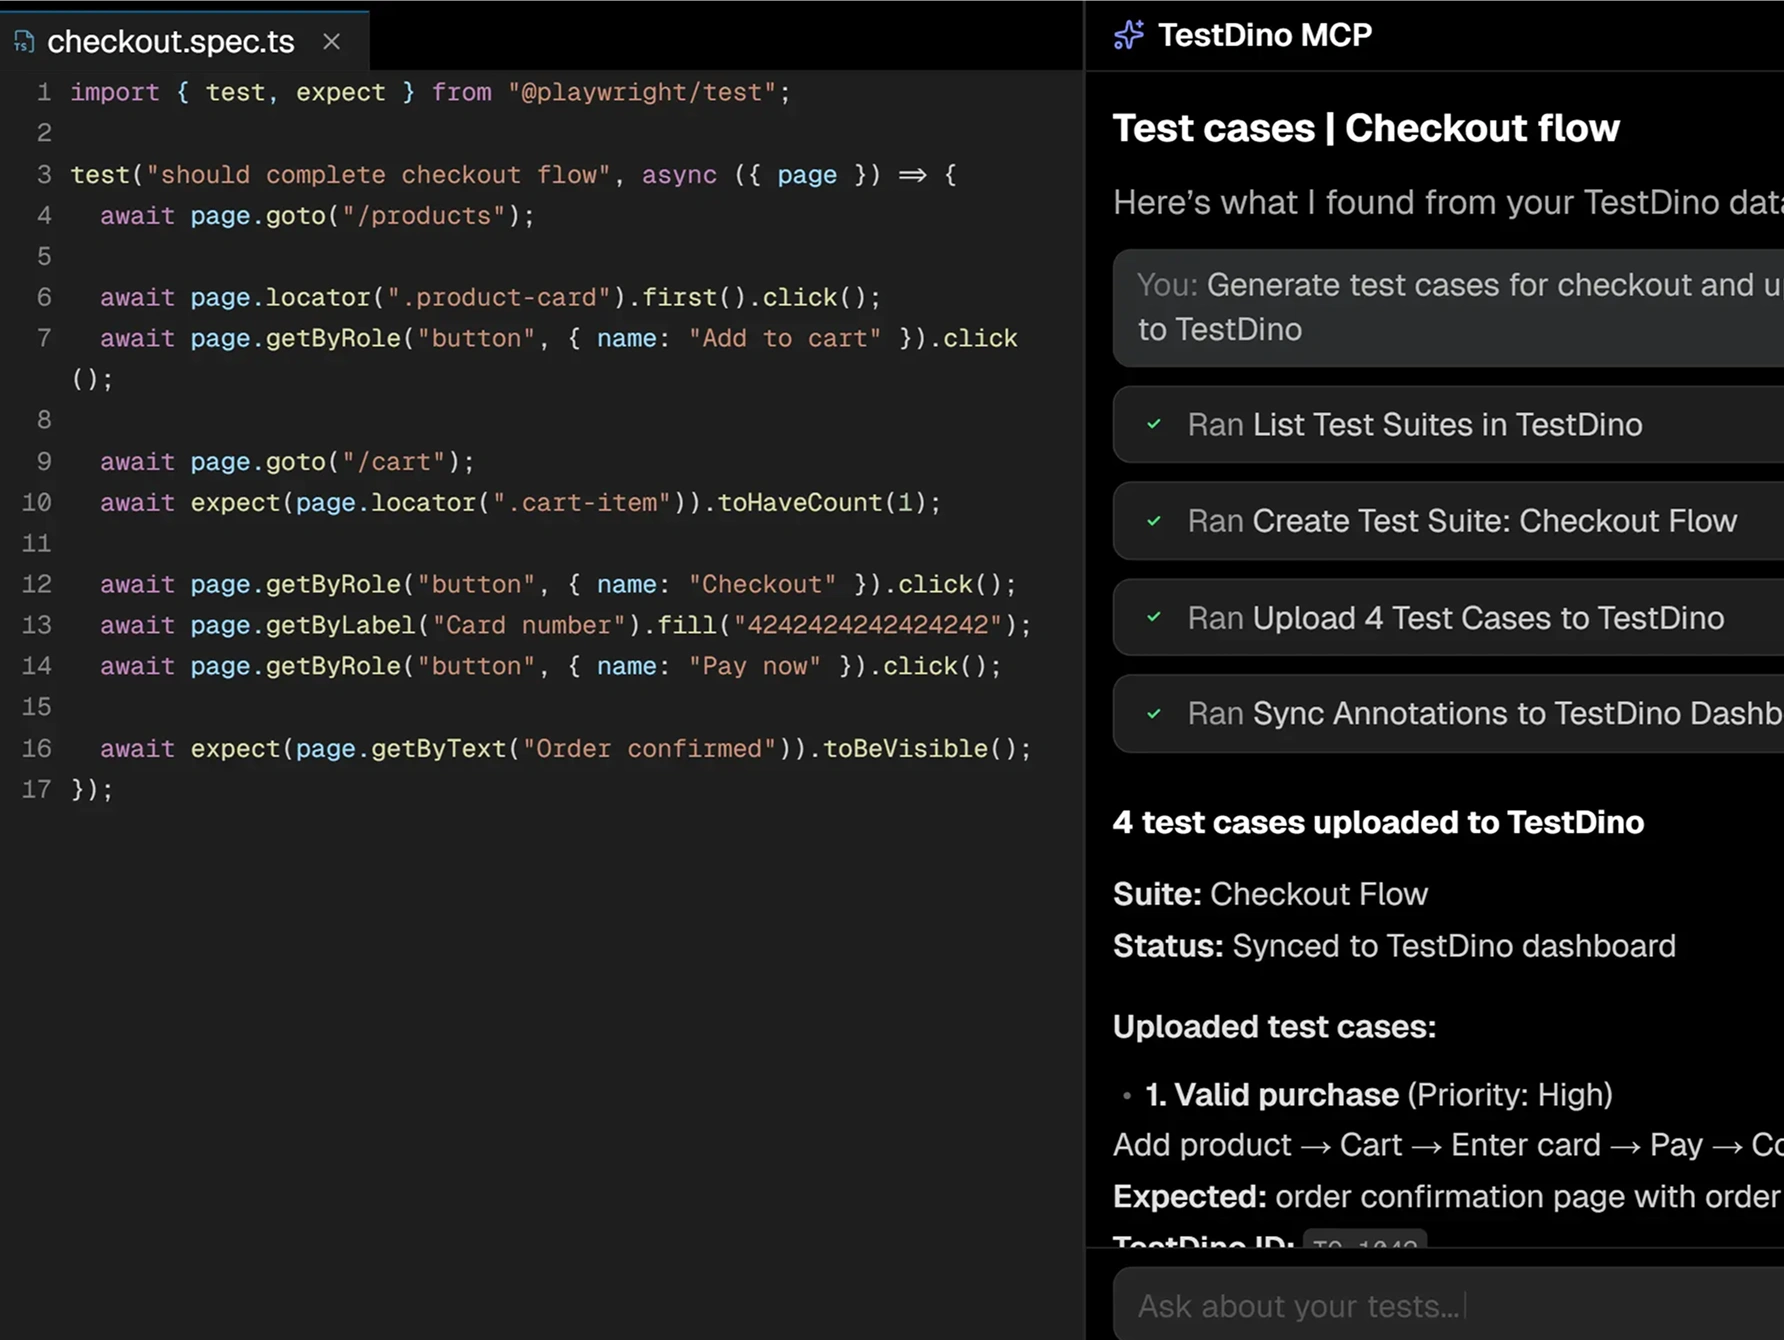
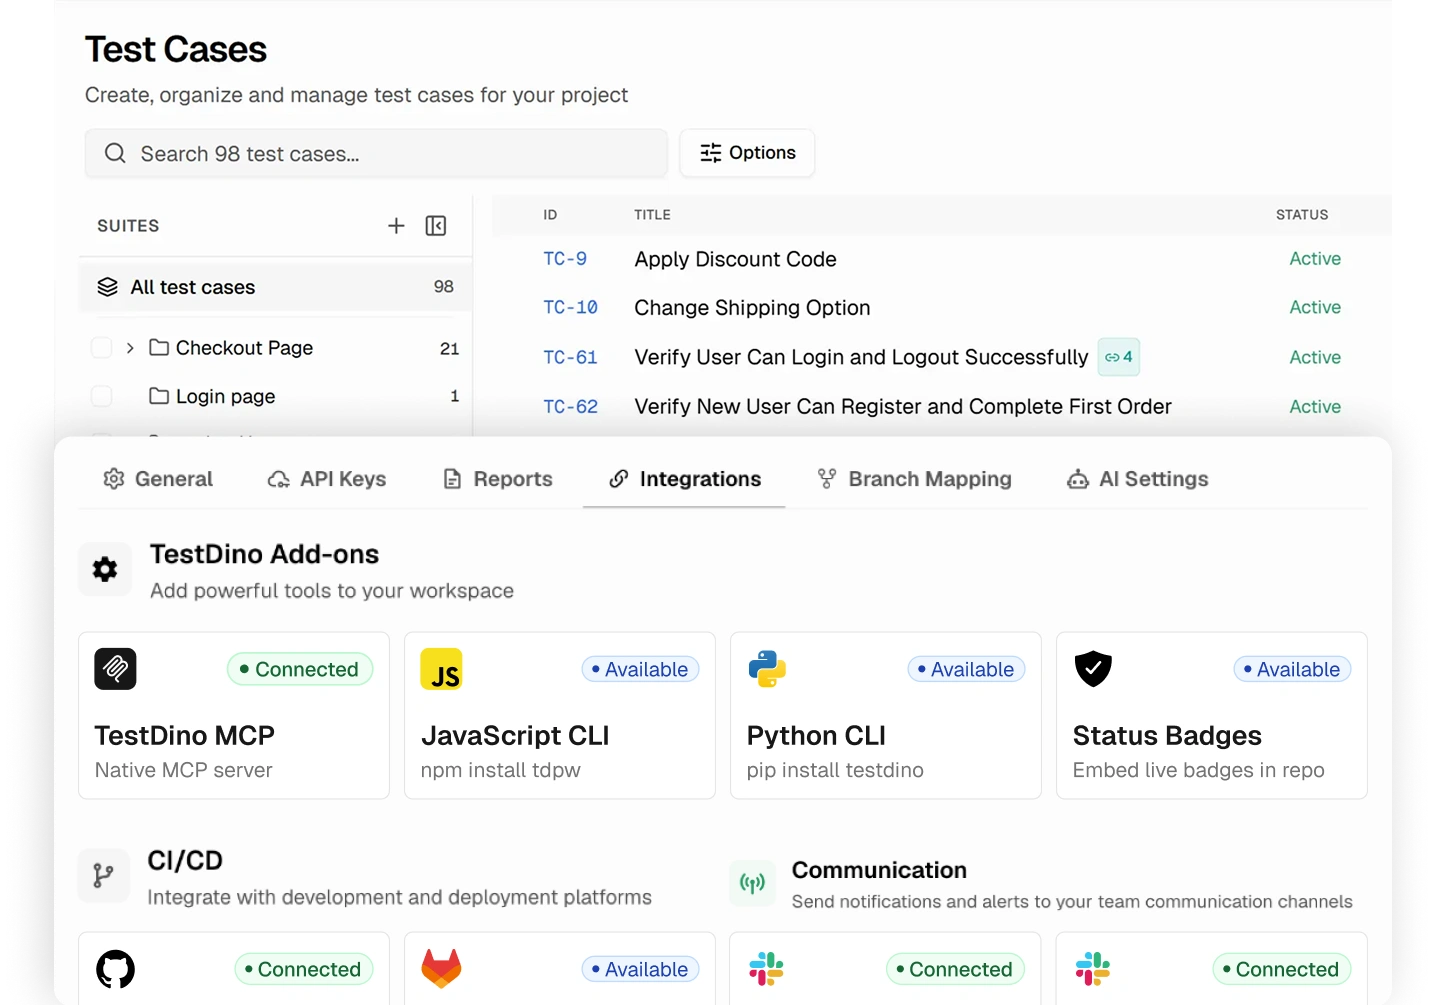
But TestDino doesn't stop at reporting. It also comes with built-in test management designed for how engineering works in 2026. Test cases live alongside their run history, manual runs and exploratory sessions roll up under date-bound releases, and your entire test record (cases, failures, traces, and verdicts) is queryable by Claude Code, Cursor, or any MCP-compatible agent, so your AI coding tools aren't working blind.
CircleCI Test Insights vs TestDino comes down to what happens after a test fails. CircleCI tells you a test failed; TestDino gives you the evidence, classification, and AI agent access to fix it. Here is where TestDino helps, and where CircleCI Test Insights falls short.
Inline trace viewer, screenshots, and video
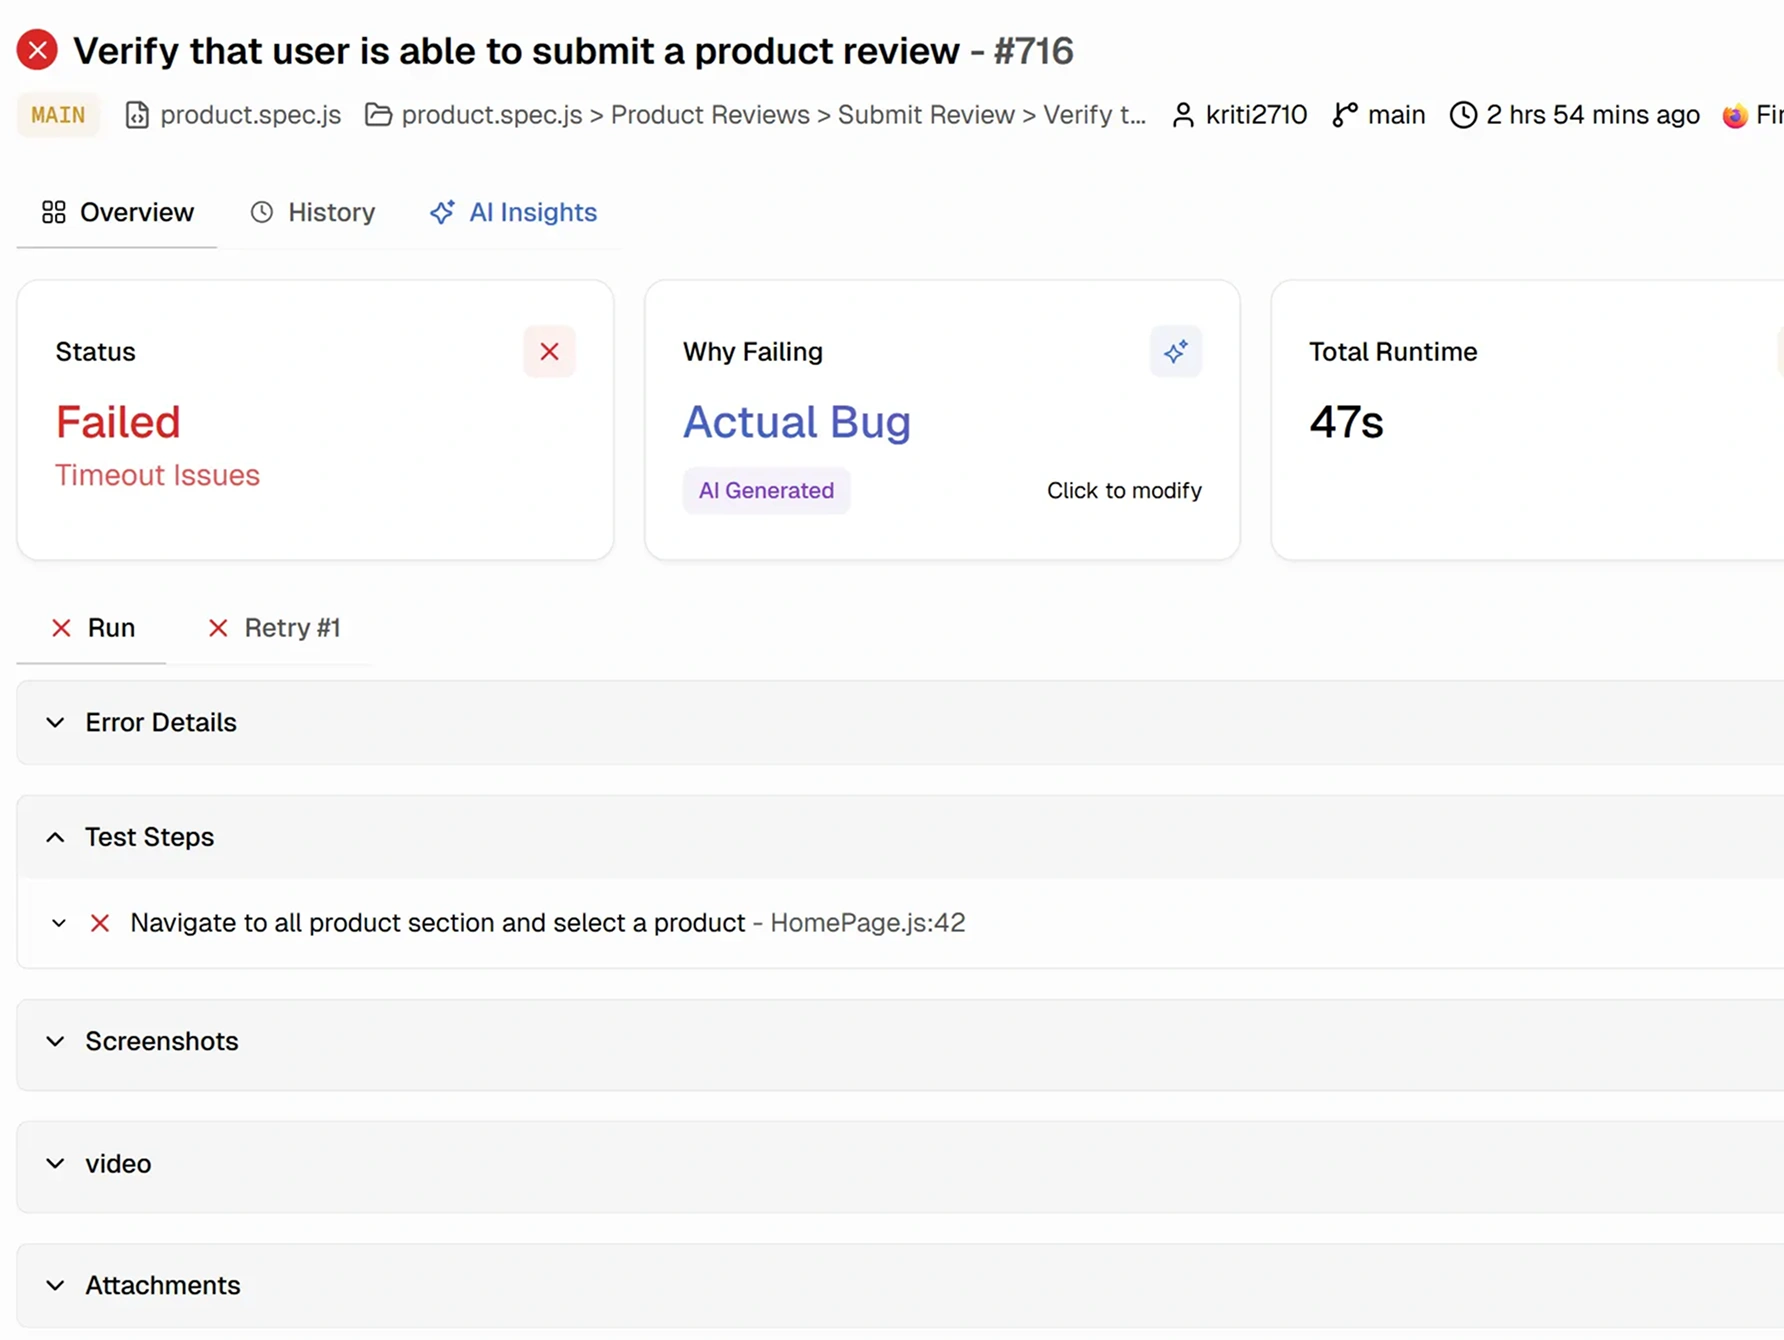
Every failed test in TestDino opens with an embedded Playwright trace viewer showing Actions, Timeline, DOM Snapshots, Network calls, and Console logs. Screenshots and video playback are attached to the specific retry attempt. Failure context lives where the failure happens.
AI failure classification
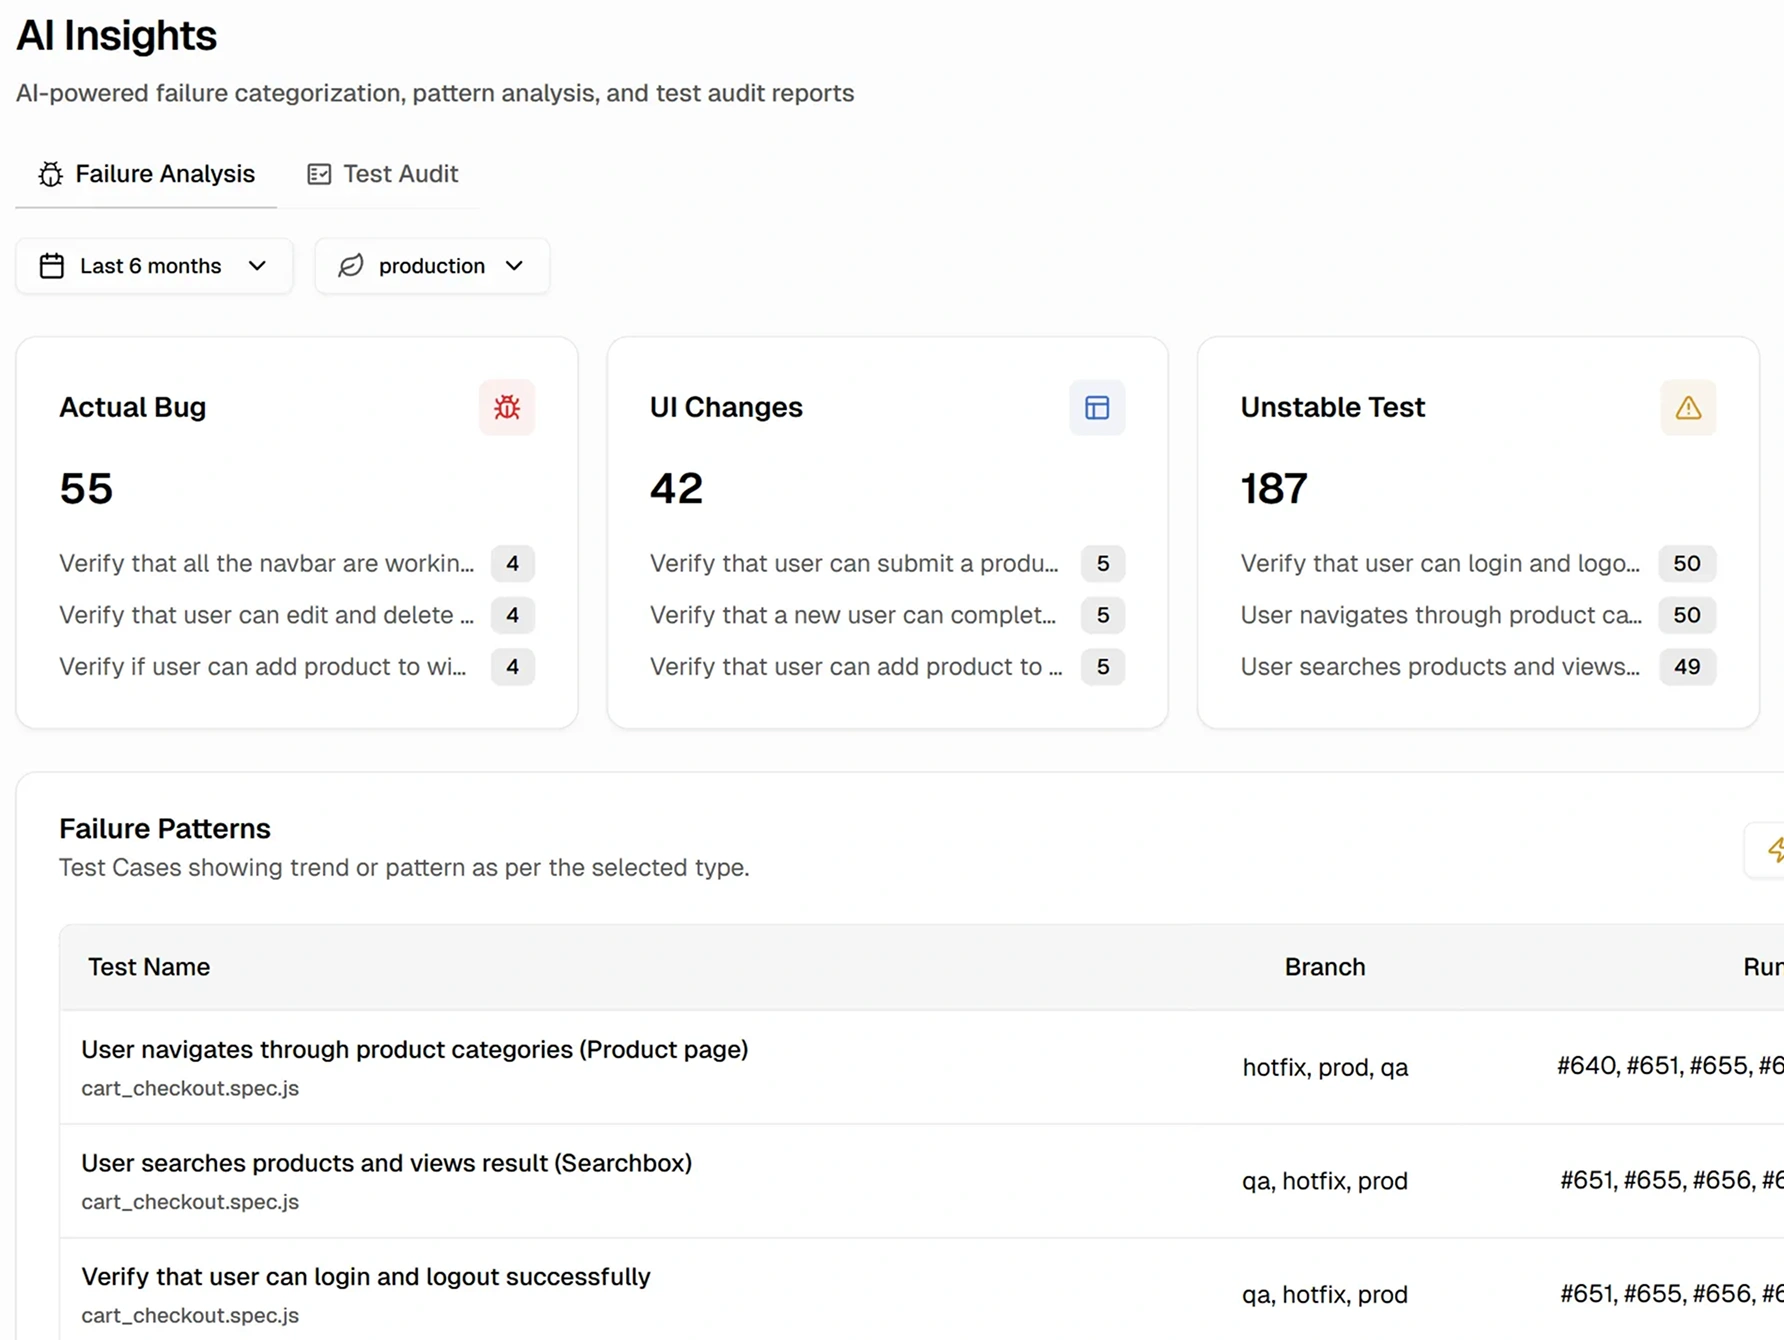
TestDino uses AI to automatically label every failure as a Bug, UI Change, Unstable, or Setup Issue with confidence scores. Triage starts from a prioritized list, rather than reading raw XML stack traces.
MCP-native test access
The TestDino MCP Server gives Cursor, Claude Code, and Claude Desktop a direct line into your Playwright runs. Coding agents can debug failures with debug_testcase, query recent test runs, and update manual cases directly from the editor.
Real-time test result streaming
TestDino streams results live as each test completes, with shard-aware tabs. You do not need to wait for the entire CI job to finish and upload its XML files to know which tests are failing.

Generic XML parsing, no inline traces
CircleCI Test Insights relies on generic JUnit XML. Playwright traces, videos, and screenshots are stored as raw build artifacts via store_artifacts. Due to CORS and service worker restrictions on CircleCI artifact URLs, clicking a trace file usually requires downloading the .zip locally to view it.
No AI intelligence or error grouping
CircleCI provides statistical analytics (pass rates, flakiness, duration) but lacks intelligence. It does not group errors across tests by message, stack trace, or location, and it does not offer AI failure classification or test health audits.
No agent ecosystem
CircleCI Test Insights has no MCP Server. AI coding agents in Cursor or Claude cannot easily query CircleCI test failures or pull trace context through agent workflows to fix broken code.
CI vendor lock-in
Test Insights only works if you are running your pipelines on CircleCI. TestDino is CI-agnostic - it works with CircleCI, GitHub Actions, GitLab CI, Buildkite, Jenkins, or any other provider, keeping your test history portable.
| ||
|---|---|---|
| Pricing (starts at) | $39/month (billed annually) | Varies by plan |
| Best for | Playwright test intelligence & management | General Analytics |
| Playwright integration | Native (trace viewer, error grouping, MCP) | Via reporters |
| Ease of use |  |  |
| One-step CI setup | ||
DASHBOARDS & REPORTING | ||
| Unified Playwright dashboard | ||
| Multi-tab test run detail | Summary, History, AI Insights & more | Dashboards |
| Pull request insights | ||
| Test Explorer | Hierarchy, flat list, or by tag | Basic test listing |
| Real-time streaming | Per-shard/worker | |
| Scheduled PDF reports | Daily/Weekly/Monthly | |
TEST ANALYTICS | ||
| Analytics: trends & patterns | Test runs, test cases & more | Basic trend graphs |
| Code coverage, per-file | Istanbul, run-level | |
| Environment analytics | Pass-rate/flaky by env | |
DEBUGGING & EVIDENCE | ||
| Built-in Playwright trace viewer | ||
| Screenshots & video replay | Embedded | As attachments |
| Console logs (per test) | Node + browser | Via attachment |
| Visual diff comparison | ||
| Smart error grouping | Message/stack/location | |
| Flaky detection | ||
| Playwright Tags and Annotations | Priority, owner, links, metrics | Basic tags |
CI/CD OPTIMIZATION | ||
| Rerun only failed tests | ||
| GitHub CI Checks quality gates | Per-env + mandatory tags | |
| Branch → environment mapping | Exact/regex | |
| Smart rerun history | ||
| Sharded / parallel run support | Per-shard live view | Supported |
| Native CI breadth | GitHub, GitLab, Azure DevOps, TeamCity, Bitbucket, CircleCI, Jenkins | Framework agnostic |
| Self-managed GitLab | ||
TEST MANAGEMENT | ||
| Test case management (suites, ownership) | ||
| Bulk test creation (PRDs/Jira/stories) | Via MCP | |
| Release tracking (releases/cycles/sprints) | ||
| Exploratory/manual sessions | ||
| Import/export test cases | JSON/CSV/ZIP | |
AI & AUTOMATION | ||
| Local MCP (IDE agents) | Cursor/Claude Code/Copilot | |
| Remote MCP (web AI) | ||
| AI test run summary on GitHub PRs | ||
| AI test suite audit (audit score + report) | ||
| AI failure classification | ||
INTEGRATIONS & COLLABORATION | ||
| Bug tracking breadth | Jira, Linear, Asana, monday | Jira/Basic |
| Slack notifications (run summaries) | App + webhooks | |
PLATFORM & SECURITY | ||
| Public API & CLIs | REST API + CLI | REST API |
| Project-level AI controls | Per-feature toggles | |
| Compliance & certifications | ISO 27001, SOC 2 Type II, GDPR | Varies |
PLANS & PRICING | ||
| Plan tiers | Free · Pro · Team · Enterprise | Paid tiers |
| Free executions | 5,000/mo | Limited trial |
| Support | Chat + Slack Connect + Priority email | Standard Support |
| Start for Free | Visit CircleCI | |
Feature-by-feature breakdown showing how each tool handles the areas that matter most to testing teams.
Failed tests display error messages extracted from the JUnit XML. Playwright traces, screenshots, and videos are pushed to a separate "Artifacts" tab. Because CircleCI artifact URLs have strict CORS policies, you cannot view Playwright traces inline; you must download the .zip file and manually load it into a local trace viewer.
CircleCI provides statistical tracking for flaky tests and slow tests, but there is no AI intelligence. There is no failure categorization, no pattern analysis across error messages, and no contextual health scores.
debug_testcase, and rank flaky tests through list_testcase from the IDE.There is no MCP Server for CircleCI Test Insights. Your AI coding agents cannot natively query the dashboard to understand why a build failed or pull in the necessary trace evidence to write a fix.
Test management is not part of CircleCI. It is strictly a CI/CD platform and reporting layer for automated tests. There is no built-in manual test management or deep Jira issue pre-filling for specific test failures.
Purpose-built capabilities that help Playwright teams ship faster and debug smarter.
Watch test results stream as each test completes. Shard-aware, no refresh needed.
Every failure is categorized as a Bug, UI Change, Setup Issue, or Flaky with a confidence score.
Works across any CI/CD provider, so your test data isn't locked into your CI vendor.
Where each platform leads, and where it falls short.
CircleCI Test Insights is a built-in dashboard for CircleCI users that parses generic JUnit XML to track success rates, test duration, and flakiness.
Built-in to CI
No extra setup required if you are already using CircleCI. Just output JUnit XML and use the store_test_results step.
CI Resource Tracking
Closely ties test performance (like duration) to CI compute credit usage, helping teams optimize infrastructure costs.
Branch-Level Analytics
Easily compare test performance across different development branches to understand how changes impact test outcomes across the codebase.
TestDino is a Playwright-native AI test intelligence platform that brings inline trace viewing, AI classification, and failure analytics into one focused reporter.
AI-Powered Failure Classification
Every failure is tagged as Bug, UI Change, Unstable, or Miscellaneous. Triage starts at the top of a prioritized list, not the middle of a log.
Inline Playwright Debugging
Trace viewer, screenshots, video, and console logs all open inline on the failed test. No artifact downloads or CORS issues.
Cross-Run Flakiness Detection
Retry analysis plus pattern detection across run history. Flakes get caught even when CI retries are not enabled.
TestDino MCP Server
It lets AI coding agents query Playwright test runs, debug failures with full retry and artifact context, detect flaky tests, and manage manual test cases and suites, all from the editor.
Verified reviews from QA and engineering teams running Playwright in production.
Analyzing failed test runs in CI used to take a lot of time. TestDino gives me a centralized dashboard for Playwright results with screenshots, logs, and failure trends. The automatic grouping and categorization of failures means I triage from patterns instead of reading each CI log.
Lead Software Engineer
I monitor everything my tests do, from the full list of tests to detailed error screenshots. The GitHub integration is smooth, so commit hashes, CI runs, and HTML reports open straight from the dashboard. I use TestDino almost every day, and it has improved the quality of our automation code.
Lead QA Automation Engineer
TestDino shows us which tests are slowest, most flaky, and fail most often, which helps us prioritize improvements. We inherited an existing project, and it gave us the insights to take ownership of the suite and improve its reliability.
Senior QA Engineer
The interface is clean and easy to navigate, so getting started with test creation is straightforward. I like having both visual workflows and code-based options, and the dashboard makes it easy to review results and understand failures quickly.
QA Specialist
Support has been excellent, and the setup was straightforward. The interface is intuitive and gives a clear overview, and the pricing is competitive. The team is active, consistently shipping new features and improvements.
CTO & Co-Founder
TestDino is easy to use and delivers valuable analytics out of the box. The dashboard is clean and intuitive, and the initial setup was not difficult at all. I would rate it a nine for recommending it to colleagues.
Senior Quality Assurance Manager
Enterprise-grade security so your team can focus on shipping instead of worrying about data.
Secure authentication, role-based access control, and data encryption safeguard your test data in transit and at rest.
Persistent analytics with historical tracking deliver reliable insights about test performance, coverage, and release readiness.
Automated backups and retention policies maintain a complete history of test data. Project-scoped access prevents unauthorized changes.
CircleCI Test Insights is included in CircleCI's platform pricing, though artifact storage incurs extra costs. TestDino offers flat monthly pricing with a managed dashboard, AI, and MCP included.
CircleCI Test Insights is included in the platform's standard tiers, but teams pay for the underlying compute and storage.
Parses JUnit XML files
Flaky test detection
Slowest test tracking
Branch-level analytics
For dev teams shipping to production. Flat pricing with managed dashboard, AI, and MCP included.
25,000 test executions per month
Up to 3 users
90-day data retention
AI failure classification with confidence scores
MCP Server with test case writes
Embedded trace viewer and debugging features
PR view and CI/CD optimization
Integrations with Jira, Linear, Asana, Slack
Stop wasting time on
flaky tests
No. CircleCI Test Insights parses XML data. Playwright traces, screenshots, and videos must be saved using the store_artifacts step. Because CircleCI's artifact hosting uses restrictive CORS policies, you typically cannot open these traces in a browser via trace.playwright.dev. You must download the .zip file locally to view it. TestDino solves this by rendering the trace viewer natively inline.
Side-by-side comparisons of features, pricing, and integrations to help you pick the right testing tool.