Xray helped many QA teams bring structure to test management inside Jira. Test cases, executions, and defects live as Jira issues.
But the model has a ceiling. Pricing is tiered by your total Jira user count rather than your QA team size, so a 200-person Jira instance pays at the 200-user tier even when only 10 people run tests. Reporting is Jira-centric and constrained by Jira's dashboard framework, and the platform stops at execution tracking. There is no AI failure classification, Playwright trace viewer, flaky test detection, or CI/CD optimization features.
The gap widens once AI enters your workflow. Xray has no MCP server, so your AI assistant can't reach your test data. TestDino ships the TestDino MCP Server, which connects AI assistants directly to your workspace. From your IDE or a chat window, you can pull recent runs, identify flaky tests across executions, and more. Inside Xray, the same triage is a manual walk through Jira.
Modern teams want platforms that combine test management with intelligent reporting, so they can move faster without sacrificing release confidence. Here are the 8 best Xray alternatives to consider in 2026.
Best Xray Alternatives: How to Choose the Right Tool
We evaluated each tool based on test case management depth, automated test reporting, AI failure analysis, flaky test detection, Playwright support, CI/CD integration, and pricing transparency.
How to Compare Xray Alternatives
Here is a quick comparison of top alternatives to Xray that can help you identify your preferred test management tool:
TestDino |  Xray |  ReportPortal |  PractiTest |  Qase | |
|---|---|---|---|---|---|
| PricingLowest paid plan, per the listed billing terms. | $39/month (billed annually) | $10/mo (starting) | $599/month (SaaS) | $47/user/month (Team, 5-user min) | $0/mo (Free up to 3 users) or $24/user/mo |
| Best for | Playwright test intelligence & management | Jira-native test management & requirement traceability | Reporting with history and clustering | End-to-end QA / test management | AI-assisted test management for modern engineering teams |
| Playwright integration | Native (trace viewer, error grouping, MCP) | Community playwright-xray reporter | Via agents | Via API / Firecracker | Official reporter |
| Ease of use |  |  | |  | |
| One-step CI setup | One tdpw upload line | CLI + REST API | Docker Compose setup | Via Firecracker / API | Reporter package + token |
Dashboards & Reporting | |||||
| Unified Playwright dashboard | Custom widgets | Unified runs view | |||
| Multi-tab test run detail view | Summary, History, AI Insights & more | Jira-issue tabs | Launch-level view | ||
| Pull request insightsSee test results and history for each pull request. | |||||
| Test ExplorerBrowse tests as a hierarchy, a flat list, or by tag. | Launch tree | ||||
| Real-time streaming | Per-shard/worker | ||||
| Scheduled PDF reportsGet report PDFs emailed on a set schedule. | Daily/Weekly/Monthly | ||||
Test Analytics | |||||
| Analytics: trends & patterns | Widget-based | ||||
| Code coverage, per-file | Istanbul, run-level | ||||
| Environment analytics | Pass-rate/flaky by env | Test environments field | Via attributes | Via custom fields | |
Debugging & Evidence | |||||
| Built-in Playwright trace viewer | |||||
| Screenshots & video replay | Embedded | Attachments only | Via attachments | Attachments, no embedded replay | |
| Console logs | Node + browser | Via attachments | If attached | Via attachments | Via attachments |
| Visual diff comparison | |||||
| Smart error grouping | Message/stack/location | Pattern matching | SmartFox pattern analysis | Defect linking | |
| Flaky detectionSpot tests that pass and fail inconsistently, with a stability score. | Via PW reporter flag | Requires config | |||
| Playwright tags & annotations | Priority/owner/links/metrics | Custom attributes | |||
CI/CD Optimization | |||||
| Rerun only failed tests | By status filter | Via API | |||
| GitHub CI Checks quality gates | Per-env + mandatory tags | Via API | Via webhooks | ||
| Branch → environment mappingMatch each Git branch to the environment it runs against. | Exact/regex | Via custom fields | Environment field per run | ||
| Smart rerun historyTrack reruns tied to each branch and commit. | |||||
| Sharded / parallel run support | Per-shard live view | Via reporter merge | Parallel launches | Consumes results | |
| Native CI breadth | GitHub, GitLab, Azure DevOps, TeamCity, Bitbucket, CircleCI, Jenkins | Jenkins, GitHub Actions, GitLab CI, Azure DevOps, CircleCI | Agents/plugins | Jenkins, GitHub Actions, CircleCI, GitLab, Azure DevOps | Jenkins, GitHub Actions, GitLab CI, Bitbucket, Azure Pipelines |
| Self-managed GitLab | |||||
Test Management | |||||
| Test case management | |||||
| Bulk test creationGenerate many test cases at once from PRDs, Jira, or user stories. | via MCP | AI test design (Advanced+) | |||
| Release trackingGroup test results by release, cycle, or sprint. | |||||
| Exploratory / manual sessions | |||||
| Import / export test cases | JSON/CSV/ZIP | Via API | |||
AI & Automation | |||||
| Local MCPLet AI coding assistants in your editor query test data directly. | Cursor/Claude Code/Copilot | ||||
| Remote MCPLet web-based AI tools query your test data. | |||||
| AI test run summary on GitHub PRs | |||||
| AI test suite auditAI scores your test suite and gives a downloadable report. | |||||
| AI failure classification | ML auto-analysis | ||||
Integrations & Collaboration | |||||
| Bug tracking breadth | Jira, Linear, Asana, monday | Jira (native, deep) | Jira, Rally | Jira, Azure DevOps, etc. | Major CI providers |
| Slack notifications | App + webhooks | ||||
Platform & Security | |||||
| Public API & CLIs | REST + tdpw / testdino | REST API | REST API | REST API + Firecracker CLI | |
| Project-level AI controls | Per-feature toggles | Edition-gated | Via permissions | AIDEN credits per workspace | |
| Compliance & certifications | ISO 27001, SOC 2 Type II, GDPR | SOC 2, ISO 27001, GDPR | Self-managed (your infra) | SOC 2, ISO 27001 | SOC 2, SOC 3, ISO 27001, GDPR |
Plans & Pricing | |||||
| Plan tiers | Free · Pro $39 · Team $79 · Enterprise | Standard (from $10/mo) · Enterprise | OSS free (self-hosted) · SaaS $599 · Enterprise | Team $47/user (5 min) · Corporate (custom, 10 min) | Free · Startup $24/user · Business · Enterprise |
| Free executions | 5,000/mo | Free trial (30 days) | Unlimited (self-host) | 14-day trial | Free: 3 users, 25k API results/mo |
| Support | Chat + Slack Connect + Priority email | Email · 24/7 (Enterprise) | Community / Paid | Standard (Team) · Premium onboarding (Corp) | Email (Free/Startup) · Premium (Business) · CSM (Ent) |
| Try for free | Learn more | Learn more | Learn more | Learn more | |
Best Xray Competitors for Modern Test Automation
Here are the 8 best alternatives to Xray for teams that want more from their test management platform:
1. TestDino
$49
/monthBest for:
Playwright-first teams that need test management and automated test reporting in one platform, without per-user or per-Jira-user pricing eating into their budget.
Platform Type:
Test management, reporting, dashboards, and CI observability platform for Playwright
Integrations with:
GitHub Actions, GitLab CI, Azure DevOps, TeamCity, Jira, Linear, Asana, monday, Slack
Key Features:
 Test case management with suites up to 6 levels deep, ownership, and custom fields
- AI failure classification into 4 categories (Actual Bug, UI Change, Unstable Test, Miscellaneous)
- Built-in Playwright trace viewer with DOM snapshots and network logs
- Error grouping by message and stack trace
- GitHub CI Checks as merge quality gates
- Rerun only failed tests to cut CI pipeline time
- MCP Server for AI agent queries from your IDE
- Flaky test detection with root cause classification
- AI summaries posted to GitHub commits and GitLab MRs
- Real-time results streaming via WebSocket
- Code coverage per file breakdown

Pros
- Combines test management and automated test reporting on the same platform
- No per-user pricing, flat monthly rate per workspace
- Playwright-native with under 10-minute setup
- AI failure classification, trace viewer, and error grouping built in
- Broad CI/CD support: GitHub Actions, GitLab CI, Azure DevOps, TeamCity
- 1-click bug filing into Jira, Linear, Asana, or monday

Cons
- Purpose-built for Playwright (multi-framework support on the roadmap)
First Hand Experience
Teams using Jira-native test management like Xray know this pattern: test cases live as Jira issues, results map back to requirements, and the traceability matrix looks clean. The management side works, but when you need failure intelligence, debugging evidence, or CI/CD optimization on top of it, you end up stitching together separate tools.
TestDino eliminates the multi-tool problem. Test case management and automated test reporting live on the same platform. Manual test cases sit in suites up to 6 levels deep with ownership, custom fields, and version history. Playwright results flow in from your first CI run with dashboards, analytics, and AI failure classification working from day one. No reporter configuration, no adapter maintenance.
The Test Explorer shows both manual and automated tests side by side, sortable by flaky rate, tags, and coverage status. Where Xray keeps everything inside Jira's dashboard limits, TestDino unifies management and reporting on a purpose-built platform.
Debugging That Saves You from Re-running Locally
Each failed test in TestDino comes with screenshots, video, browser console logs, and a trace you can step through action by action. Available right after the CI run finishes.
AI Insights classifies each failure as Actual Bug, UI Change, Unstable Test, or Miscellaneous. Bug filing is 1-click into Jira, Linear, Asana, or monday, pre-filled with error details, stack trace, failure history, and links to the run and CI job.
CI/CD Speed and Merge Safety
Rerun failed tests re-executes only failures, not the full suite. Works across sharded runs and different CI runners.
GitHub CI Checks adds quality gates to your PRs. Set a minimum pass rate, mark critical tags as mandatory, and configure different rules per environment. AI-generated summaries are posted to GitHub commits and GitLab merge requests with pass/fail/flaky counts.
Flaky Test Detection That Tells You Why
Flaky test detection classifies unstable tests by root cause: timing-related, environment-dependent, network-dependent, or assertion-intermittent. Each test gets a stability percentage, and you can compare flaky rates across environments to spot infrastructure problems.
Real-Time Streaming and Scheduled Reports
Results appear on the dashboard as each test completes via real-time streaming, not after the full suite finishes. Automated PDF reports deliver test health summaries on daily, weekly, or monthly schedules. Slack notifications send run summaries filtered by environment and branch.
MCP Server for AI-Assisted Test Management
The MCP Server connects your AI assistant (Cursor, Claude Code, Copilot) to your test data. List test runs, pull debugging context, perform root cause analysis, create and manage manual test cases, organize test suites, track releases, and execute manual test runs through natural language. It covers both automated debugging and test management without switching tools.
Pricing & Value
Pricing is per workspace, not per user. A 10-person team pays $39/month on the Pro plan, compared to an Xray bill that scales with your entire Jira instance. Pricing may vary. Check the pricing page for the latest details.
Final Verdict
TestDino is the most complete Xray alternative for Playwright teams. Where Xray ties test management to Jira and requires separate tools for failure analysis and CI/CD optimization, TestDino delivers test management, AI failure classification, trace viewing, flaky detection, and CI/CD quality gates on one platform at a flat monthly rate.
It replaces the need to pair Xray with a separate reporting tool. At $39/month billed annually for an entire workspace, it gives teams test intelligence and management together instead of management alone.
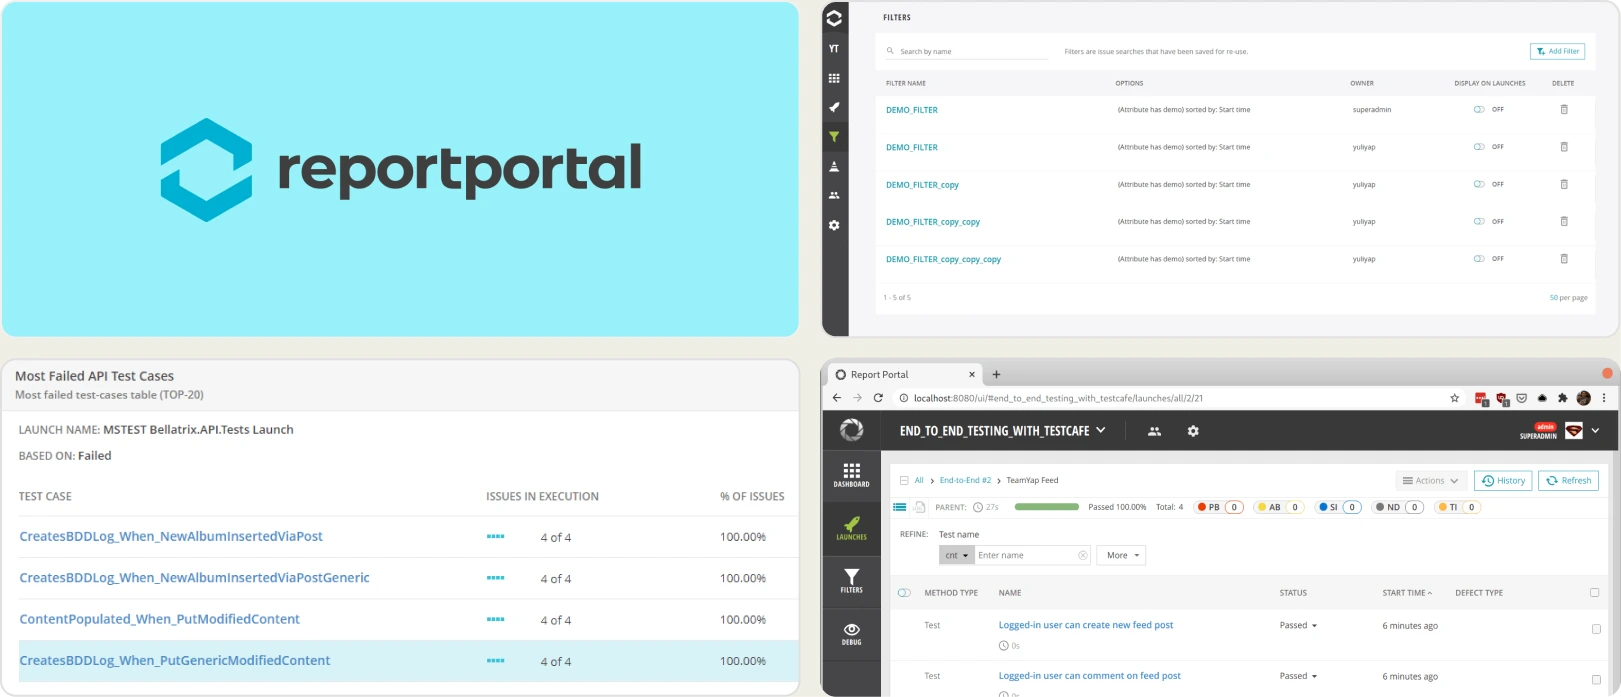
2. ReportPortal
Best for:
Teams that want open-source flexibility and full control over hosting, upgrades, and data, with engineering time to allocate for setup and maintenance.
Platform Type:
Open-source test reporting platform (self-hosted or SaaS)
Integrations with:
Jenkins, GitHub, GitLab, Jira, Slack, and other CI/CD tools
Key Features:
- Real-time launch tracking and execution visibility
- Failure clustering and automated grouping of similar errors
- Historical flaky detection using trend analysis
- Customizable dashboards with widgets and filters
- Query-based data exploration for deep analysis
- Multi-framework aggregation in one interface
Pros
- Free open-source core available
- Broad framework compatibility
- High customization flexibility
- Suitable for complex, multi-framework environments
- Community and enterprise support options
Cons
- Requires hosting, scaling, and infrastructure management
- Limited AI-based failure reasoning compared to modern SaaS tools
- UI may feel dated for non-technical stakeholders
- Ongoing engineering effort needed for upgrades
- No native test case management layer
First Hand Experience
ReportPortal offers strong flexibility and transparency for automation teams. It aggregates results across frameworks and uses ML-based pattern matching to cluster recurring failures. The trade-off is infrastructure: setup requires Docker Compose, database configuration, and ongoing maintenance, and there is no native test case management to pair with the reporting. Teams that invest in configuration get meaningful reporting depth; teams that want turnkey intelligence look elsewhere.
Pricing & Value
The open-source edition is free (self-hosted). Managed SaaS starts at $599/month for the Startup tier, with Business and Enterprise plans above it. Total cost depends heavily on infrastructure, hosting, and maintenance effort.
Final Verdict
ReportPortal is well-suited for organizations prioritizing customization and open-source control. It works best when technical resources are available to manage setup and scaling. For turnkey automation intelligence and built-in test management, SaaS-focused platforms provide faster time to value.
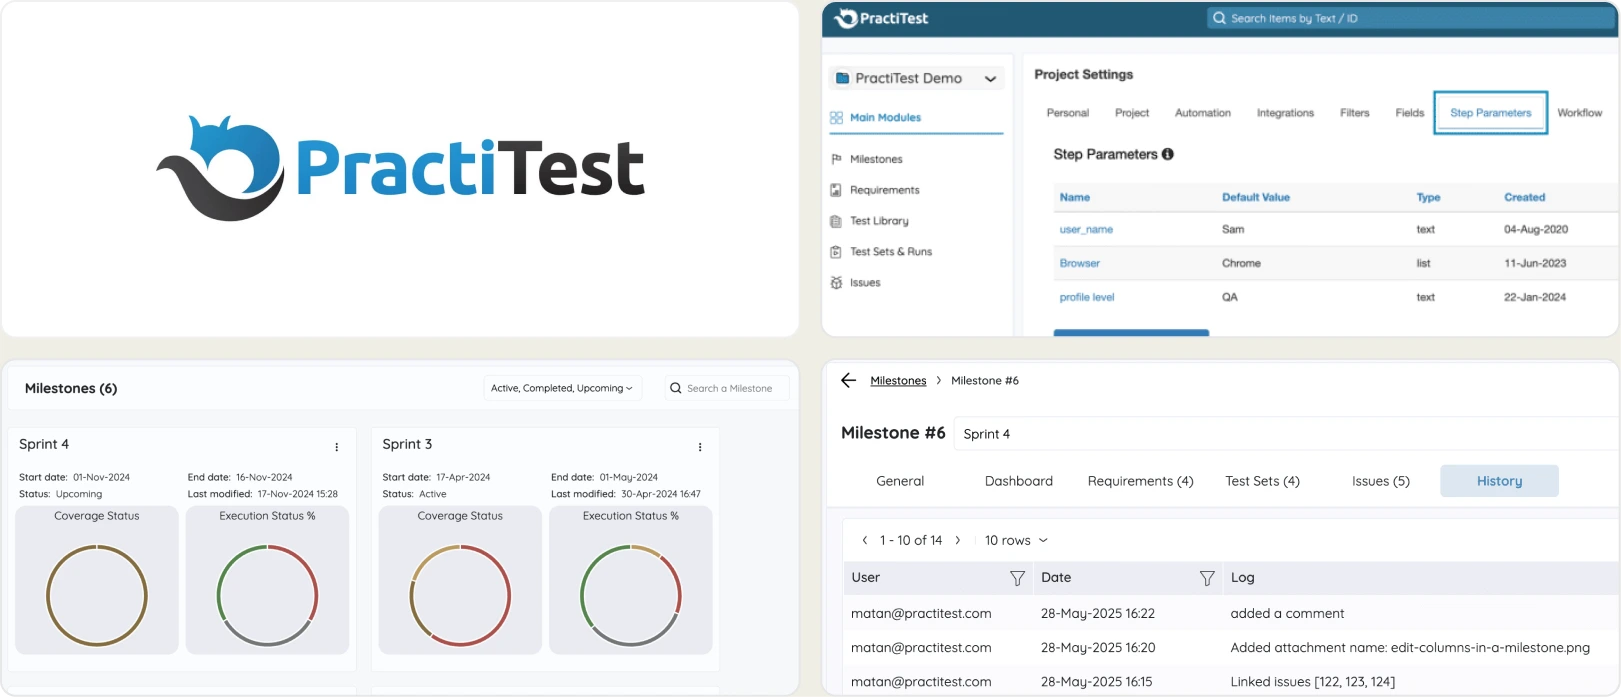
3. PractiTest
Best for:
Enterprise QA teams in regulated industries that need compliance features and requirement traceability, though the platform comes with a steep price tag and a dated experience.
Platform Type:
Enterprise test management and QA platform
Integrations with:
Jira, Azure DevOps, GitHub, GitLab, Jenkins, Slack, Selenium
Key Features:
- End-to-end test management (requirements, test cases, runs, defects)
- Customizable dashboards and reporting with filters
- Requirements-to-defect traceability matrix for compliance
- Custom fields, custom views, and configurable workflows
- REST API for automation integration
- Compliance features for FDA, ISO, and regulated industries
Pros
- Compliance and audit trail features for regulated industries
- Strong traceability between requirements, tests, and defects
- Configurable custom fields, filters, and views
- Scales well for large teams and complex release cycles
- Strong cross-project visibility with aggregated analytics
Cons
- $47+/user/month with a 5-user minimum, one of the most expensive in this comparison
- Dated UI with a steep learning curve
- No AI failure classification, real-time streaming, or CI/CD optimization
- Flaky detection is basic rather than pattern-based
- Cloud-only with no self-hosted option by default
First Hand Experience
PractiTest positions itself as an enterprise QA platform with compliance features for regulated industries. It offers requirements traceability, configurable workflows, and audit trails that map to standards like FDA and ISO, and the customization options are extensive.
The trade-off is cost and complexity: per-user pricing with a 5-user minimum makes it one of the most expensive tools here, the UI requires training, and there is no AI failure classification, Playwright trace viewer, or rerun-only-failed workflow. PractiTest solves the compliance problem but leaves the testing intelligence gap wide open.
Pricing & Value
Team plan starts at ~$47/user/month with a 5-user minimum. Corporate pricing is custom with a 10-user minimum. No free tier, 14-day trial only. It provides strong value for organizations focused on lifecycle management, governance, and compliance rather than advanced automation analytics.
Final Verdict
PractiTest addresses compliance and audit requirements for regulated industries, but the high cost, dated interface, and absence of failure intelligence or CI/CD features limit its value for teams focused on test velocity and automation. Teams paying $47+/user/month should expect more than test case management without AI-driven insights.
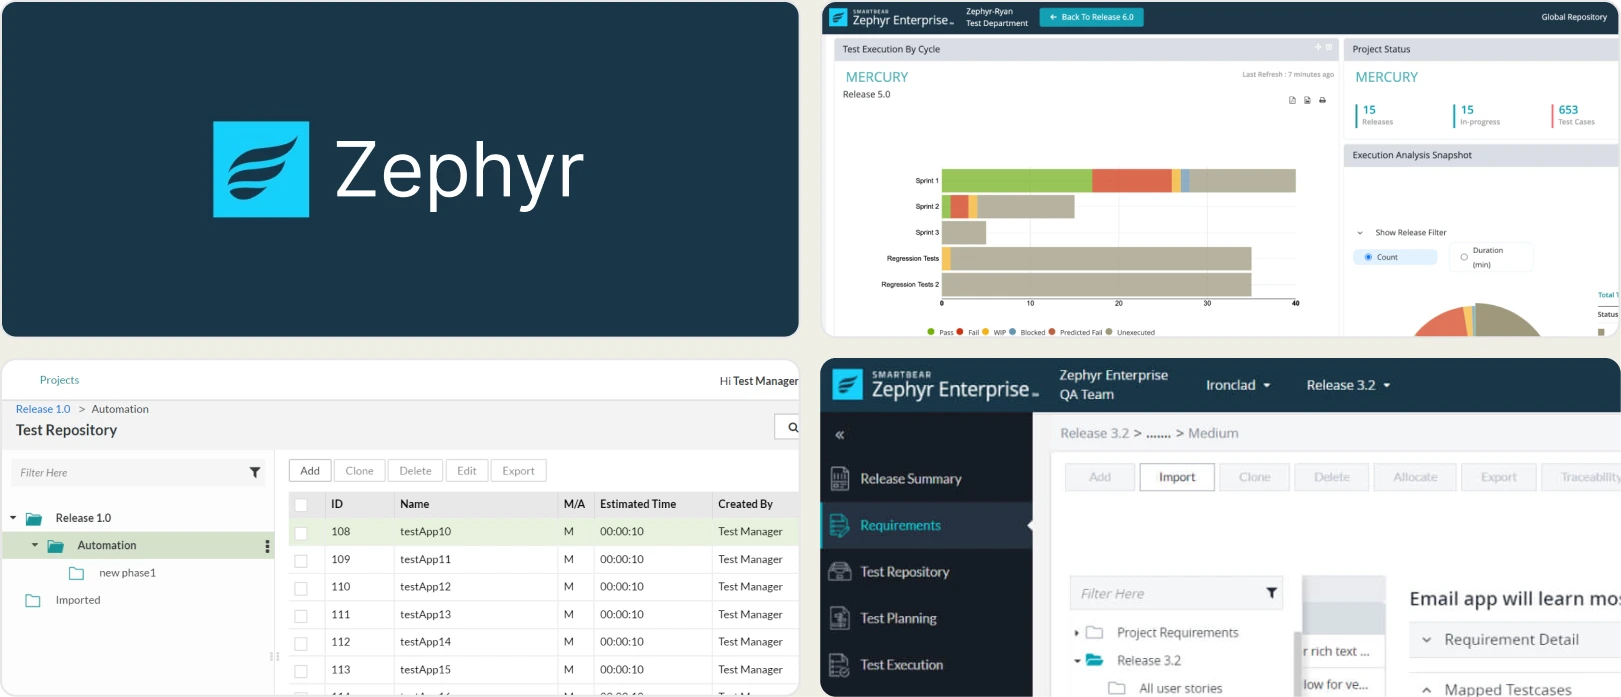
4. Zephyr
Best for:
Agile teams that need structured test case management tightly integrated with Jira for execution tracking and release visibility, across hybrid manual and automated workflows.
Platform Type:
Jira-native test management app
Integrations with:
Jira (native), GitHub, GitLab, Jenkins, CircleCI, CI/CD systems
Key Features:
- Test case management for organizing scenarios and suites
- Test cycles and execution tracking with historical results
- Native Jira integration for issue linking and defect tracking
- Support for manual, automated, and exploratory testing workflows
- Customizable dashboards and test metrics within Jira
- Requirements traceability across test cases and defects
- CI/CD integrations to sync automated test results
Pros
- Strong test organization and execution tracking
- Tight Jira integration for unified workflows
- Supports hybrid testing approaches
- Custom dashboards and reporting for team insights
- Scales well for Agile teams already in Jira
Cons
- Limited AI-powered failure insights compared to modern automation tools
- Basic flaky detection without deep pattern analysis
- Minimal CI/CD optimization features like rerun-only-failed workflows
- Reporting focuses on execution results, not root-cause diagnostics
- Pricing tied to total Jira user count, not QA team size
First Hand Experience
Zephyr feels like a natural choice for teams already operating in Jira-driven Agile workflows, offering a clear structure for planning and execution. Test cases, cycles, and defects sit alongside Jira issues, which avoids context switching.
As automation scales, though, reporting and analytics feel surface-level compared to automation-intelligence platforms, and the Jira-user-tiered pricing means you pay for your whole instance rather than your QA team. There is no AI failure classification, trace viewer, or rerun-only-failed workflow.
Pricing & Value
Zephyr Squad starts around $10/month, with pricing tiered by your total Jira user count and a higher tier (~$30/mo) adding automation and parallel testing. A 30-day free trial is available. It delivers solid value for organizing and tracking tests but may need complementary tools for advanced automation insights.
Final Verdict
Zephyr is a reliable choice for teams prioritizing structured test management and Agile Jira integration. Teams looking for AI-driven failure analysis, flaky detection, and CI-first optimization may benefit more from automation-intelligence platforms built specifically for modern CI/CD workflows.
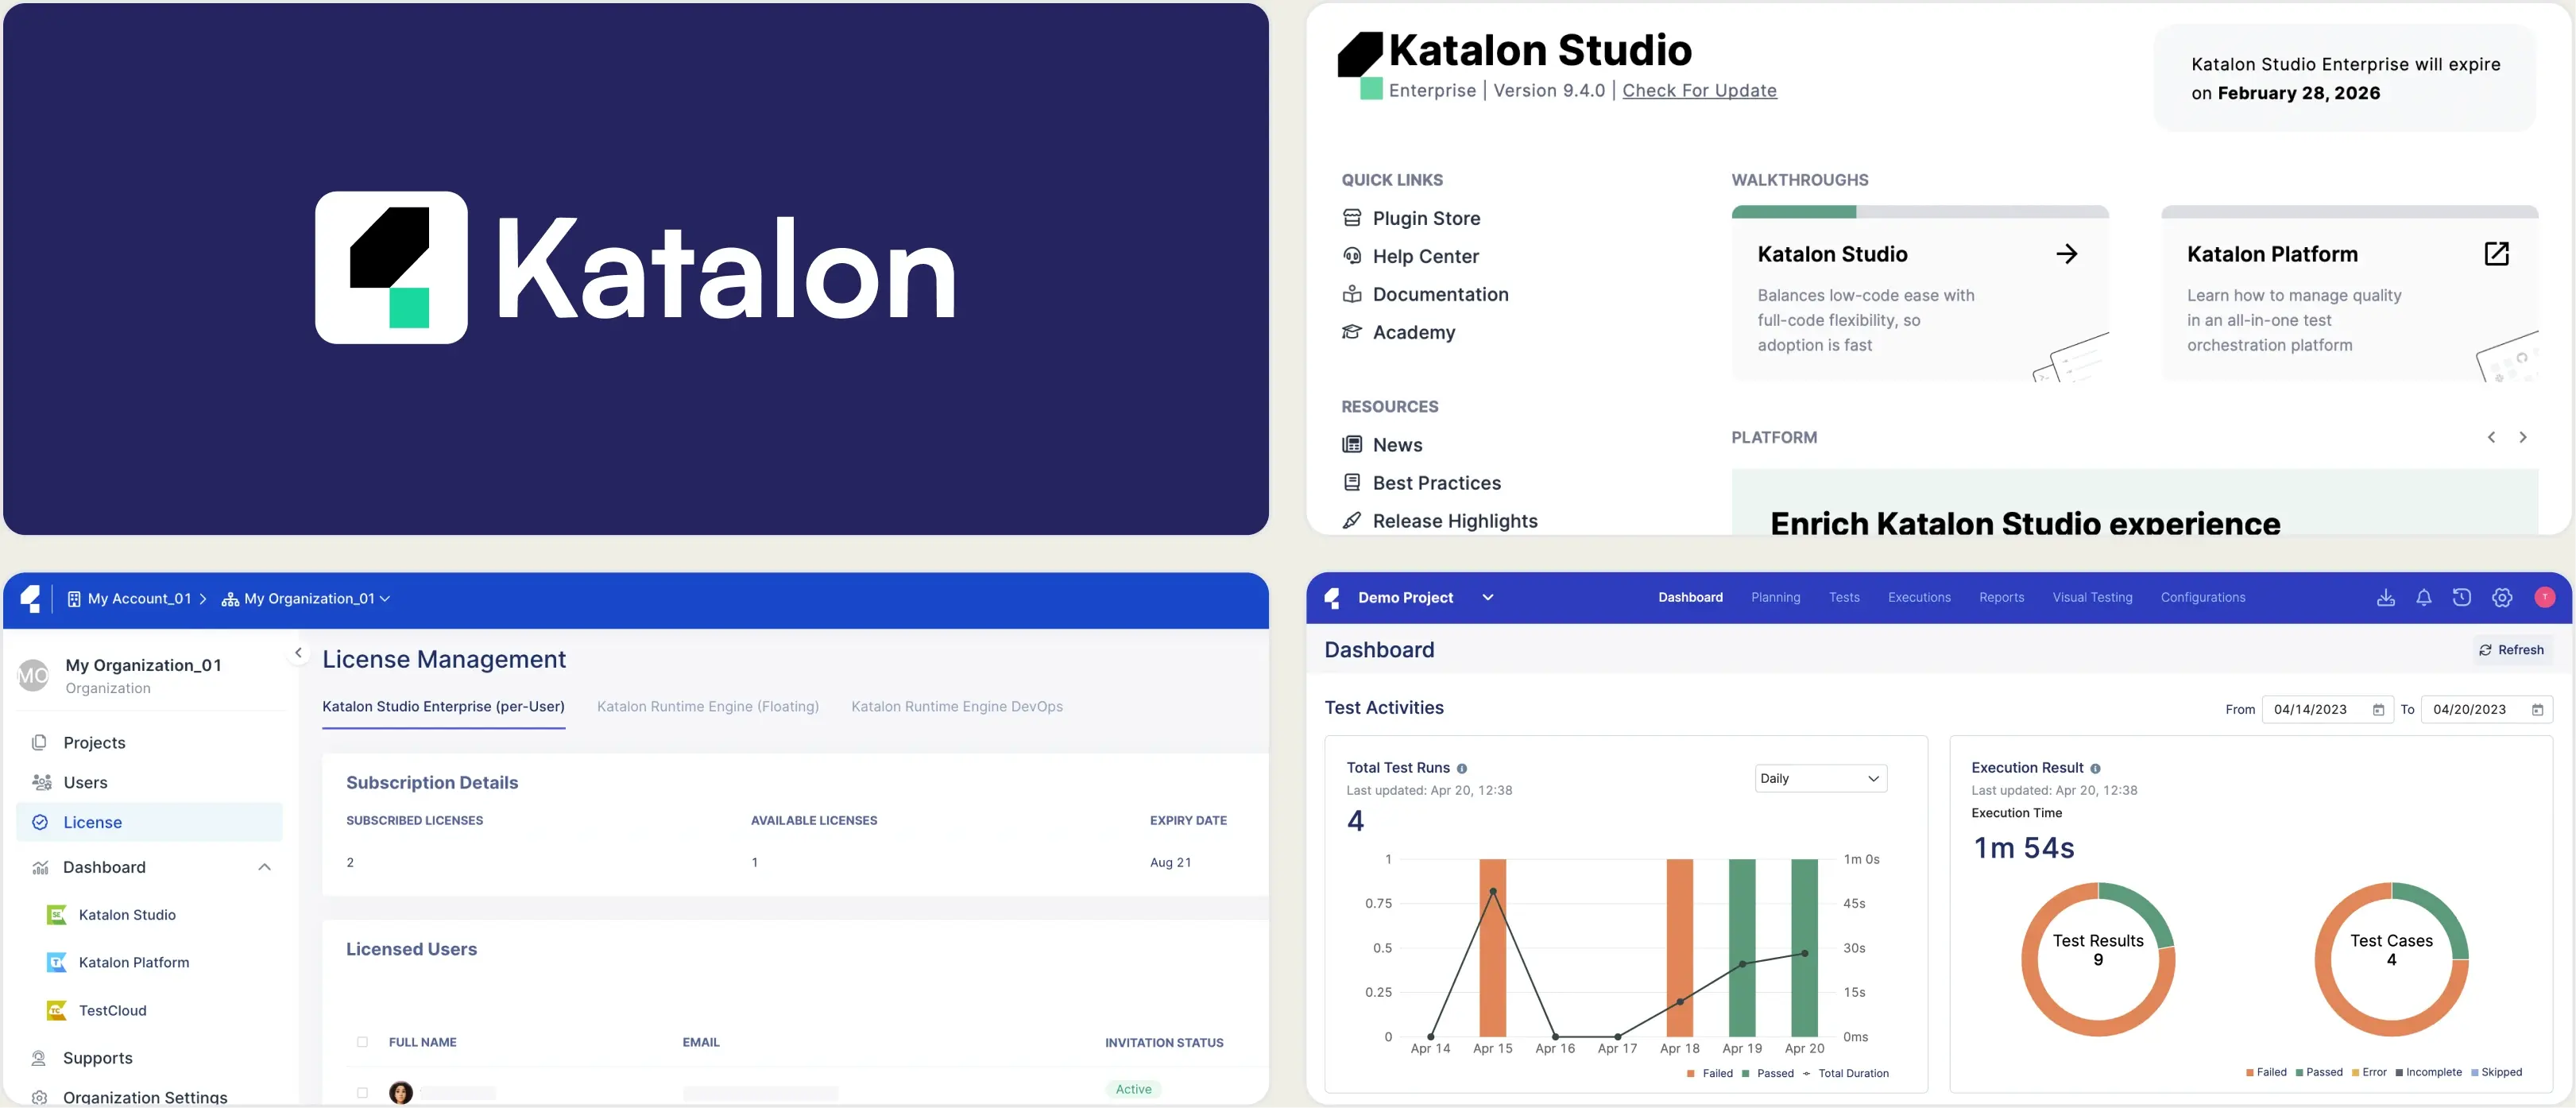
5. Katalon True Platform
Best for:
Teams looking for centralized test orchestration, execution visibility, and analytics within the Katalon ecosystem, across hybrid manual and automated workflows.
Platform Type:
Web-based test management and analytics platform
Integrations with:
Jira, GitHub, GitLab, Jenkins, CI/CD systems
Key Features:
- Centralized test execution management across projects
- Test result analytics with historical execution tracking
- CI/CD pipeline integration for automated test reporting
- Dashboard views for team performance and release visibility
- Requirement and defect linkage for traceability
- Manual and automated testing workflow support
- Custom reporting widgets and filters
Pros
- Unified platform for test orchestration and reporting
- Easy onboarding for teams already using Katalon tools
- Good balance between management and analytics
- CI/CD integrations simplify automation execution tracking
- Suitable for mixed testing environments
Cons
- Advanced AI-driven failure analysis is limited compared to dedicated automation-intelligence tools
- Flaky detection shows a flaky-tests view but no stability percentage
- Best experience is within the Katalon ecosystem
- CI/CD optimization features are not as advanced as specialized platforms
- No built-in Playwright trace viewer
First Hand Experience
Katalon True Platform provides a clean, structured environment for tracking test executions and maintaining visibility across releases. It performs well for teams seeking a unified platform, and its SmartFox root-cause analysis surfaces patterns across runs.
But advanced automation analytics and deep debugging insights are less emphasized, and the experience is strongest when you are already invested in the Katalon ecosystem. Teams that need a Playwright trace viewer or AI failure classification will find it pointing back toward dedicated platforms.
Pricing & Value
Katalon True Platform follows tiered pricing based on users, test executions, and enterprise features, with a free trial available. It delivers solid value for organizations already invested in Katalon, though teams seeking deeper automation intelligence may evaluate alternatives.
Final Verdict
Katalon True Platform is a strong option for teams wanting centralized test orchestration and execution visibility within the Katalon ecosystem. For teams prioritizing AI-powered failure insights, flaky detection with stability percentages, and advanced CI-focused analytics, automation-intelligence platforms may provide stronger long-term value.
6. Testomat.io
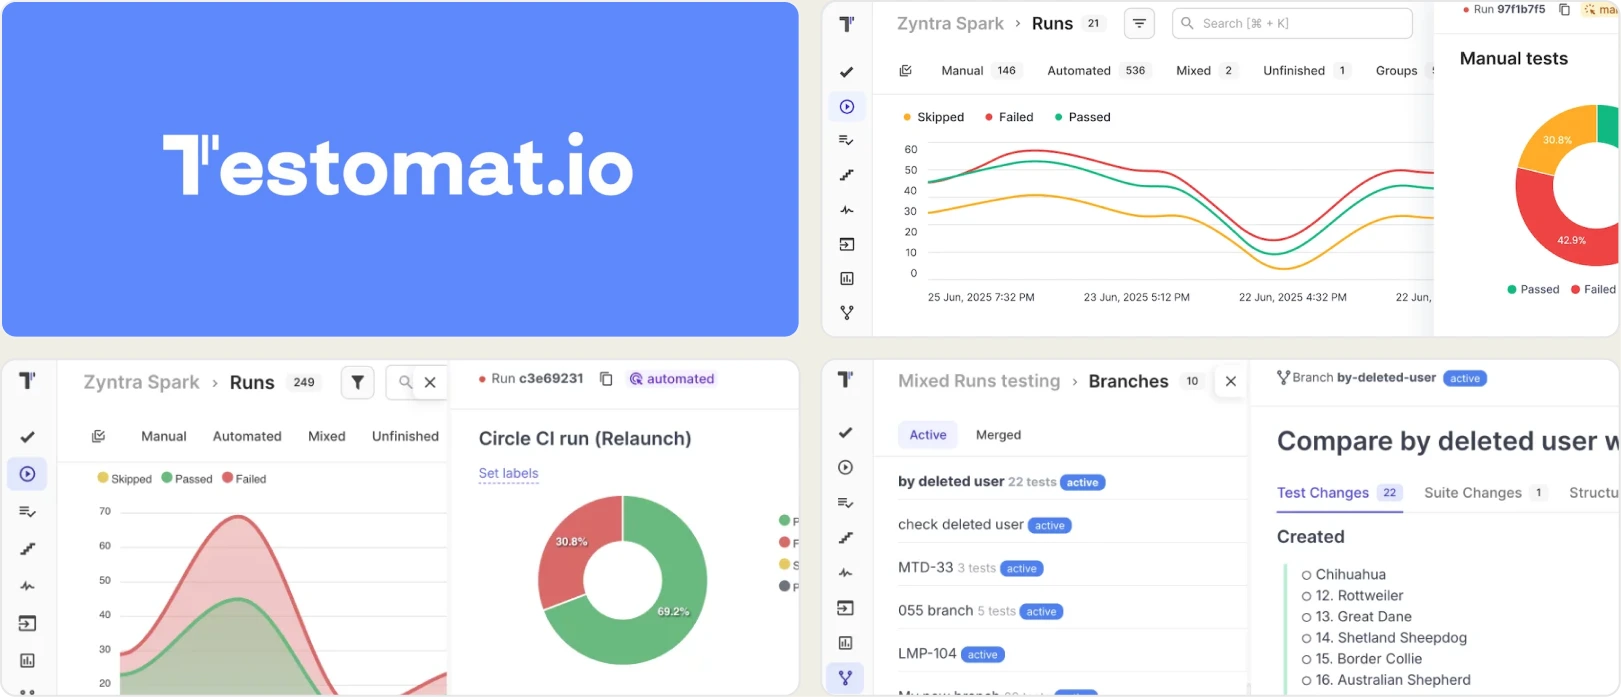
Best for:
Automation-focused teams that want test cases imported directly from code and linked to manual workflows, though the reporting stays surface-level.
Platform Type:
Code-driven test management platform
Integrations with:
GitHub, GitLab, Jira, Slack, Jenkins, GitHub Actions, GitLab CI
Key Features:
- Import tests directly from code (Playwright, Cypress, CodeceptJS)
- Two-way sync between code and the test management repository
- Pass/fail trends and basic execution history
- Tags, labels, and custom fields for test organization
- Environment-based test execution tracking
- Markdown-based test case editing
Pros
- Syncs test cases directly from the codebase via two-way import
- Strong alignment between automation and documentation workflows
- Supports Playwright, Cypress, and CodeceptJS
- Helpful for teams transitioning from manual to automated testing
- Free tier for up to 2 users
Cons
- Reporting stops at pass/fail trends with no failure intelligence
- No AI classification, trace viewer, error grouping, or CI/CD optimization
- Basic flaky detection without deep historical pattern insights
- Limited cross-environment and branch-level analytics
- UI can feel rough for non-technical QA members
First Hand Experience
Testomat.io offers a code-first approach where tests are imported from the codebase into the management layer. The two-way sync means you do not maintain test cases in a separate tool, which reduces duplication for automation-heavy teams.
The problem starts when you need to go beyond managing test cases: the analytics layer provides pass/fail trends and execution history, but there is no AI failure classification, no trace viewer, and no CI/CD optimization like rerunning only failed tests. Teams that adopt Testomat.io for management still need a separate reporting and debugging tool for their CI pipeline.
Pricing & Value
Free plan for up to 2 users and 2 projects. Professional plan at ~$30/user/month with roughly a 10% annual discount. Enterprise pricing is custom, with a self-hosted option available.
Final Verdict
Testomat.io handles the code-to-management sync well, but the reporting and debugging capabilities are too thin for teams running Playwright at scale in CI. Without AI failure intelligence, trace viewing, or CI/CD optimization, teams end up pairing it with another tool anyway.
7. TestMu AI
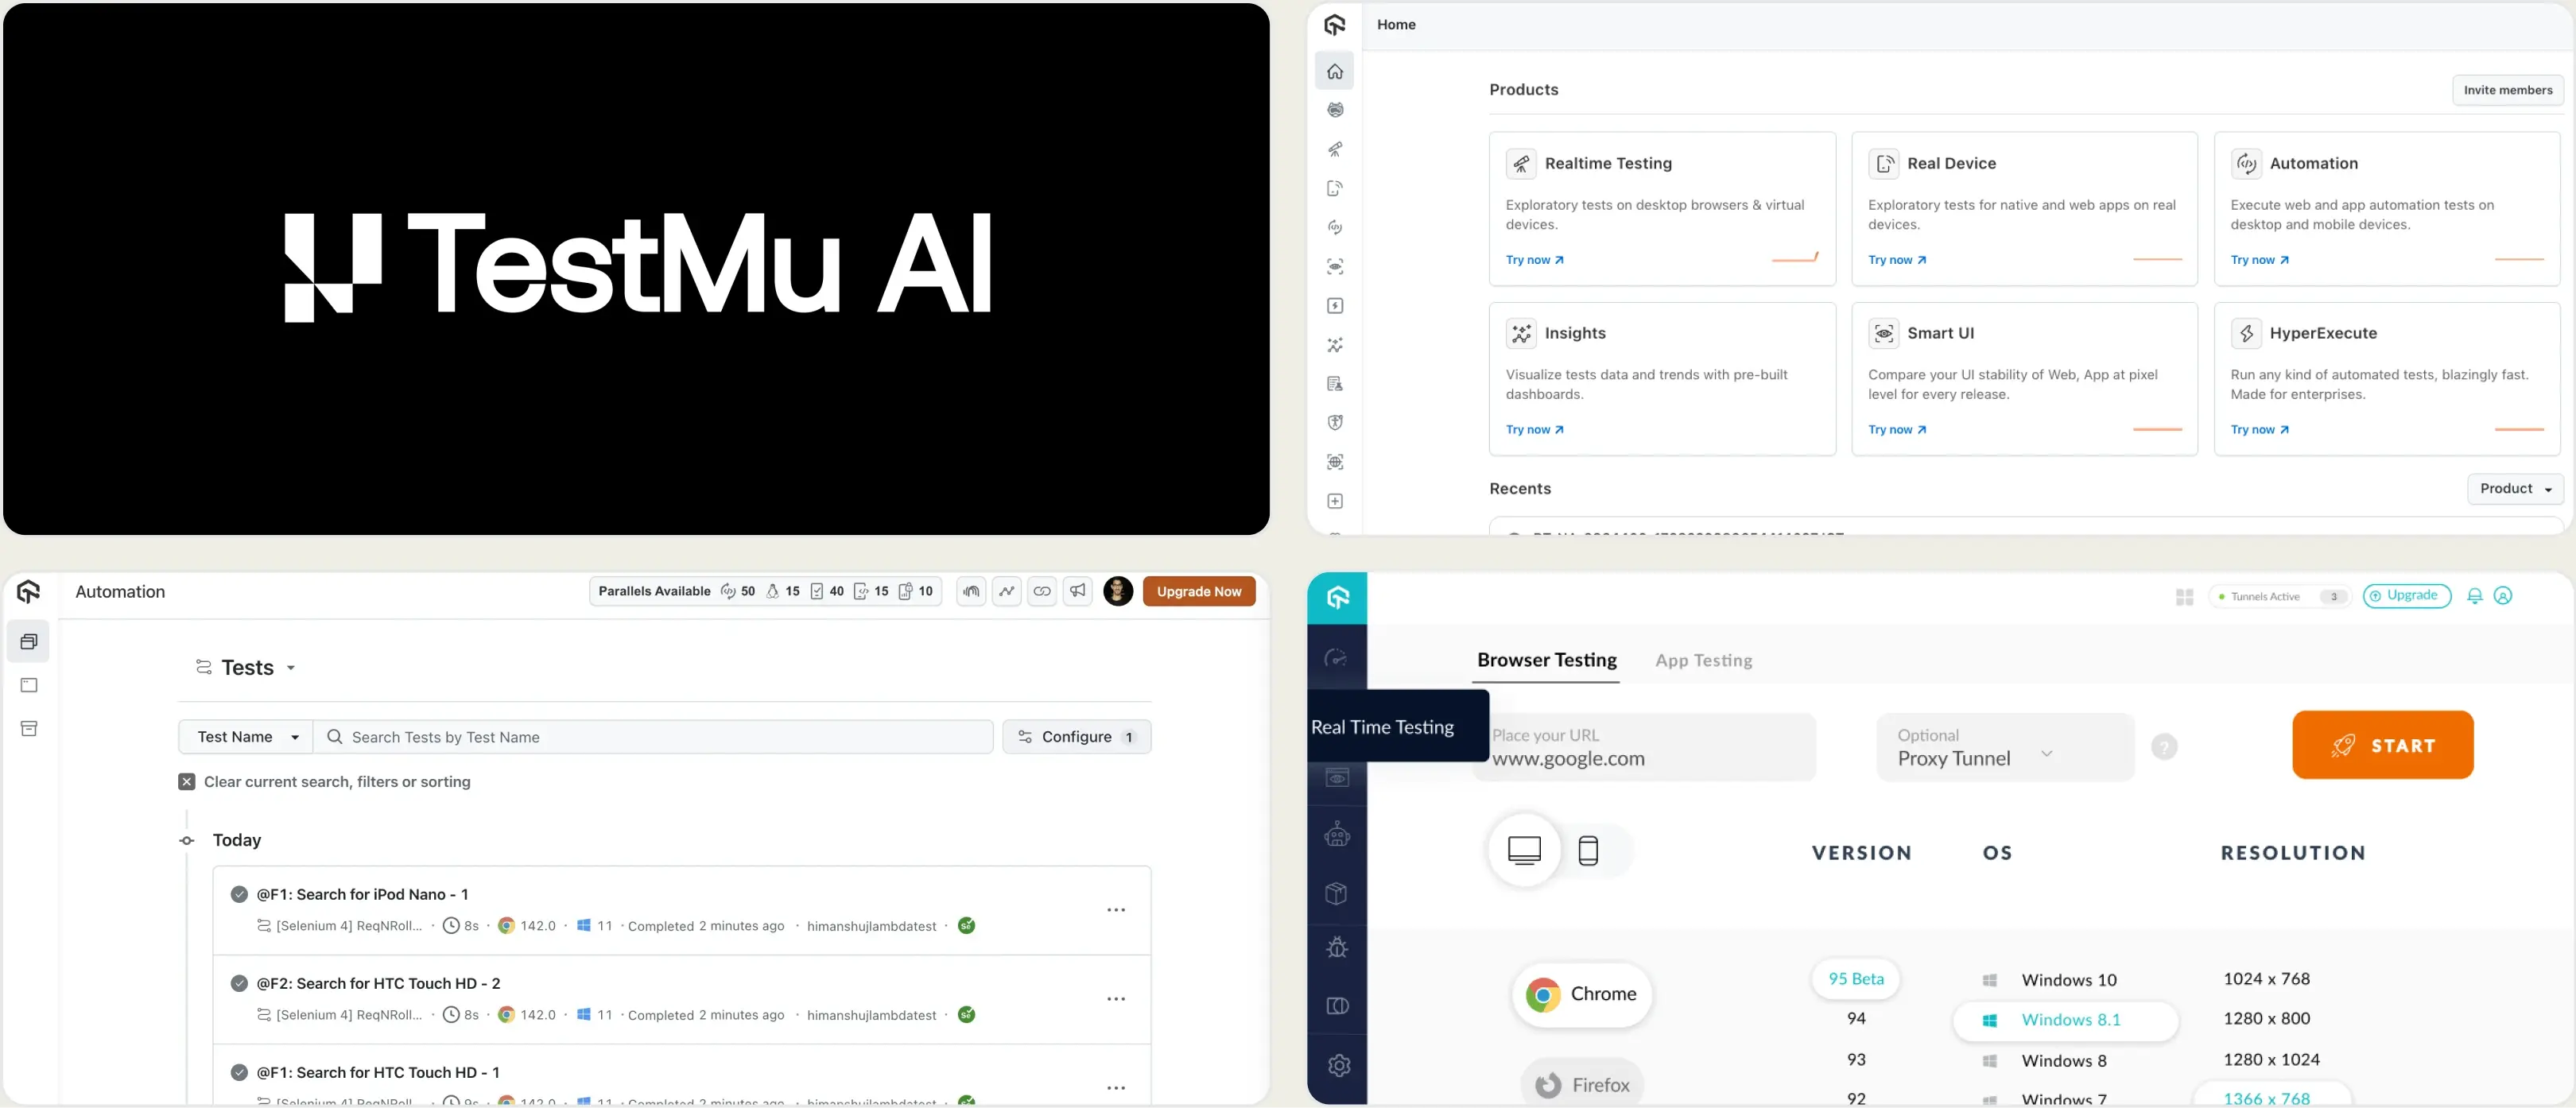
Best for:
Teams running cross-browser and cross-device test execution in the cloud.
Platform Type:
Cloud test execution and analytics platform (formerly LambdaTest)
Integrations with:
Jira, Slack, GitHub, GitLab, CI/CD pipelines
Key Features:
- Cloud browser and device grid for test execution
- Test analytics with flaky test flags
- Screenshots, video, and session logs
- Visual regression testing
- CI/CD pipeline integrations
Pros
- Wide browser and device coverage
- Free tier with 300 minutes included
- Parallel execution reduces test cycle time
Cons
- Primarily an execution platform, reporting is secondary
- Playwright-specific analytics are surface-level
- Costs increase quickly with parallel usage
First Hand Experience
TestMu AI provides cloud infrastructure for running tests across browsers and devices. The analytics dashboard shows pass/fail summaries, flaky test flags, and session recordings. For teams that need a cloud execution grid with basic reporting attached, it covers the essentials.
Teams looking for deeper failure analysis or automated test management alongside reporting may find the analytics limited to execution-level data.
Pricing & Value
Starts at $159/month billed annually for cloud execution. Free tier includes 300 minutes.
Final Verdict
TestMu AI is a reasonable option for teams that need cross-browser cloud execution with basic analytics. For teams focused on Playwright test reporting and failure analysis depth, evaluate whether an execution-first platform matches your needs.
8. Qase
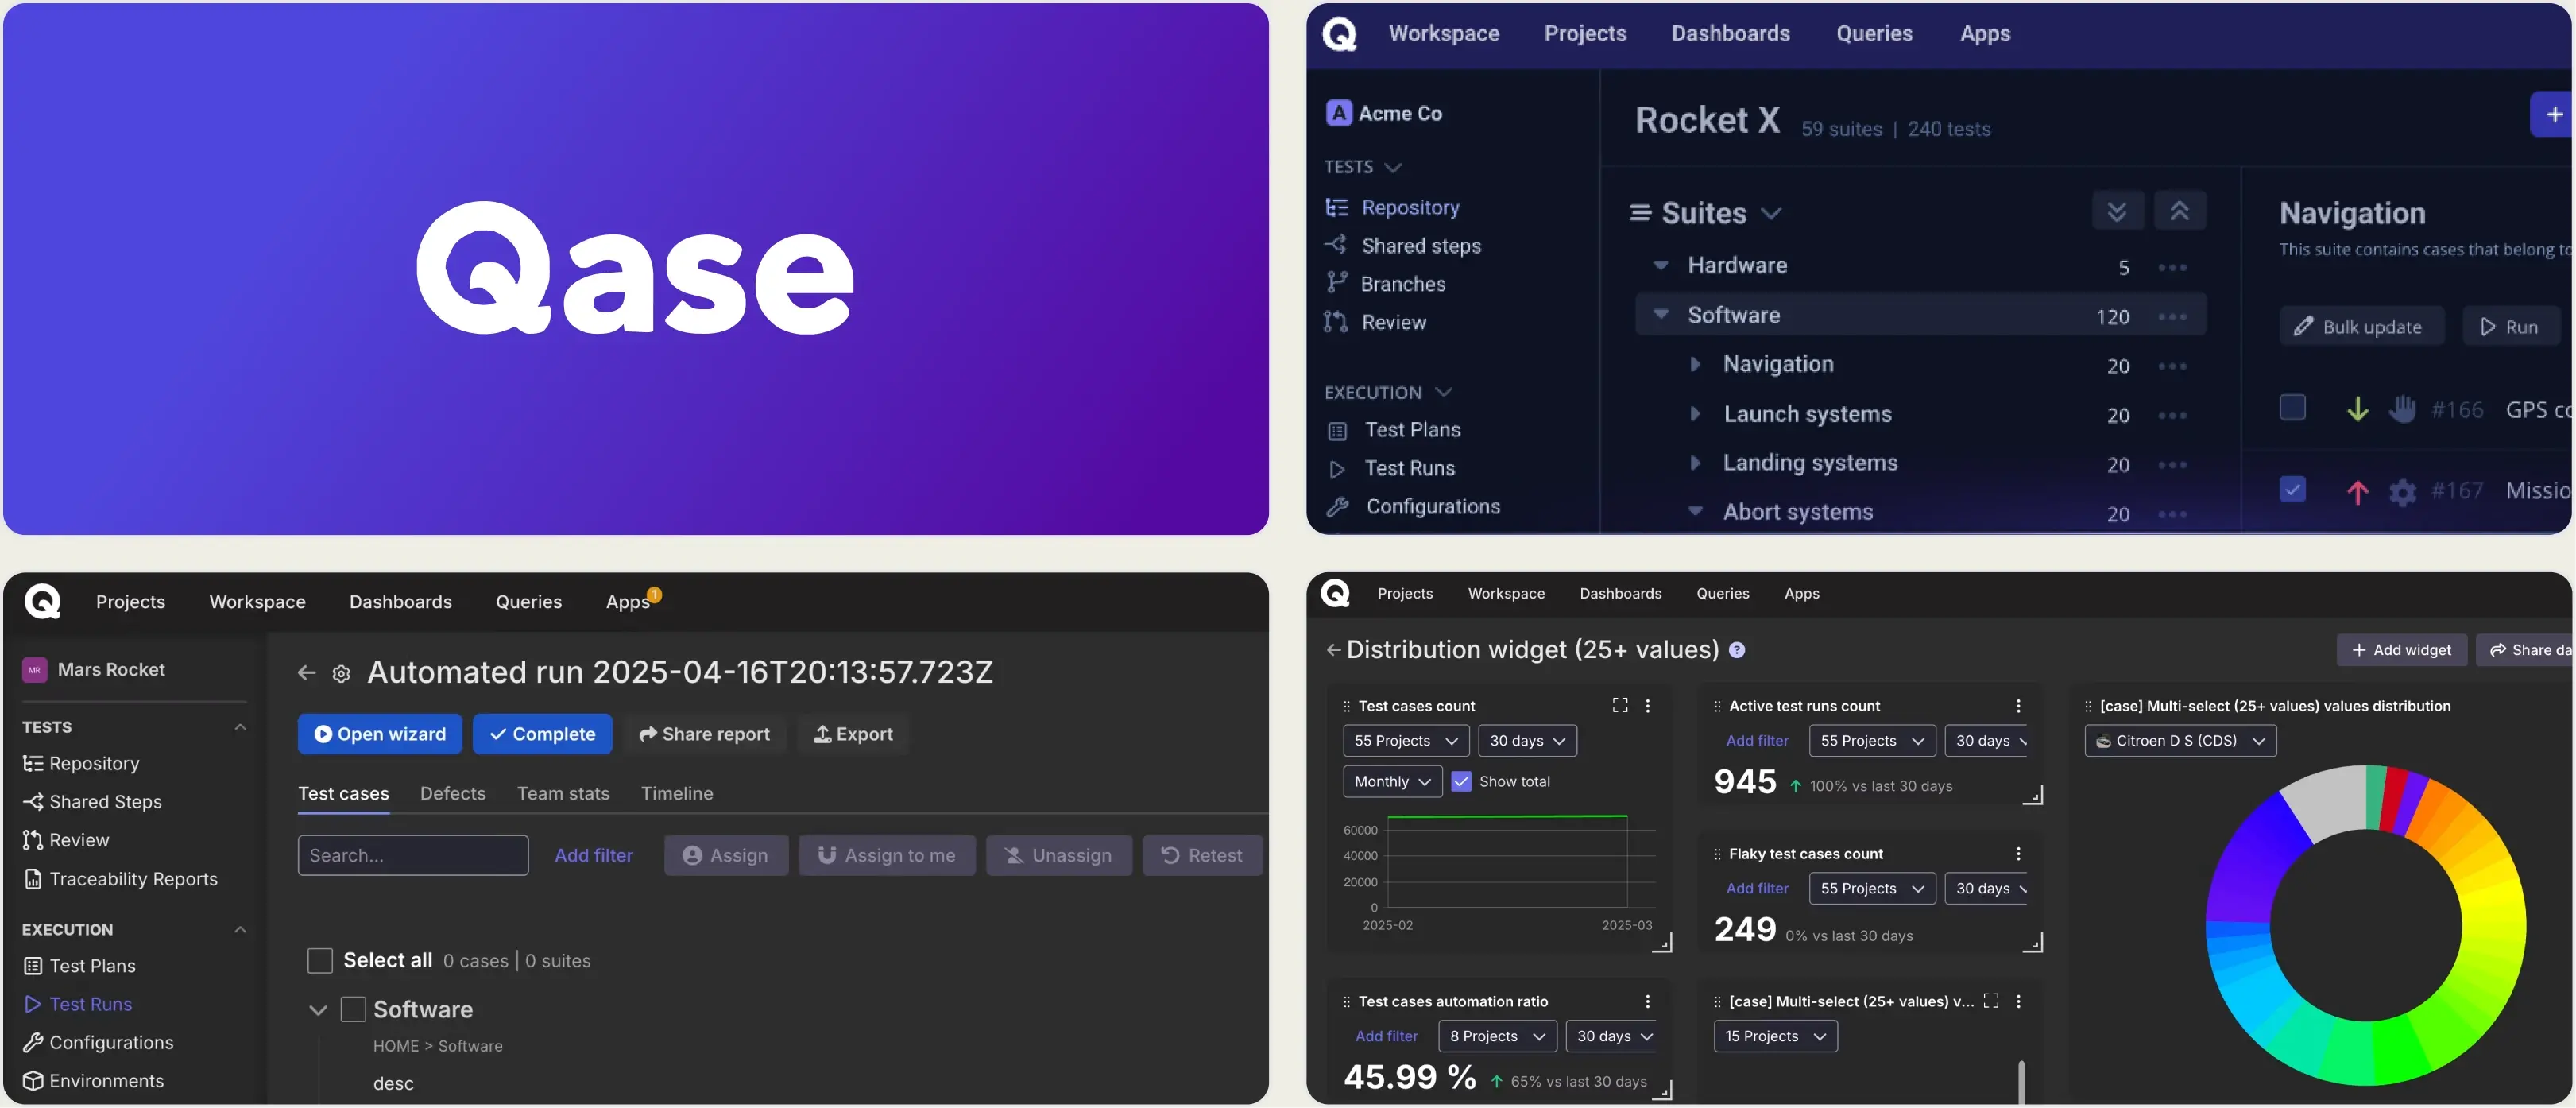
Best for:
Growing teams and agile QA groups that want a modern, unified test management platform for manual and automated testing without the complexity of legacy tools.
Platform Type:
Cloud-based test management platform
Integrations with:
Jira, GitHub, GitLab, Slack, CI/CD tools, REST API, Webhooks
Key Features:
- Central test case repository with folders, shared steps, and custom fields
- Manual and automated test execution tracking
- Real-time dashboards with customizable widgets and actionable reports
- Defect management and issue linking with popular trackers
- CI/CD integration to automatically post test results
- Requirements traceability and coverage insights
Pros
- Clean, intuitive interface designed for fast onboarding
- Unified workspace for manual tests, automation, and defect tracking
- Strong integrations with CI/CD pipelines and issue trackers
- Customizable real-time reporting dashboards
- API and webhook support for automation ecosystem connections
Cons
- AI-powered features are still evolving and may require higher plans (AIDEN credits)
- Per-user pricing scales quickly at $24-36/user/month
- Historical analytics depth and advanced test intelligence are less extensive
- No built-in Playwright trace viewer or CI/CD optimization layer
First Hand Experience
Qase delivers a streamlined test management experience that makes structured test organization feel intuitive compared to legacy tools, which is why teams exploring Xray alternatives often appreciate its modern design and execution visibility.
Where it stops is depth: analytics stay at the pass/fail level, and there is no AI failure classification, trace viewer, or rerun-only-failed workflow. Per-user pricing also adds up as you give every stakeholder access, so teams running Playwright at scale in CI usually pair Qase with a separate reporting tool.
Pricing & Value
Qase offers a free tier (up to 3 users) and paid plans starting at $24/user/month (Startup), scaling to Business and Enterprise. It is a cost-effective option for teams that want modern test management without heavy infrastructure, though per-user pricing should be calculated at your actual team size.
Final Verdict
Qase is a strong choice for teams seeking clear test case management, real-time dashboards, and smooth DevOps integrations. For groups focused on deep automation analytics, flaky test detection, and advanced CI/CD optimization, more specialized automation-focused platforms may provide greater depth.
Compare Qase with TestDino
Classify failures with AISkip per-Jira-user pricingWhat matters when evaluating Xray replacements
Xray provides Jira-native test management and traceability, but the Jira-tied pricing model and the absence of failure intelligence create gaps as teams scale. When evaluating Xray alternatives, focus on these criteria.
Jira-user pricing vs. flat pricing
Xray charges based on your total Jira user count, not your QA team size. A company with 200 Jira users pays at the 200-user tier even if only 10 people run tests. Per-Jira-user pricing makes it harder to justify giving every stakeholder access.
Platforms with flat per-workspace pricing let you add team members without recalculating costs. Calculate total cost at your actual team size before committing.
Test management paired with automated reporting
Xray manages test cases inside Jira but keeps automation analytics at the pass/fail level. To understand why automated tests fail, teams add a separate reporting tool, and now management lives in one platform and failure intelligence in another.
Platforms that combine test case management and automated test reporting on the same product eliminate that fragmentation. Manual test cases and automated Playwright results should live side by side, sortable and filterable in the same test explorer.
Failure intelligence that goes beyond pass/fail
Knowing that 12 tests failed tells you something happened. It does not tell you why. AI failure classification, error grouping by stack trace and message, and root cause analysis turn raw results into a prioritized fix list. Without this layer, every failed test requires manual investigation.
The best Xray alternatives separate real defects from flaky tests and environment issues automatically.
Debugging evidence available immediately
When a test fails in CI, you should not need to re-run it locally to understand the failure. Built-in trace viewers, screenshots, video playback, and console log viewers make failure context available right after the CI run finishes. Xray supports attachments but does not provide a native Playwright trace viewer or structured debugging experience.
Test failure triage should start from the reporting dashboard, not from a local development environment.
CI/CD optimization beyond result viewing
Viewing test results after a run finishes is the starting point. Rerunning only failed tests, blocking merges with quality gates, and posting AI-generated summaries to commits and merge requests actively improve pipeline speed and merge safety.
These features reduce CI costs rather than just displaying test execution data. If your current tool only shows results but does not act on them, you are missing the optimization layer.
Transparent, predictable pricing
Jira-user-tiered Xray pricing makes it hard to budget as teams grow. Flat monthly pricing with published plans lets you evaluate total cost before committing and scale without negotiation.
For a lightweight Xray replacement for small teams, look for free tiers that include core management and reporting features.
Wrapping Up
Xray provides Jira-native test management with deep requirement-to-test traceability and BDD support. For teams that live entirely inside Jira and are comfortable with Jira-user-tiered pricing, it covers the basics.
ReportPortal offers open-source self-hosted reporting with infrastructure overhead and no native test management. PractiTest targets compliance-heavy workflows at a premium price. Zephyr stays Jira-bound with the same pricing model. Katalon True Platform centralizes orchestration within its own ecosystem. Testomat.io syncs test cases from code but keeps reporting thin. TestMu AI delivers cross-browser execution infrastructure rather than analytics. Qase brings a modern interface, but per-user pricing and shallow automation analytics.
For Playwright-first teams that want test case management, AI failure classification, flaky test detection, trace viewing, and CI/CD optimization on one platform without per-user or per-Jira-user pricing, TestDino combines test intelligence and management at $39/month billed annually per workspace.
FAQs
TestDino supports CSV import for test cases. You can export your Xray test cases and import them into TestDino's test management module with suites, ownership, and custom fields preserved. Automated Playwright results start flowing from your first CI run, with no reporter configuration needed. Your test history builds from the first report.