Selecting the right test debugging tool is a critical decision for modern engineering teams. DeploySentinel was widely adopted for its framework-integrated DOM snapshots and session recordings.
However, its core design and recent ecosystem changes present significant challenges, including high maintenance overhead and a lack of persistent historical analytics.
In this guide, we explore 6 of the best DeploySentinel alternatives worth considering in 2026. We compare their features for reporting, analytics, and team collaboration to help you find the right tool to improve your testing workflow.
Best DeploySentinel Alternatives: How to Choose the Right Tool
A modern tool must fit into how teams already work. We assessed how well each platform embeds quality insights directly into the developer workflow.
Key features include the MCP server, dashboards, automated test summaries in pull requests, and native integrations with essential tools like Slack, Jira, and Linear. This creates a shared, real-time view of quality across the entire team.
How to Compare DeploySentinel Alternatives
Here is a quick comparison of the top alternatives to DeploySentinel to help you identify your preferred test reporting tool:
 TestDino |  DeploySentinel |  Zebrunner |  BrowserStack |  Datadog | |
|---|---|---|---|---|---|
| Pricing (starts at)Lowest paid plan, per the listed billing terms. | $39/month (billed annually) | Deprecated | $39/user/month | $299/month | $20/committer/month |
| Best for | Playwright test intelligence & management | DOM snapshots for Cypress | Enterprise test reporting | Cross-browser analytics | CI pipeline monitoring |
| Playwright integration | Native (trace viewer, error grouping, MCP) | Via extensions | Via agents | SDK | Via library |
| One-step CI setup | Extension + CI config | Agent config | Cloud setup | Agent + SDK | |
Dashboards & Reporting | |||||
| Unified Playwright dashboard | Per-session view | Custom dashboards | |||
| Multi-tab test run detail | Summary, History, AI Insights & more | Session/DOM/Network | Basic view | Span-level view | |
| Pull request insights (per-PR history)See test results and history for each pull request. | Basic insights | Branch-level only | |||
| Test Explorer (hierarchical/flat/tag)Browse tests as a hierarchy, a flat list, or by tag. | |||||
| Real-time streaming | Per-shard/worker | ||||
| Scheduled PDF reports (email)Get report PDFs emailed on a set schedule. | Daily/Weekly/Monthly | Custom monitors | |||
Test Analytics | |||||
| Analytics: trends & patterns | For test runs, test cases & more | Trends only | Explorer-based | ||
| Code coverage, per-file | Istanbul, run-level | Separate product | |||
| Environment analytics | Pass-rate/flaky by env | ||||
Debugging & Evidence | |||||
| Built-in Playwright trace viewer | Cypress DOM focus | ||||
| Screenshots & video replay | Embedded | ||||
| Console logs (per test) | Node + browser | ||||
| Visual diff comparison | |||||
| Smart error grouping | Message/stack/location | Basic grouping | Basic clustering | ||
| Flaky detection (+ stability %)Spot tests that pass and fail inconsistently, with a stability score. | Requires config | ||||
| Playwright tags & annotations | Priority/owner/links/metrics | Custom attributes | Custom tags | ||
CI/CD Optimization | |||||
| GitHub CI Checks quality gates | Per-env + mandatory tags | Basic checks | |||
| Branch → environment mappingMatch each Git branch to the environment it runs against. | Exact/regex | Tag-based | Tag-based | ||
| Sharded / parallel run support | Per-shard live view | Parallel limits | |||
| Native CI breadth | GitHub, GitLab, Azure DevOps, TeamCity, Bitbucket, CircleCI, Jenkins | GitHub, CircleCI | Agents/plugins | GitHub, GitLab | Major CI providers |
| Self-managed GitLab | |||||
Test Management | |||||
| Test case management (suites, ownership) | |||||
| Bulk test creation (PRDs/Jira/stories)Generate many test cases at once from PRDs, Jira, or user stories. | via MCP | ||||
| Release tracking (releases/cycles/sprints)Group test results by release, cycle, or sprint. | |||||
| Exploratory / manual sessions | |||||
| Import / export test cases | JSON/CSV/ZIP | Via API | |||
AI & Automation | |||||
| Local MCP (IDE agents)Let AI coding assistants in your editor act on test data directly. | Cursor/Claude Code/Copilot | ||||
| Remote MCP (web AI)Let web-based AI tools query your test data. | |||||
| AI test run summary on GitHub PRs | |||||
| AI test suite audit (audit score + report)AI scores your test suite and gives a downloadable report. | |||||
| AI failure classification | |||||
Integrations & Collaboration | |||||
| Bug tracking breadth | Jira, Linear, Asana, monday | None | Jira, Rally | Jira, Trello | Jira, PagerDuty |
| Slack notifications (run summaries) | App + webhooks | ||||
Platform & Security | |||||
| Public API & CLIs | REST API + CLI | None | REST API | REST API | REST API |
| Project-level AI controls | Per-feature toggles | ||||
| Compliance & certifications | ISO 27001, SOC 2 Type II, GDPR | N/A (OSS library) | SOC 2 | SOC 2 | ISO 27001, SOC 2 |
Plans & Pricing | |||||
| Plan tiers | Free · Pro $39 · Team $79 · Enterprise | N/A (now HyperDX) | Free · Pro | Pro · Enterprise | $20/committer/mo + usage · Enterprise |
| Free executions | 5,000/mo | Unlimited (self-hosted) | 14-day trial | Usage-based | |
| Support | Chat + Slack Connect + Priority email | None | Email + Docs | Email + Docs | Email + docs |
| Try for free | Learn more | Learn more | Learn more | Learn more | |
Best DeploySentinel Competitors
Here are the 6 best alternatives to DeploySentinel that you can choose from to improve your test reporting:
1. TestDino
Best for:
Playwright-focused teams looking to consolidate test reporting, test management, and CI/CD optimization into a single platform, rather than piecing together several separate tools.
Platform Type:
Test reporting, dashboards, test management, and CI observability platform for Playwright.
Integrations with:
GitHub Actions, GitLab CI, Azure DevOps, TeamCity, Jira, Linear, Asana, monday, Slack.
Key Features:
 Unified test management and automated reporting
- AI-driven failure classification across 4 categories
- Native trace viewer with DOM snapshots and network activity logs
- Error grouping based on message and stack trace patterns
- GitHub CI Checks acting as merge-quality gates
- MCP Server enabling AI agent queries directly from your IDE
- Cross-run flaky test detection
- AI-generated summaries posted to GitHub commits
- Live results streaming through WebSocket
- Per-file code coverage breakdown

Pros
- Purpose-built for Playwright with setup in under 10 minutes
- Combines test management and automated reporting in a single platform
- Wide CI/CD coverage: GitHub Actions, GitLab CI, Azure DevOps, TeamCity
- Posts AI summaries to GitHub commits, GitLab MRs, and Slack
- One-click bug filing to Jira, Linear, Asana, or monday
- Budget-friendly at $39/month billed annually

Cons
- Purpose-built for Playwright (multi-framework support on the roadmap)
First-Hand Experience
DeploySentinel did one thing well: it captured DOM snapshots and network requests for isolated failing tests. But after a few months, teams found themselves dealing with blocked third-party extensions, missing network logs, and building custom CI scripts to tie those isolated artifacts back to specific PRs and environments.
TestDino removes that fragile infrastructure layer. Results persist automatically across runs with unified dashboards, test analytics, and AI failure classification working from the very first CI run: no brittle extensions, no complex hosting, no custom scripts.
Test management and automated reporting live on the same platform. Manual test cases sit in suites up to 6 levels deep with ownership, custom fields, and version history. The Test Explorer shows both manual and automated tests side by side, sortable by flaky rate, tags, and code coverage status.
Debugging That Saves You from Re-running Locally
Each failed test in TestDino comes with screenshots, recorded video, browser console logs, and a native trace viewer you can step through action by action, available right after the CI run finishes.
AI Insights classifies each failure as an Actual Bug, UI Change, Unstable Test, or Miscellaneous issue. Bug filing is 1-click into Jira, Linear, Asana, or monday, pre-filled with error details, the stack trace, failure history, and direct links to the run and CI job.
CI/CD Speed and Merge Safety
Each shard reports as its tests finish. History persists across parallel shards and different CI runners.
GitHub CI Checks adds quality gates directly to your PRs. Set a minimum pass rate, mark critical tags as mandatory, and configure different failure rules per environment. AI-generated run summaries are posted to GitHub commits and GitLab merge requests with pass, fail, and flaky counts.
Flaky Test Detection That Tells You Why
Flaky test detection classifies unstable tests by root cause: timing-related, environment-dependent, network-dependent, or assertion-intermittent. Every test gets a stability percentage, and you can compare flaky rates across environments to spot underlying infrastructure problems.
Real-Time Streaming and Scheduled Reports
Results appear on the dashboard as each test completes via real-time WebSocket streaming, not after the full suite finishes. Automated PDF reports deliver test health summaries on daily, weekly, or monthly schedules. Slack notifications push run summaries filtered by environment and branch.
MCP Server for AI-Assisted Workflows
The MCP Server connects your AI assistant (Cursor, Claude Code, Copilot) directly to your test data. List test runs, pull debugging context, perform root cause analysis, and manage manual test cases through natural language. It covers both automated debugging and manual test management without switching tools.
Pricing & Value
Pricing may vary. Check the pricing page for the latest details.
Final Verdict
DeploySentinel gave you isolated DOM snapshots of a single test run. TestDino provides native traces alongside persistent historical analytics across every run.
Total cost of ownership matters here. DeploySentinel was free, but maintaining CI scripts, custom extensions, and manual triage took significant engineering time. TestDino replaces that fragile infrastructure overhead for $39/month, with historical test analytics, AI failure classification, error grouping, flaky detection, and test management.
For teams migrating away from broken DOM recorders, it is the best alternative to DeploySentinel for Playwright teams that want robust test observability.
2. Zebrunner
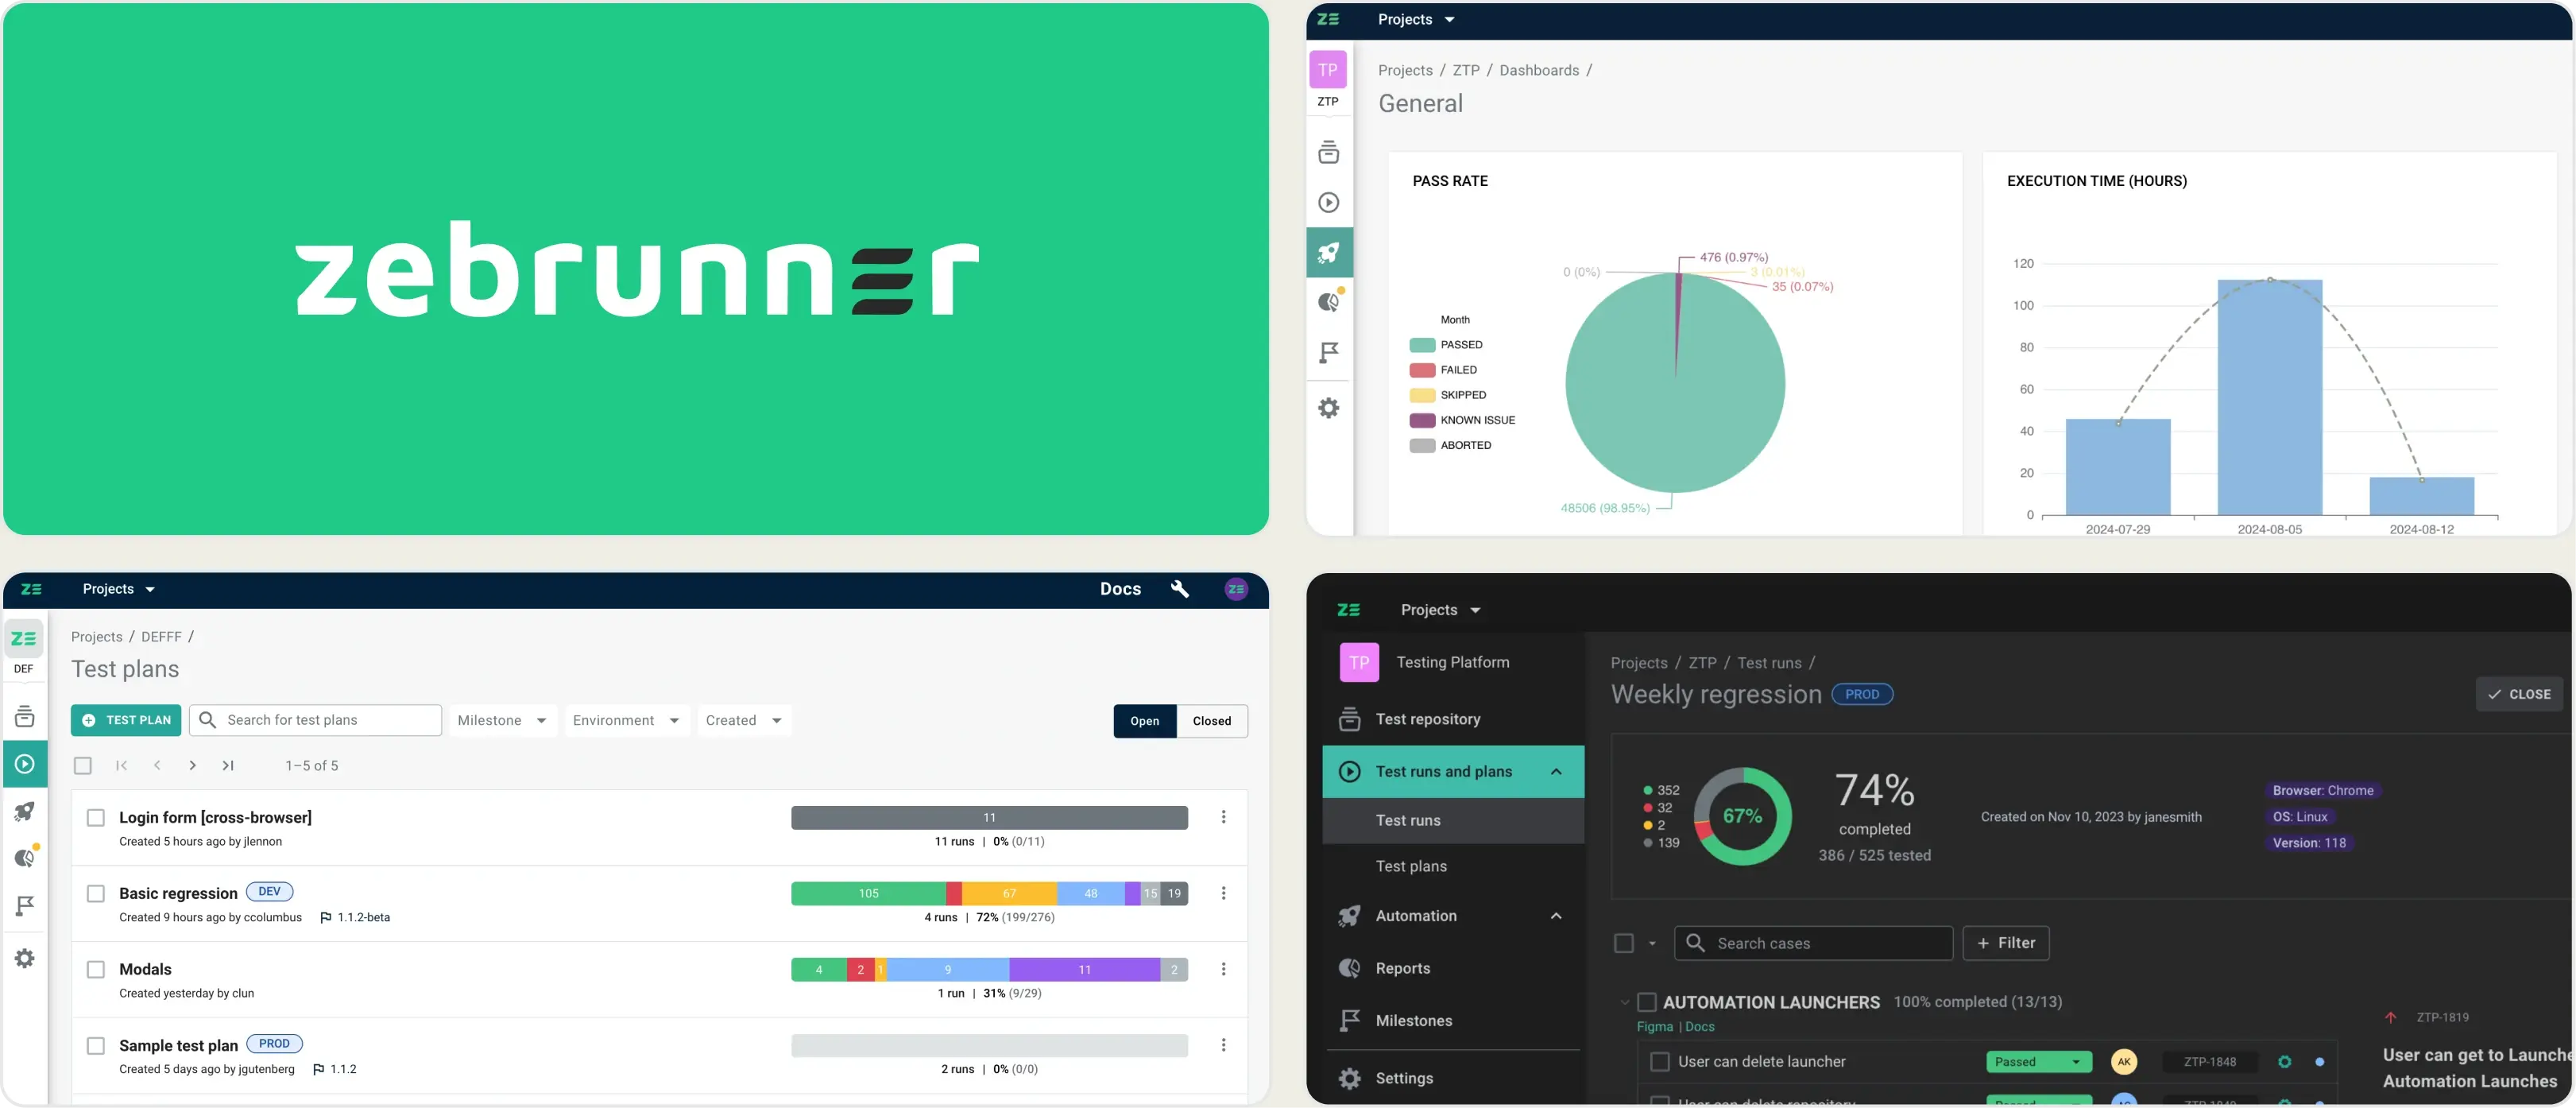
Best for:
QA teams who want manual and automated testing in one tool, with basic AI failure analysis.
Platform Type:
Test management and reporting platform for web, mobile, and API testing.
Integrations with:
Jenkins, GitHub, GitLab, Jira, Slack, TeamCity.
Key Features:
- Manual and automated test management together
- Basic AI failure categorization
- Test execution tracking and dashboards
- Logs, screenshots, and video for test runs
- Flaky test tracking over time
- Jira integration for bug linking
Pros
- One tool for both manual and automated testing
- Works with many frameworks, not just Playwright
- Good Jira integration
Cons
- Not built specifically for Playwright, so setup takes more time
- More modules and settings than most teams actually need
- Interface can feel heavier for smaller teams
First-Hand Experience
Setting up test management, device testing, and reporting all in one place sounds appealing, but it comes with a tradeoff: more configuration and more modules to turn on before you're actually seeing useful reports.
For teams that only run Playwright, this extra layer often isn't necessary. Connecting to your CI and getting reports, AI failure analysis, and dashboards working right away, without separate modules to turn on or per-user pricing to manage, is where TestDino saves that setup time.
Pricing & Value
Per-user pricing means costs grow as your team grows. A flat $39/month billed annually is simpler to plan for and stays affordable even as your team scales.
Final Verdict
For teams managing both manual and automated testing across several frameworks, and who don't mind per-user costs scaling with headcount, Zebrunner covers a lot of ground in one platform. Smaller or Playwright-only teams may find the setup heavier than needed, especially if quick onboarding and low maintenance matter more than broad framework coverage.
3. BrowserStack Test Observability
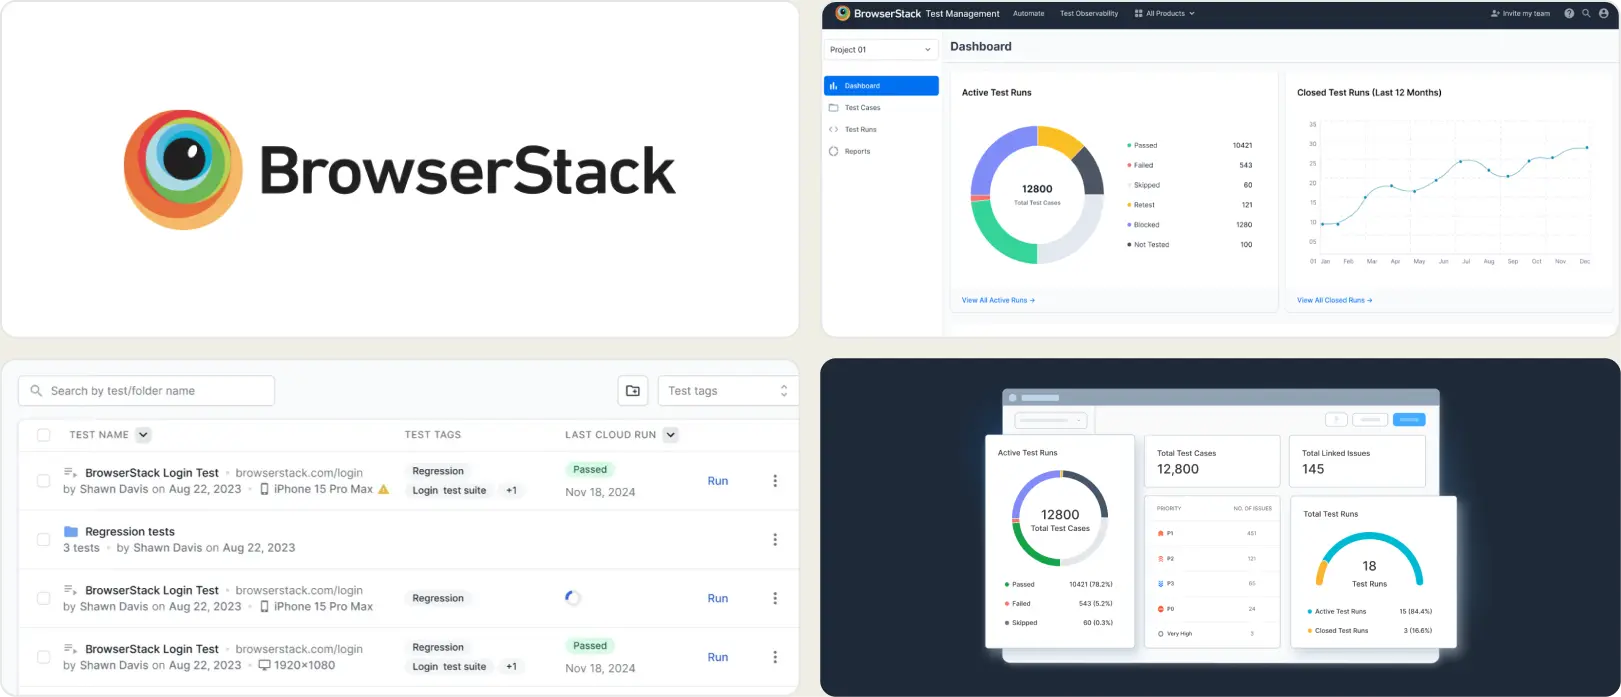
Best for:
Teams already using BrowserStack for cross-browser testing.
Platform Type:
Cloud test execution with session-level reporting.
Integrations with:
Jira, CI/CD tools.
Key Features:
- Test execution reports per session
- Cross-browser coverage logs
- Screenshots and video recording
- Session-level dashboard
- Basic error logs and trends
Pros
- Easy fit if already on BrowserStack
- Simple cloud onboarding
- Reliable session capture across browsers
Cons
- Reporting stays at session level
- No real test case management
- Analytics are basic next to dedicated tools
First-Hand Experience
BrowserStack gives clear visibility into test runs. Logs, screenshots, and videos are easy to find during triage. It works well alongside their execution grid.
For test case management or deeper failure analysis, the reports fall short. They're built around sessions, not test-level insight.
Pricing & Value
Reporting comes bundled with execution plans. Cost scales with browser minutes and test volume.
Final Verdict
A solid pick if you're already on BrowserStack. For deeper reporting and test management, dedicated platforms go further.
4. Datadog Test Optimization
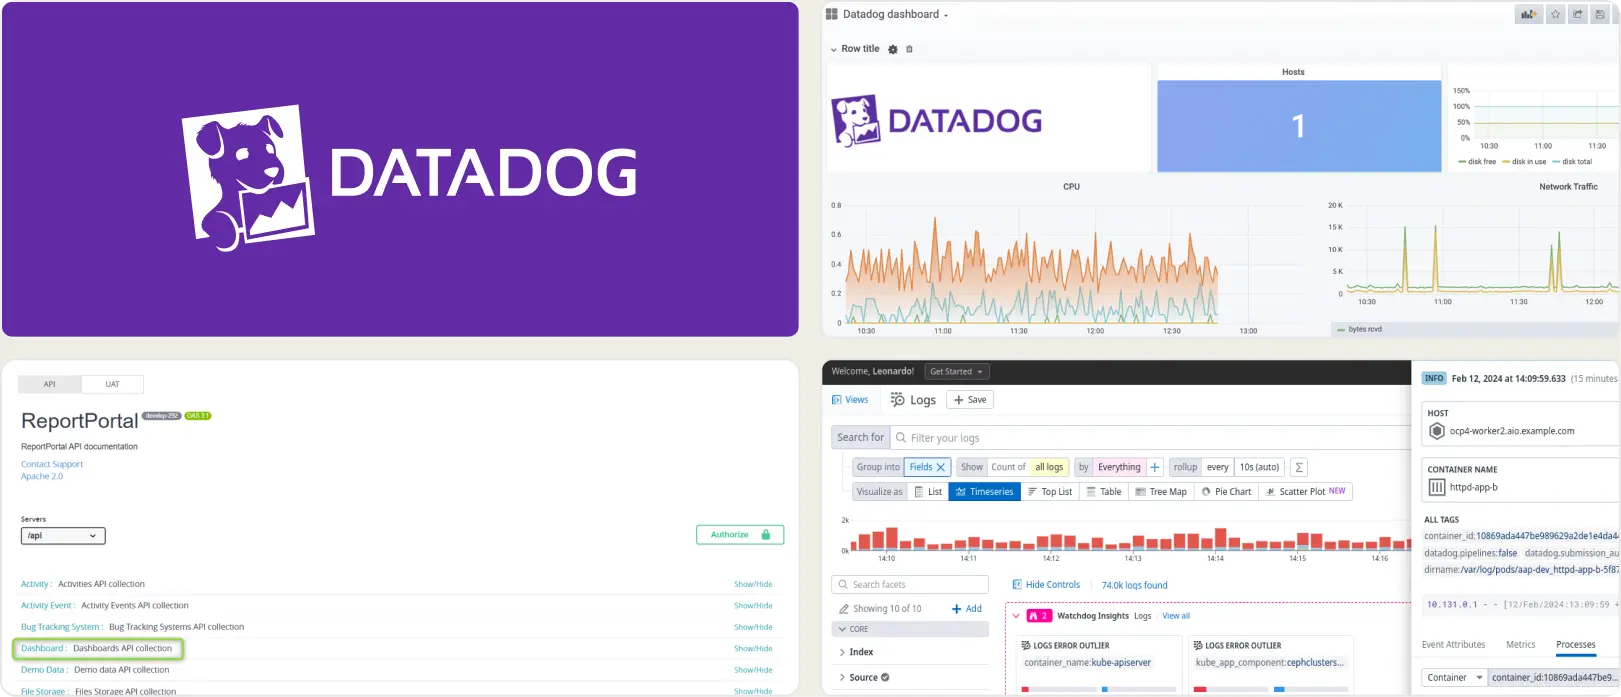
Best for:
Teams already using Datadog for monitoring who want test data in the same place.
Platform Type:
Cloud observability platform with test monitoring.
Integrations with:
CI/CD, Slack, Jira, PagerDuty.
Key Features:
- Test results inside CI pipeline dashboards
- Flaky test tracking over time
- Custom dashboards and alerts
- Flame graphs for test execution tracing
- Pipeline performance metrics
Pros
- Natural fit if Datadog is already your monitoring stack
- Strong flaky test detection
- Good pipeline-level visibility
Cons
- Cost grows with data volume and retention
- Not focused on deep test triage
- Harder learning curve for QA teams
First-Hand Experience
Datadog brings its monitoring approach into test data, which works well for teams already living in that ecosystem. But it's built as one piece of a larger observability platform, not a dedicated test tool.
Day-to-day triage often means jumping across dashboards and modules. QA teams looking for a focused, test-first workflow may find it more general than they need.
Pricing & Value
Costs follow a usage-based model tied to data ingestion and retention. This can get hard to predict as logs, traces, and test data pile up. The value is strongest for teams that want test data sitting next to infrastructure metrics in one place.
Final Verdict
A solid pick for larger teams that want test visibility folded into full-stack observability. Teams that just need clear, focused test reporting may prefer a tool built specifically for that job.
5. ReportPortal
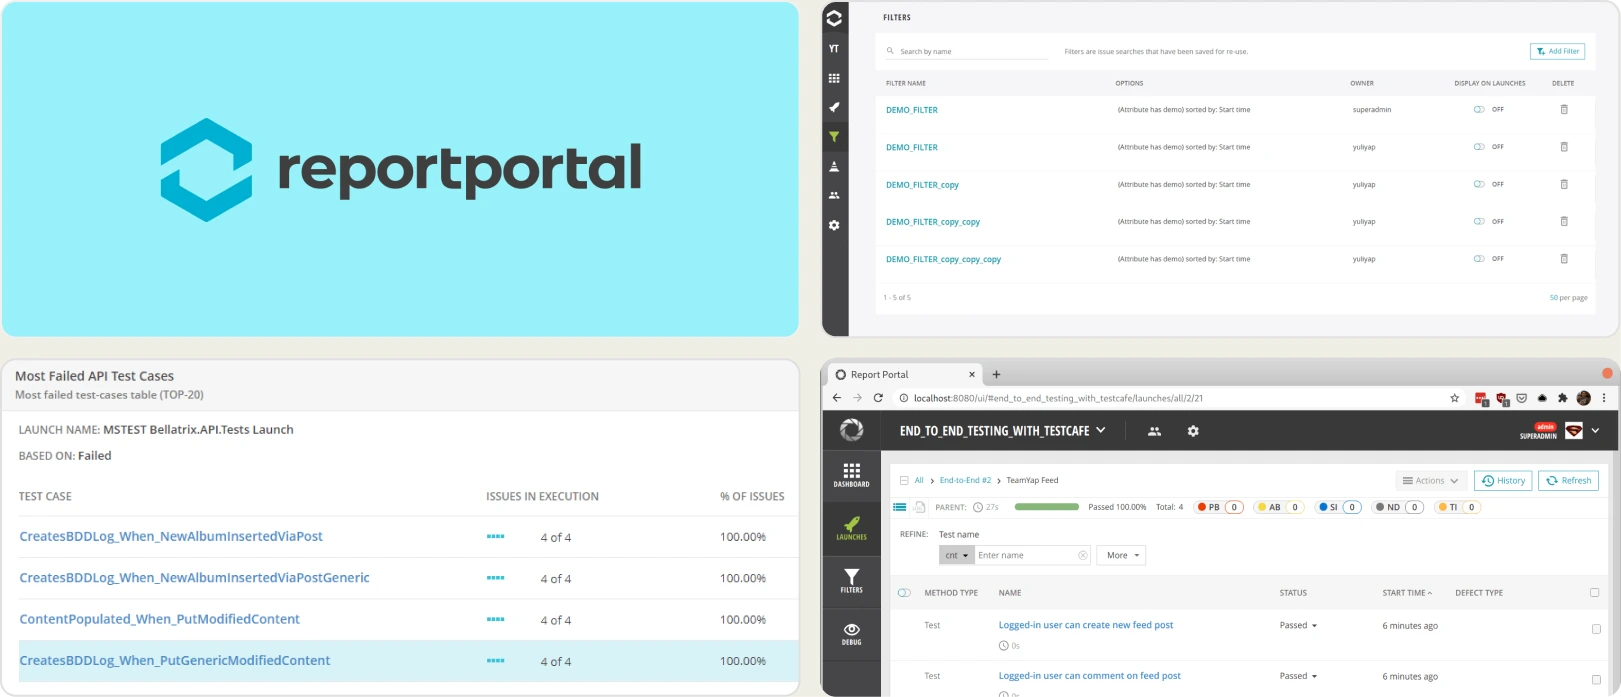
Best for:
QA teams that want open source flexibility with basic test analytics.
Platform Type:
Web dashboard platform.
Integrations with:
Jenkins, GitHub, GitLab, Jira, Rally.
Key Features:
- Open source test reporting
- Flaky test detection via history
- Failure clustering and auto-analysis
- Self-hosted with full data control
- Launch-level run history
Pros
- Free open source core
- Supports many test frameworks
- Persistent history across launches
Cons
- Limited AI-driven insights out of the box
- Needs hosting, setup, and upkeep
- UI feels less modern than newer tools
- PR-focused analytics need extra wiring
First-Hand Experience
ReportPortal aggregates test results from multiple frameworks and uses ML-based pattern matching to identify recurring failure clusters. The self-hosted option gives full data control.
Setup requires Docker Compose, database configuration, and ongoing infrastructure maintenance. Teams looking for managed platforms with QA workflow management and quick onboarding may find the operational overhead significant.
Pricing & Value
Free (open source, self-hosted). SaaS starts at $599/month for the Startup tier.
Final Verdict
ReportPortal works well for teams that want to self-host and are comfortable managing their own ML-based failure analysis. Teams that want reporting and test management together, without the infrastructure work, may find managed platforms a smoother fit.
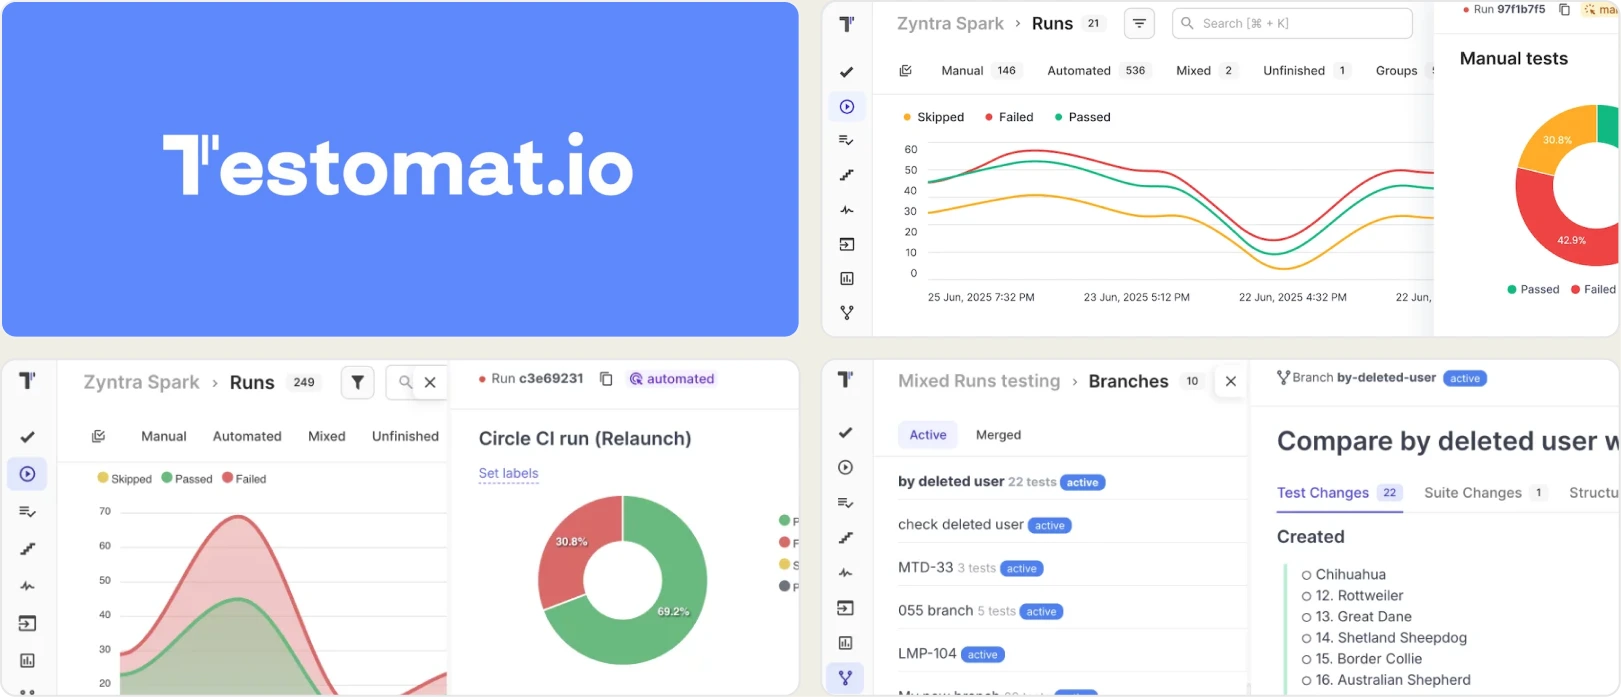
6. Testomat.io
Best for:
Agile QA teams that want manual and automated test management.
Platform Type:
Test case management and reporting platform.
Integrations with:
Jira, CI/CD tools.
Key Features:
- Manual and automated tests managed together
- BDD and Gherkin support
- Real-time reporting and analytics dashboard
- Version control and test history
- Bidirectional Jira integration
Pros
- Combines manual and automated testing in one place
- Supports many frameworks
- Strong Jira integration with two-way sync
- Free plan available, paid plans start around $30/month
Cons
- Broader focus on test case management, not Playwright specific
- Some users note the UI takes time to learn
- Reporting depth is basic compared to dedicated CI observability tools
First-Hand Experience
Testomat.io works well for teams that need one place to plan, write, and run both manual and automated tests. The Jira sync and BDD support stand out, especially for teams working across QA, dev, and product.
Where it feels less focused is on deep CI debugging. Reports and analytics cover the basics, like flaky tests and trends, but don't go as deep as tools built specifically around Playwright's trace and network data.
Pricing & Value
A free plan covers small teams, with paid plans starting around $30/month. Pricing scales with team size and features like AI tools and enterprise controls.
Final Verdict
A good fit for agile teams that want test case management and reporting together, especially if manual testing is part of the workflow. Playwright-focused teams that mainly need CI debugging and trace-level analysis may want a more specialized tool.
How to Select an Alternative to DeploySentinel
Choosing the right alternative means moving from a simple artifact generator to an intelligent analytics platform. Your decision should be guided by your team's need for speed, collaboration, and data-driven insights.
Smart Reporting and Debugging
A modern alternative must go beyond session recordings and pass/fail logs. Look for features like AI-powered failure categorization, flaky test detection, and root cause analysis.
DeploySentinel often relies on plugins that can break with framework updates, requiring manual fixes to keep classification working. Intelligent platforms surface critical bugs automatically, saving your team hours of triage.
Team Collaboration
Effective engineering requires a single source of truth. Plugin-based setups like DeploySentinel can fragment data across tools, making it harder to keep everyone aligned.
Select a centralized platform that offers role-based dashboards, instant notifications via Slack, and direct integrations with ticketing systems like Jira to keep developers, QA, and managers aligned.
Analytics and Test Coverage
Data is only useful if it's reliable run after run. DeploySentinel's dependence on plugins means updates or version mismatches can disrupt data collection, weakening long-term trend analysis.
A superior alternative must provide stable, persistent data storage, letting you track test stability, failure trends, and performance over weeks and months to make informed decisions about quality.
CI/CD Speed and Integration
Your reporting tool should simplify your pipeline, not complicate it. DeploySentinel's plugin architecture can add setup and maintenance overhead, especially when keeping integrations working across CI environments.
Look for a tool that offers simple, one-step CI/CD integration and does not require ongoing plugin maintenance or custom scripting.
Ease of Use & Support
A powerful tool should not require constant troubleshooting. Plugin fragility in tools like DeploySentinel can turn routine updates into unexpected fire drills.
Prioritize platforms that offer quick onboarding, a stable setup, and responsive customer support to ensure your team can get value from day one.
Wrapping Up
While DeploySentinel offers useful session recording and test capture, modern engineering teams require more. They need an intelligent, low-maintenance platform that provides stable, actionable insights, not one dependent on fragile plugins.
The move away from plugin-based tools is a move toward proactive quality management. Modern tools like TestDino deliver the speed, intelligence, and collaboration that teams need to ship with confidence.
By providing a centralized, Playwright-native platform with AI-powered analytics and a simple CI setup, TestDino addresses the core challenges that drive teams to seek an alternative to DeploySentinel in the first place.
Trade fragile plugins for persistent test intelligence
See why each CI failure happenedTrack flaky tests by root causeFAQs
Plugin fragility comes up most often. Updates to Playwright, CI tools, or the plugins themselves can quietly break reporting, which means engineering time spent on fixes instead of actual testing.