Argos does one job: it catches visual regressions. It captures screenshots in your CI, compares them pixel by pixel against approved baselines, and surfaces visual changes for review before they ship. For teams that need reliable visual diffing, it does that job well.
But visual diffing is only one part of test reporting. When a Playwright test fails for a functional reason, you still need the full picture: the trace, the error grouping, the flaky-rate history, the coverage, and a place to manage your test cases. Argos is built around visual regression, not full test reporting and intelligence.
Teams that run Playwright in CI and want failure analysis, flaky detection, test management, and reporting depth on top of visual testing often look for Argos alternatives that treat test reporting as the primary workflow.
Here are the 9 best Argos alternatives to consider in 2026.
Best Argos Alternatives: How to Choose the Right Tool
We evaluated each tool on test reporting depth, failure analysis, flaky test detection, Playwright support, CI/CD integration, pricing transparency, and ease of onboarding. We also checked G2 reviews and official documentation to verify each claim, and we limited each competitor to its test reporting and analytics capabilities.
How to Compare Argos Alternatives
Here is a quick comparison of the top alternatives to Argos to help you identify your preferred test reporting tool:
 TestDino |  Argos |  ReportPortal |  BrowserStack |  BuildPulse | |
|---|---|---|---|---|---|
| PricingLowest paid plan, per the listed billing terms. | $39/month (billed annually) | Free / $100/month (Pro, usage-based) | $599/month (SaaS) | Free / $299/month (Pro) | $119/month |
| Best for | Playwright test intelligence & management | Visual regression testing | Reporting with history and clustering | Cross-browser testing teams | Flaky test detection & CI noise reduction |
| Playwright integration | Native (trace viewer, error grouping, MCP) | Via SDK (screenshots) | Via agents | Via SDK | Via JUnit XML |
| One-step CI setup | One reporter line, streams live | SDK + reporter config | Reporter upload | ||
Dashboards & Reporting | |||||
| Unified Playwright dashboard | Visual-focused | Custom widgets | Custom widgets (Pro) | Flaky-focused views | |
| Multi-tab test run detail | Summary, History, AI Insights & more | Visual diff view | Launch-level view | Build-level view | Flaky test detail |
| Pull request insightsSee test results and history for each pull request. | Visual checks on PRs | Per-PR coverage | |||
| Test ExplorerBrowse tests as a hierarchy, a flat list, or by tag. | Launch tree | ||||
| Real-time streaming | Per-shard/worker | ||||
| Scheduled PDF reportsGet report PDFs emailed on a set schedule. | Daily/Weekly/Monthly | Email/Slack alerts | Slack digests | ||
Test Analytics | |||||
| Analytics: trends & patterns | Visual change trends | Widget-based | Build trends and stability | Flaky trends | |
| Code coverage, per-file | Istanbul, run-level | Coverage trends | |||
| Environment analytics | Pass-rate/flaky by env | Per-browser/device | Via attributes | ||
Debugging & Evidence | |||||
| Built-in Playwright trace viewer | Stores traces | ||||
| Screenshots & video replay | Embedded | Screenshots only | |||
| Console logs | Node + browser | If attached | Session logs | ||
| Visual diff comparison | Core feature | ||||
| Smart error grouping | Message/stack/location | Pattern matching | Unique error analysis | Failure patterns | |
| Flaky detectionSpot tests that pass and fail inconsistently, with a stability score. | Visual flakiness | Requires config | |||
| Playwright tags & annotations | Priority/owner/links/metrics | Tag filtering | Custom attributes | Smart tags | |
CI/CD Optimization | |||||
| GitHub CI Checks quality gates | Per-env + mandatory tags | Visual status checks | Build verification rules | Merge gating | |
| Branch → environment mappingMatch each Git branch to the environment it runs against. | Exact/regex | ||||
| Sharded / parallel run support | Per-shard live view | Parallel launches | Via JUnit | ||
| Native CI breadth | GitHub, GitLab, Azure DevOps, TeamCity, Bitbucket, CircleCI, Jenkins | GitHub, GitLab | Agents/plugins | CI plugins | GitHub, CircleCI, Buildkite, Jenkins, Bitbucket |
| Self-managed GitLab | |||||
Test Management | |||||
| Test case management | |||||
| Bulk test creationGenerate many test cases at once from PRDs, Jira, or user stories. | via MCP | ||||
| Release trackingGroup test results by release, cycle, or sprint. | |||||
| Exploratory / manual sessions | |||||
| Import / export test cases | JSON/CSV/ZIP | Via API | |||
AI & Automation | |||||
| Local MCPLet AI coding assistants in your editor act on test data directly. | Cursor/Claude Code/Copilot | Limited scope | MCP server | ||
| Remote MCPLet web-based AI tools query your test data. | |||||
| AI test run summary on GitHub PRs | |||||
| AI test suite auditAI scores your test suite and gives a downloadable report. | |||||
| AI failure classification | ML-based auto-analysis | Failure reason tagging | Flaky ranking | ||
Integrations & Collaboration | |||||
| Bug tracking breadth | Jira, Linear, Asana, monday | Slack alerts | Jira, Rally | Jira | Jira |
| Slack notifications | App + webhooks | ||||
Platform & Security | |||||
| Public API & CLIs | REST + @testdino/playwright | REST API + CLI | REST API | REST API | REST API + CLI |
| Project-level AI controls | Per-feature toggles | ||||
| Compliance & certifications | ISO 27001, SOC 2 Type II, GDPR | SOC 2, GDPR | Self-managed (your infra) | ISO 27001, SOC 2 Type II | Not published |
Plans & Pricing | |||||
| Plan tiers | Free · Pro $39 · Team $79 · Enterprise | Hobby free · Pro $100 · Enterprise | OSS free (self-hosted) · SaaS $599 · Enterprise | Free · Pro $299 · Enterprise | Startup $99 · Team $249 · Growth $499 · Enterprise |
| Free executions | 5,000/mo | 5,000 screenshots | Unlimited (self-host) | Varies | Free trial |
| Support | Chat + Slack Connect + Priority email | Email + community | Community / Paid | 24/7 email | Email + Slack |
| Try for free | Learn more | Learn more | Learn more | Learn more | |
Best Argos Competitors for Test Reporting
Here are the top 9 alternatives to Argos for teams that want deeper test reporting:
1. TestDino
Best for:
Playwright-first teams that need test reporting, test management, and CI/CD optimization in one platform, without stitching multiple tools together.
Platform Type:
Test reporting, dashboards, test management, and CI observability platform for Playwright.
Integrations with:
GitHub Actions, GitLab CI, Azure DevOps, TeamCity, Jira, Linear, Asana, monday, Slack.
Key Features:
 Test management and automated reporting in one place
- AI failure classification into 4 categories
- Built-in trace viewer with DOM snapshots and network logs
- Error grouping by message and stack trace
- GitHub CI Checks as merge quality gates
- MCP Server for AI agent queries from your IDE
- Flaky test detection across run history
- AI summaries posted to GitHub commits
- Real-time results streaming via WebSocket
- Code coverage per file breakdown

Pros
- Playwright-native with under 10-minute setup
- Test management and automated reporting on the same platform
- Broad CI/CD support: GitHub Actions, GitLab CI, Azure DevOps, TeamCity
- AI summaries posted to GitHub commits, GitLab MRs, and Slack
- 1-click bug filing into Jira, Linear, Asana, or monday
- Affordable at $39/month billed annually

Cons
- Purpose-built for Playwright (multi-framework support on the roadmap)
First-Hand Experience with TestDino
Here is where teams hit a wall with visual testing tools: they catch what changed on screen, but not why a test failed or whether it is reliable. When a Playwright test fails for a functional reason, a screenshot diff does not tell you if it is a real bug, a flaky test, or a UI change, and it does not manage your test cases. Argos is built around visual regression, not full test reporting and intelligence.
TestDino takes a broader approach. It is built around Playwright test intelligence. Test management and automated test reporting live on the same platform, with suites, ownership, custom fields, and version history. Playwright results flow in from CI and link to manual tests in the UI, and visual diffs sit alongside failure analysis, flaky detection, and traces.
The Test Explorer lets you sort by flaky rate, filter by tags, and see exactly which manual tests have automated coverage. Every feature helps Playwright teams debug faster and ship with confidence.
Debugging That Saves You from Re-running Locally
Each failed test in TestDino comes with screenshots, video, browser console logs, and a trace you can step through action by action, available right after the CI run finishes.
AI Insights classifies each failure as an Actual Bug, a UI Change, an Unstable Test, or Miscellaneous. Bug filing is 1-click into Jira, Linear, Asana, or monday, pre-filled with error details, stack trace, failure history, and links to the run and CI job.
CI/CD Speed and Merge Safety
Each shard reports as its tests finish. History persists across different CI runners.
GitHub CI Checks adds quality gates to your PRs. Set a minimum pass rate, mark critical tags as mandatory, and configure different rules per environment. AI-generated summaries are posted to GitHub commits and GitLab merge requests with pass/fail/flaky counts.
Flaky Test Detection That Tells You Why
Flaky test detection classifies unstable tests by root cause: timing-related, environment-dependent, network-dependent, or assertion-intermittent. Each test gets a stability percentage, and you can compare flaky rates across environments to spot infrastructure problems.
Real-Time Streaming and Scheduled Reports
Results appear on the dashboard as each test completes via real-time streaming, not after the full suite finishes. Automated PDF reports deliver test health summaries on daily, weekly, or monthly schedules. Slack notifications send run summaries filtered by environment and branch.
MCP Server for AI-Assisted Workflows
The MCP Server connects your AI assistant to your test data. List test runs, pull debugging context, perform root cause analysis, and manage manual test cases through natural language. It covers both automated debugging and test management without switching tools.
Pricing & Value
Pricing may vary. Check the pricing page for the latest details.
Final Verdict: TestDino vs Argos
TestDino is the strongest Argos alternative for Playwright teams that want more than visual diffs. Where Argos focuses on visual regression, TestDino covers the full picture: AI failure classification, a built-in trace viewer, error grouping, visual diff comparison, and flaky detection with root-cause categories and stability percentages.
It also adds test management, automated PDF reports, and GitHub CI Checks as quality gates.
At $39/month billed annually with flat pricing, it gives Playwright teams a complete reporting and debugging workspace, with visual testing included, not a single-purpose tool.
2. ReportPortal
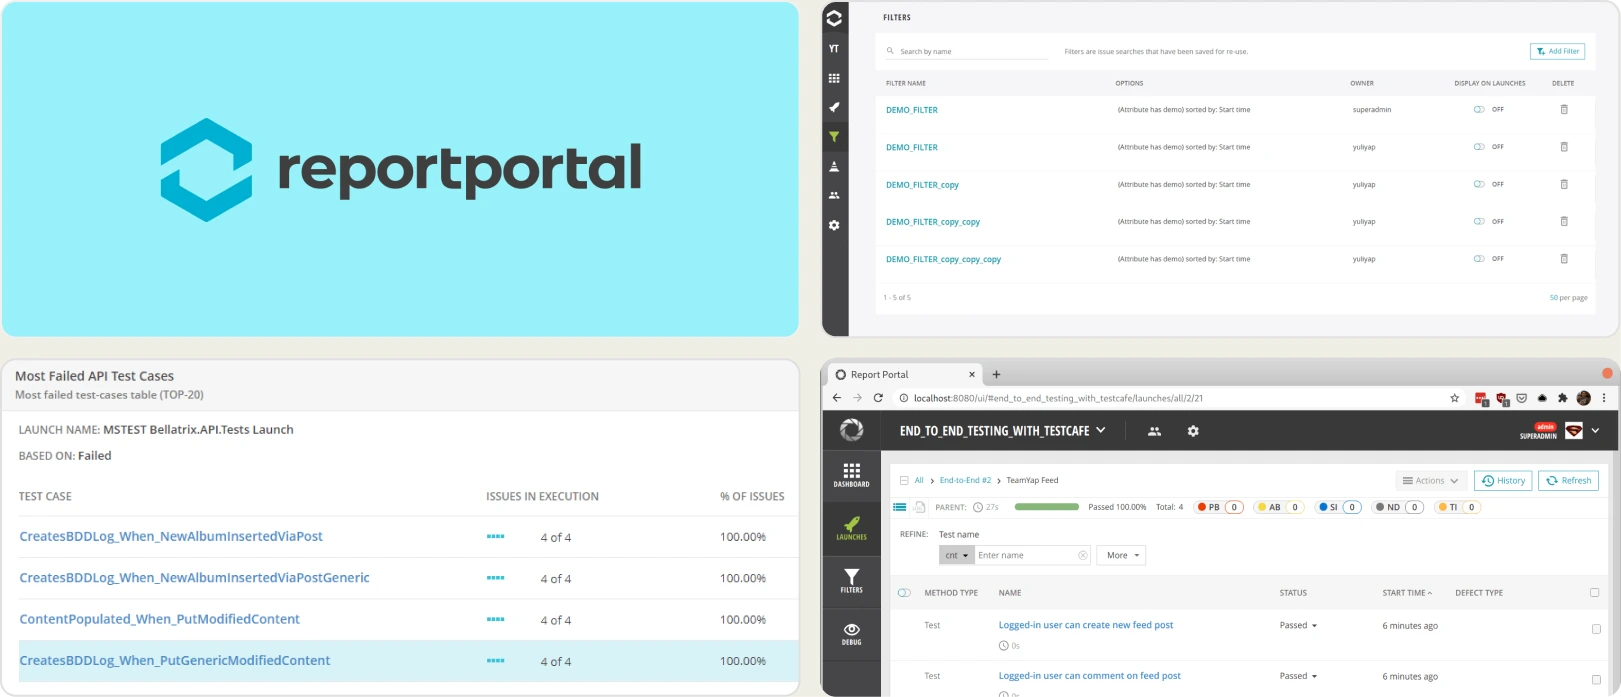
Best for:
Teams that want self-hosted, open-source test reporting with ML-based failure clustering.
Platform Type:
Open-source test reporting and analytics platform (self-hosted or SaaS).
Integrations with:
Jenkins, GitHub, GitLab, Jira, Rally.
Key Features:
- ML-based pattern matching for recurring failure clusters
- Custom dashboard widgets for pass and fail run trends
- Defect-type classification for triaging logged failures
- Multi-framework result aggregation in one dashboard
- Launch-level run history for cross-run trend comparison
Pros
- Open source and self-hostable with full control of your data
- ML pattern matching clusters recurring failures automatically
- Custom dashboard widgets and multi-framework aggregation
Cons
- Self-hosting needs Docker, multiple services, and ongoing upkeep
- Managed SaaS starts at $599/month, steep for small teams
- No Playwright trace viewer; ML needs accumulated run history
First-Hand Experience
ReportPortal aggregates results from multiple frameworks into a single dashboard and uses ML-based pattern matching to cluster recurring failures. The self-hosted, open-source option gives full control of your data.
In practice, running it means standing up several services and maintaining them over time, and the ML analysis works best once it has accumulated an extensive history. Teams that want a managed, Playwright-specific reporting workspace may find the operational overhead high relative to the reporting they get.
Pricing & Value
Free and open source when self-hosted. The managed SaaS starts at $569/month billed quarterly for the Startup tier with 100 GB of storage, with higher tiers and custom Enterprise pricing available.
Final Verdict
ReportPortal suits teams that want self-hosted, open-source reporting with ML-based failure clustering. For teams that prefer a managed platform with Playwright-native debugging and faster setup, there are lighter options without the infrastructure burden.
3. BrowserStack Test Reporting & Analytics
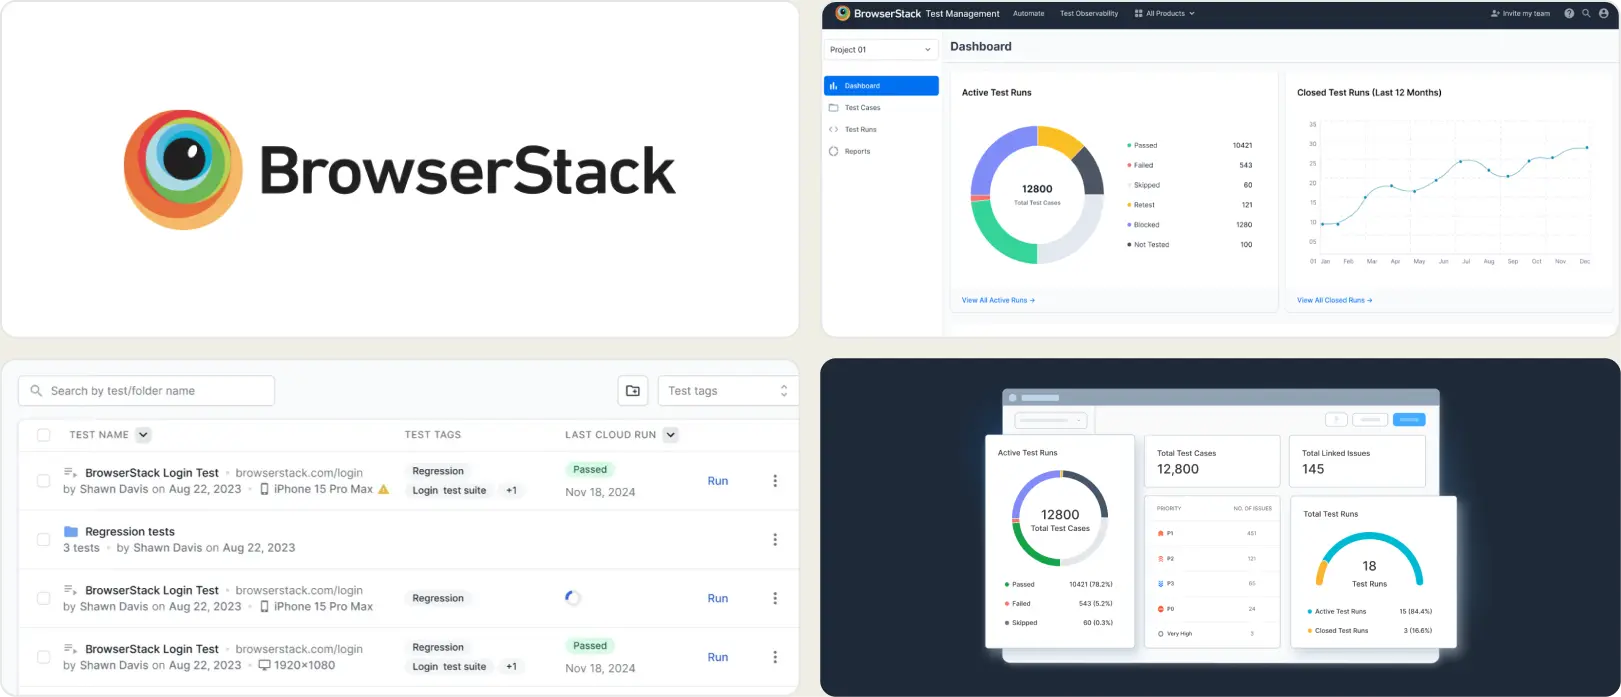
Best for:
Teams already on BrowserStack that want reporting in the same place where they run tests.
Platform Type:
Test reporting and analytics module inside the BrowserStack platform (formerly Test Observability).
Integrations with:
Jenkins, Azure Pipelines, GitLab, Jira, Slack.
Key Features:
- Automatic flaky and new-failure detection per build
- AI failure categorization by bug, automation, or environment
- Test health and stability trend dashboards over time
- Timeline debugging with logs, traces, and screenshots
- Quality gates enforced through GitHub pull-request checks
Pros
- Automatic flaky detection and AI failure categorization
- Build health and stability trend dashboards across projects
- Ingests Playwright results from your own CI via an SDK
Cons
- Reporting is one module inside a large execution-cloud platform
- Pricing scales with the broader platform and is steep for small teams
- No Playwright-native trace viewer for step-level debugging
First-Hand Experience
BrowserStack Test Reporting & Analytics adds smart reporting to test runs, with automatic flaky-test detection, AI failure categorization, and build-health trends. It can ingest Playwright results from your own CI through an SDK.
The reporting itself is solid, but it is a single module within a large cross-browser execution platform, so it is most natural for teams already standardized on BrowserStack. Debugging happens through BrowserStack's own timeline and logs rather than a Playwright-native trace viewer.
Pricing & Value
BrowserStack offers a free tier, with the Pro plan at $299/month and custom Enterprise pricing. Test Reporting & Analytics is included within the BrowserStack platform plans rather than priced separately.
Final Verdict
BrowserStack Test Reporting & Analytics is a reasonable fit for teams already on BrowserStack that want reporting in the same place they run tests. For Playwright-first teams that want a dedicated reporting workspace with a built-in trace viewer, a focused tool is a closer match.
4. BuildPulse
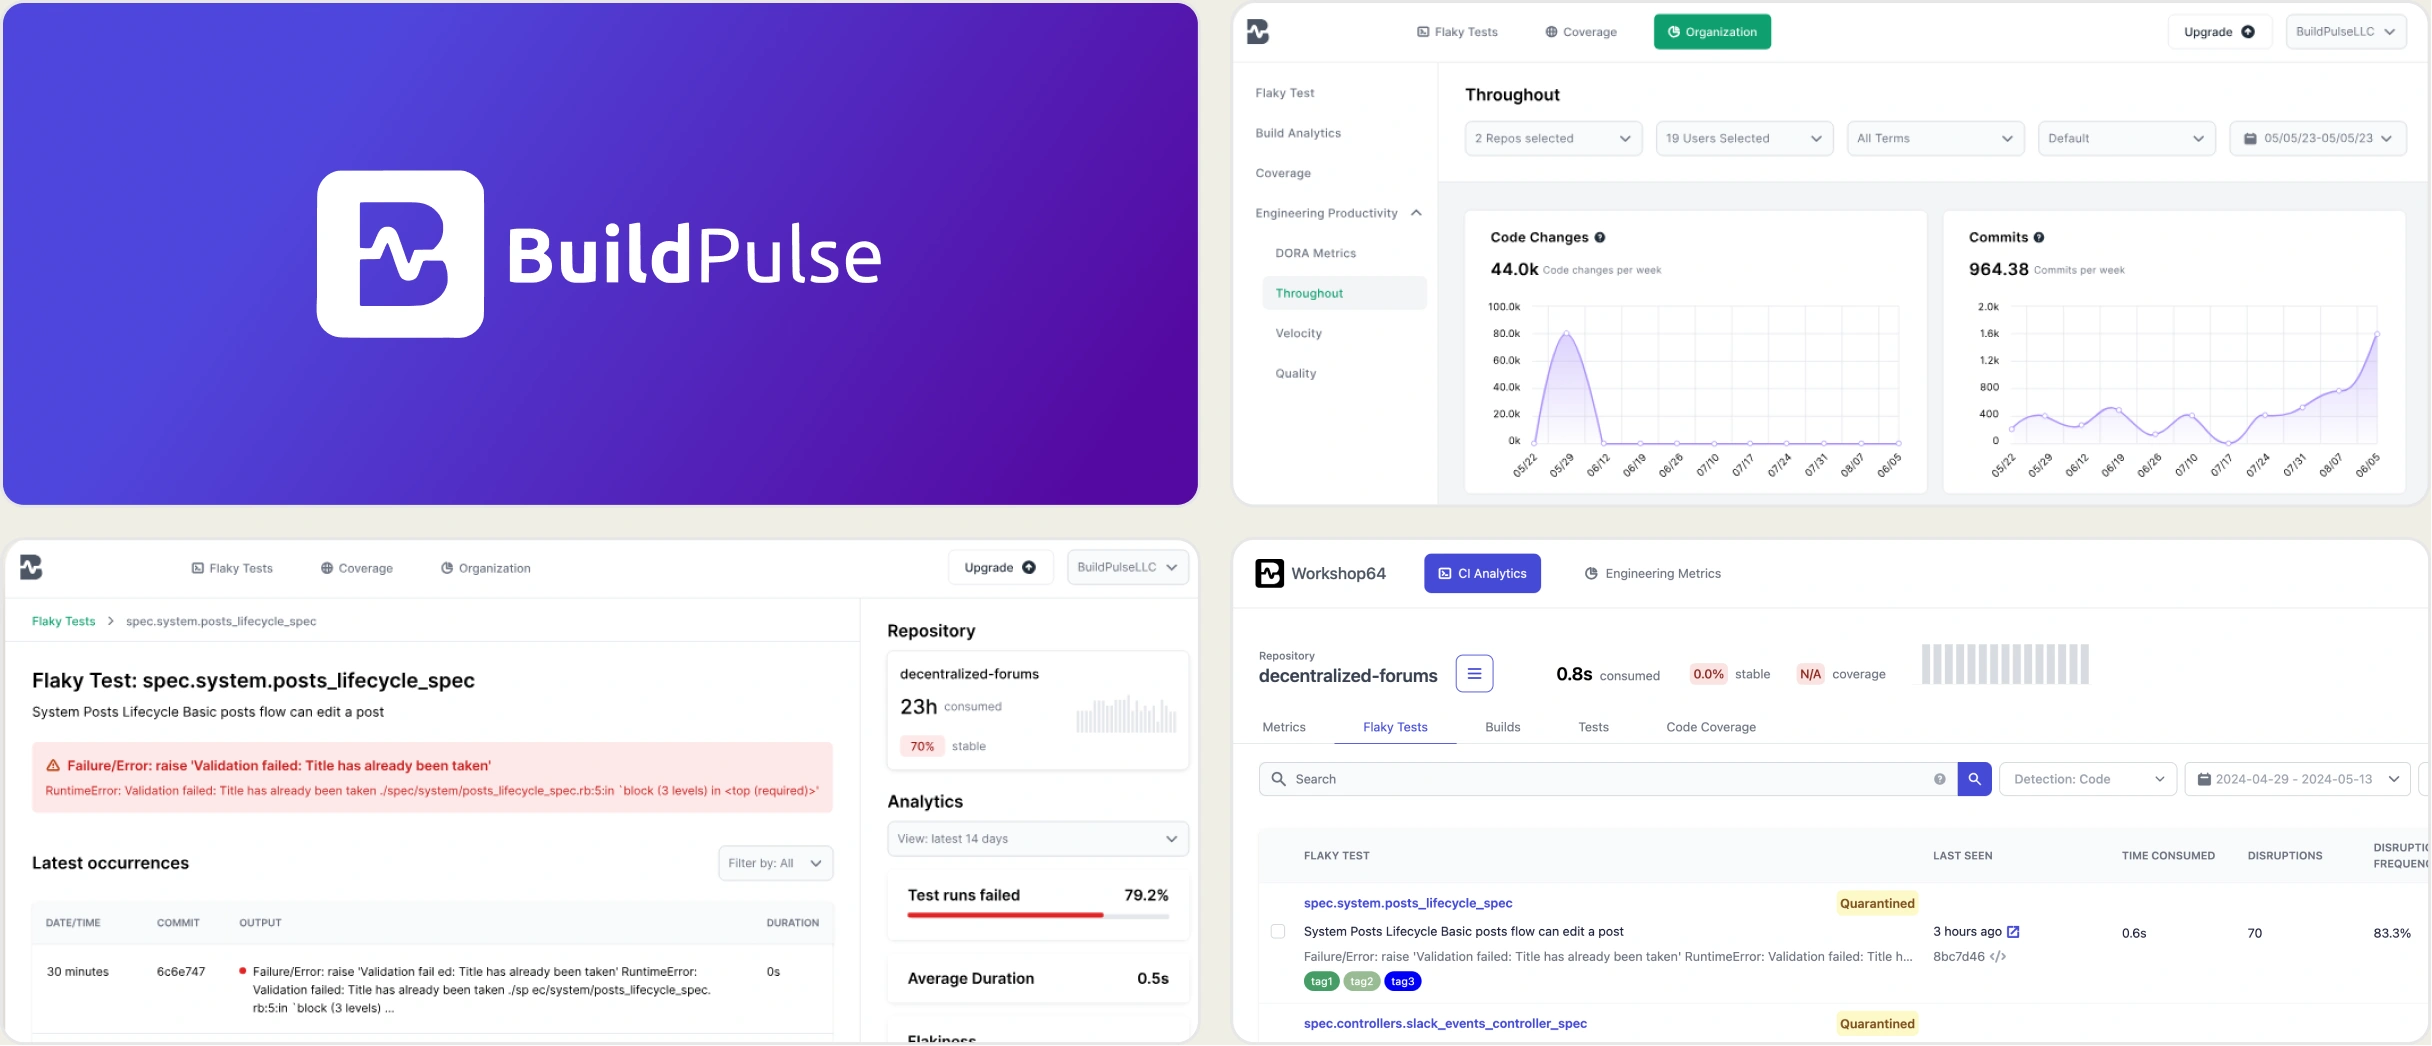
Best for:
Teams that want fast, focused flaky-test detection and quarantine in CI.
Platform Type:
Flaky-test detection and CI test analytics platform.
Integrations with:
GitHub, CircleCI, Buildkite, Jenkins, Bitbucket, Jira, Slack.
Key Features:
- Automatic flaky test detection across all CI builds
- Quarantine flaky tests so they stop blocking merges
- Flaky test ranking with failure patterns and history
- CI and test-health trend dashboards per repository
- Daily Slack alerts ranking the flakiest tests in CI
Pros
- Fast setup with automatic flaky detection from the first build
- Effective at cutting flaky-test noise and CI disruption
- Cost-effective flat monthly pricing scaled by test volume
Cons
- Focused on flakiness; no full test-run reporting or trace viewer
- No test case management or manual testing support
- Playwright is supported via JUnit XML, not a native reporter
First-Hand Experience
BuildPulse connects to your CI and automatically detects, ranks, and quarantines flaky tests so they no longer block merges. For teams drowning in flaky-test noise, it does that one job well, with fast setup and clear Slack alerts. The trade-off is scope: it reports on flakiness and CI health, not full per-test results, failure analysis, or debugging evidence. Teams that want a complete reporting and debugging workspace will find it focused on a single signal.
Pricing & Value
Starts at $99/month (Startup), then scales to $249/month (Team) and $499/month (Growth), billed based on test volume. A free trial is available.
Final Verdict
BuildPulse is a strong fit for teams whose only pain point is flaky tests that block CI. For Playwright teams that also want test-run reporting, a trace viewer, and test management, a broader platform covers more of the workflow.
5. TestMu AI (formerly LambdaTest)
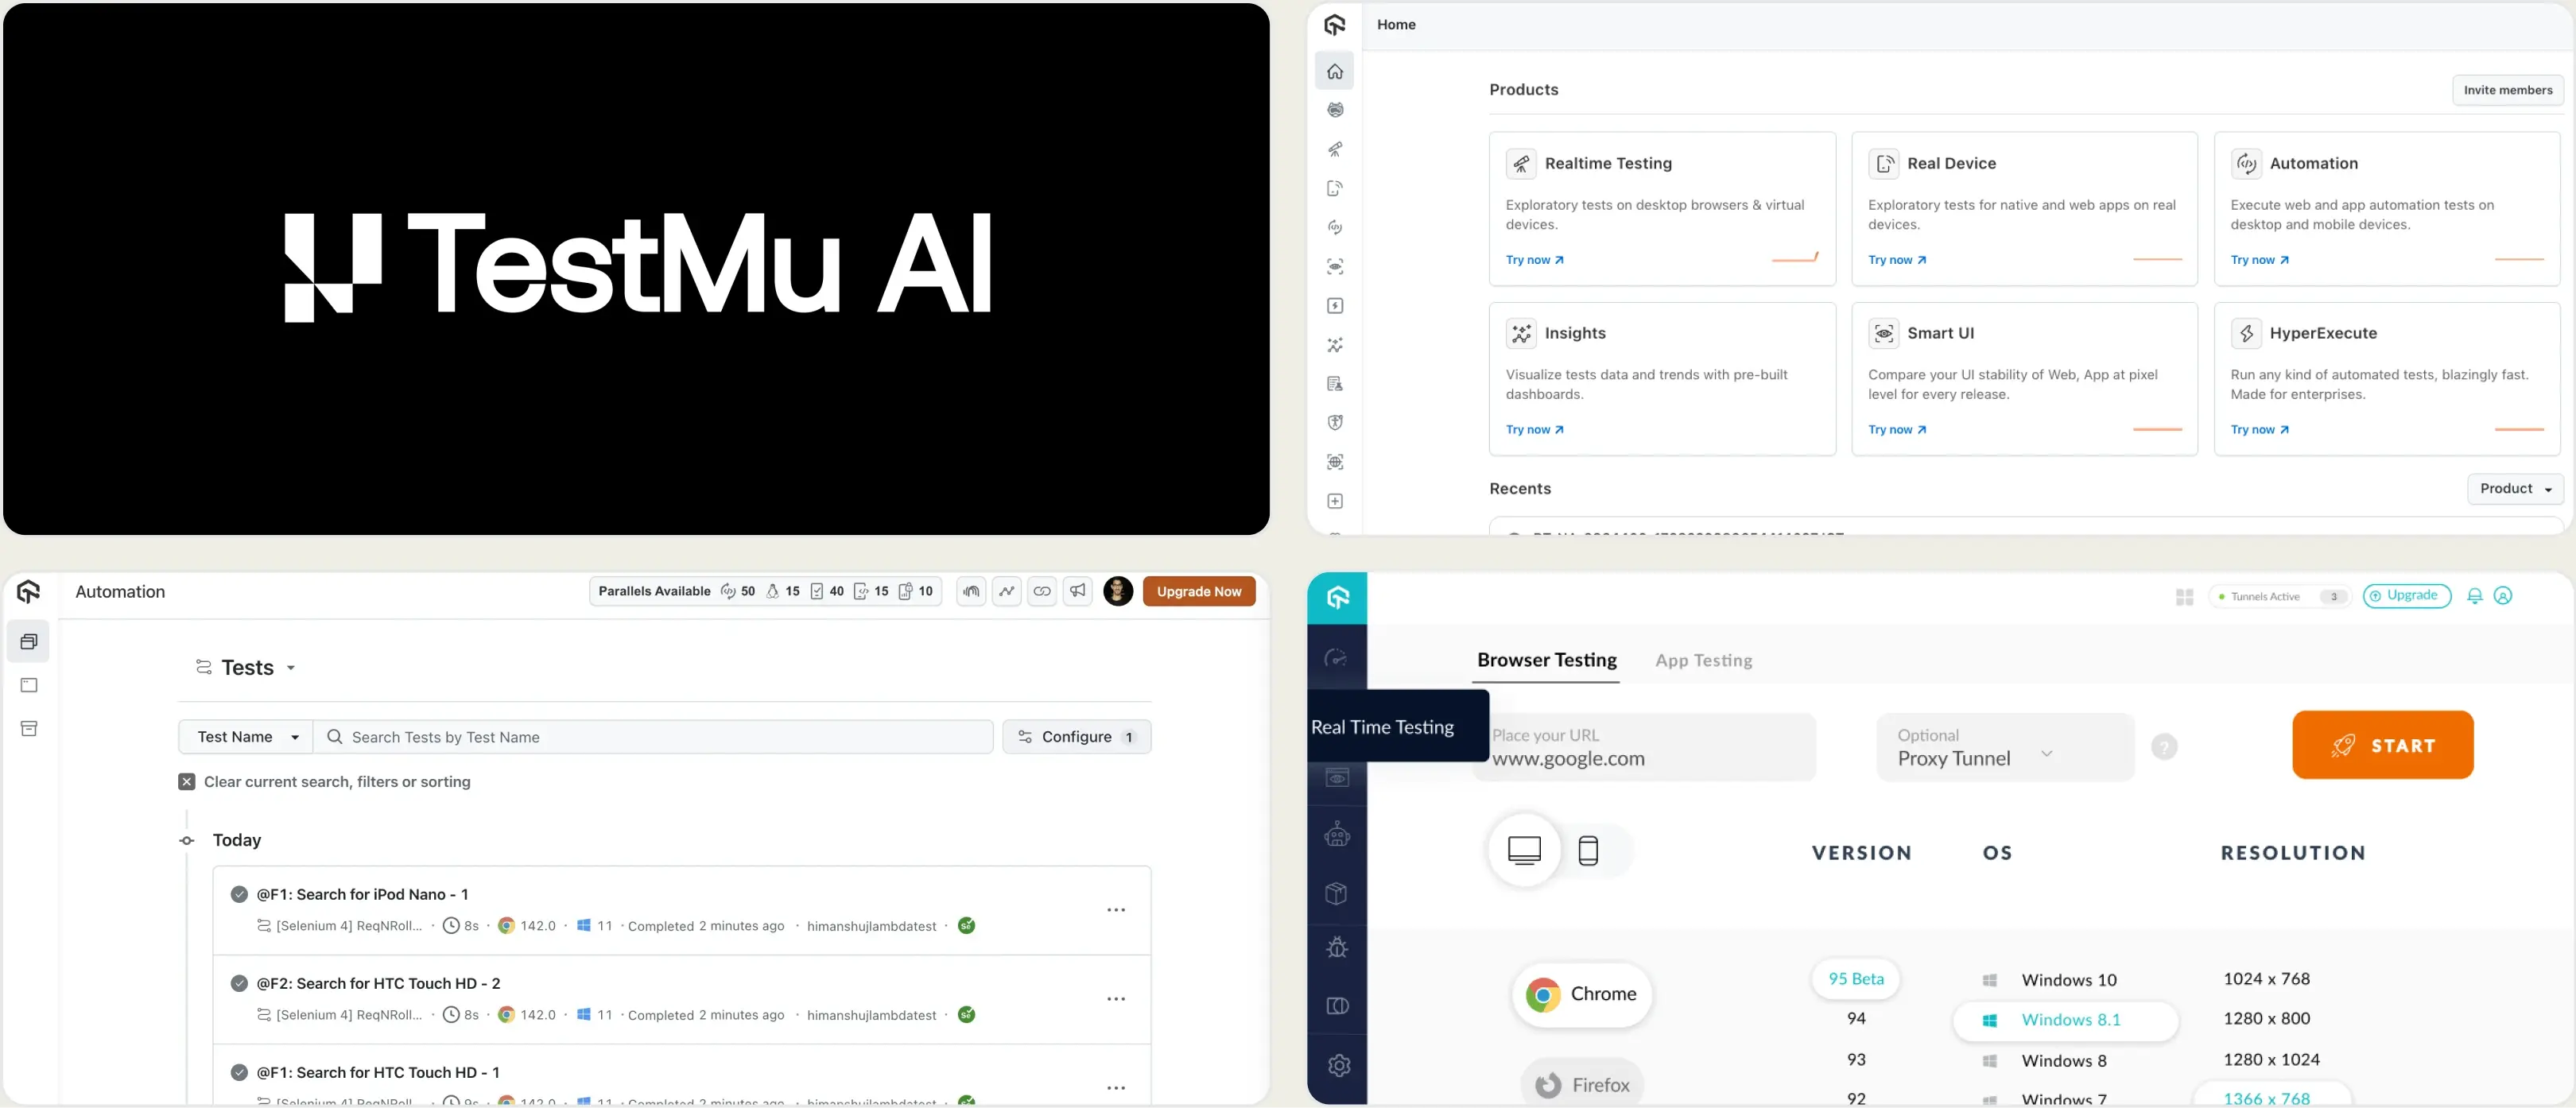
Best for:
Teams running cloud test execution that want built-in execution analytics.
Platform Type:
Cloud test execution platform with a test analytics module.
Integrations with:
Jira, Slack, GitHub, GitLab, CI/CD pipelines.
Key Features:
- Unified test execution overview across environments
- Custom dashboards built from 30+ reporting widgets
- Flaky test flags with flakiness trend analysis charts
- Video recordings, screenshots, and per-test console logs
- Real-time dashboard sharing with CSV and PDF export
Pros
- Unified dashboards with rich pass/fail and trend metrics
- Video, screenshots, and console logs captured per test
- Free tier available to start with execution analytics
Cons
- Reporting is secondary to the cloud execution platform
- Playwright-specific analytics stay relatively surface-level
- Costs scale with parallel tests and concurrency, not reporting
First-Hand Experience
TestMu AI centralizes test execution data in real-time dashboards, with custom widgets, pass/fail and flakiness trends, and video, screenshots, and console logs captured for each test. For teams running tests on its cloud, the analytics cover the essentials and are easy to share.
Reporting is one module inside a larger cloud execution platform, though, so the depth is tuned to execution-level data. Playwright-specific analysis stays relatively surface-level compared with a purpose-built Playwright reporting tool.
Pricing & Value
A free tier is available, with paid plans from $199/month. Test analytics is included in the plans rather than sold separately, and the overall cost scales with the number of parallel tests and concurrency.
Final Verdict
TestMu AI is for teams that want cloud-based execution with built-in analytics. For teams focused on Playwright test intelligence and depth of reporting, evaluate whether an execution-first platform meets your analytics needs.
6. Datadog Test Optimization
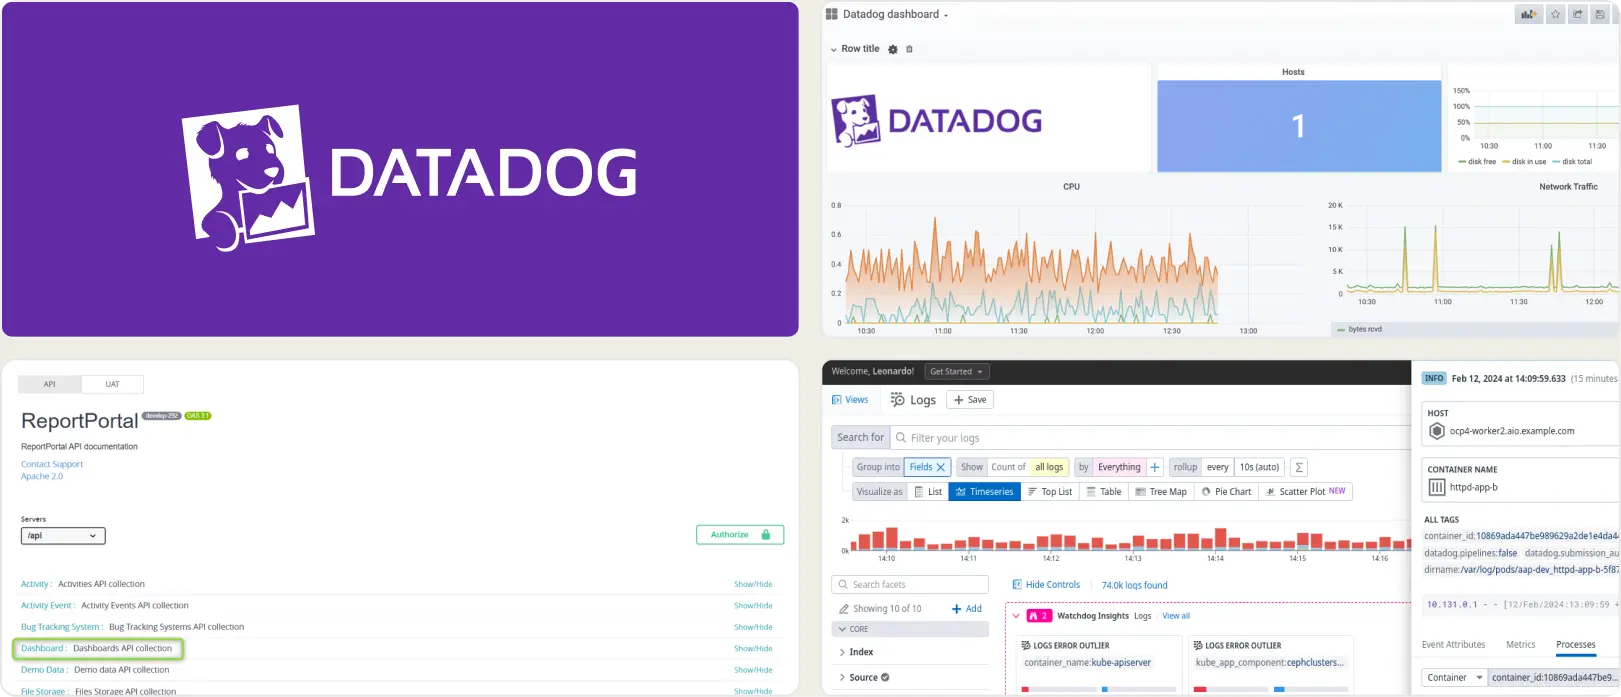
Best for:
Teams already in Datadog that want test-run visibility alongside their other monitoring data.
Platform Type:
Test reporting and analytics module inside the Datadog monitoring platform.
Integrations with:
Major CI providers, Jira, Slack.
Key Features:
- Test run visibility at session, suite, and test level
- Flaky test detection with historical flakiness tracking
- Test traces and spans for every CI test execution run
- Branch-level test history with Git author and CI metadata
- Dashboards, notebooks, and CI test monitors with alerts
Pros
- Strong end-to-end tracing of test runs inside CI pipelines
- Flaky tests and performance regressions surfaced automatically
- Fits teams already standardized on the Datadog platform
Cons
- Test data sits inside a broad monitoring platform, not a test tool
- Per-committer plus usage pricing is hard to forecast as CI scales
- No built-in Playwright trace viewer or test case management
First-Hand Experience
Datadog Test Optimization brings test runs into the same platform teams already use for monitoring. Each test is captured as a trace, with flaky-test detection and branch-level history available in dashboards. The trade-off is that test results sit alongside infrastructure and application data, so getting a test-focused view means working inside a platform built for broad monitoring. For Playwright teams that mainly want test reporting and debugging, that is more surface area than the job needs.
Pricing & Value
Test Optimization is billed per active Git committer, starting at $20/committer/month billed annually, plus usage-based charges for test spans. Costs grow with team size and test volume.
Final Verdict
Datadog Test Optimization is for teams already invested in Datadog who want test visibility alongside their other telemetry. For Playwright-first teams that want focused reporting, a built-in trace viewer, and flat pricing, a dedicated tool gets to value faster.
7. Testomat.io
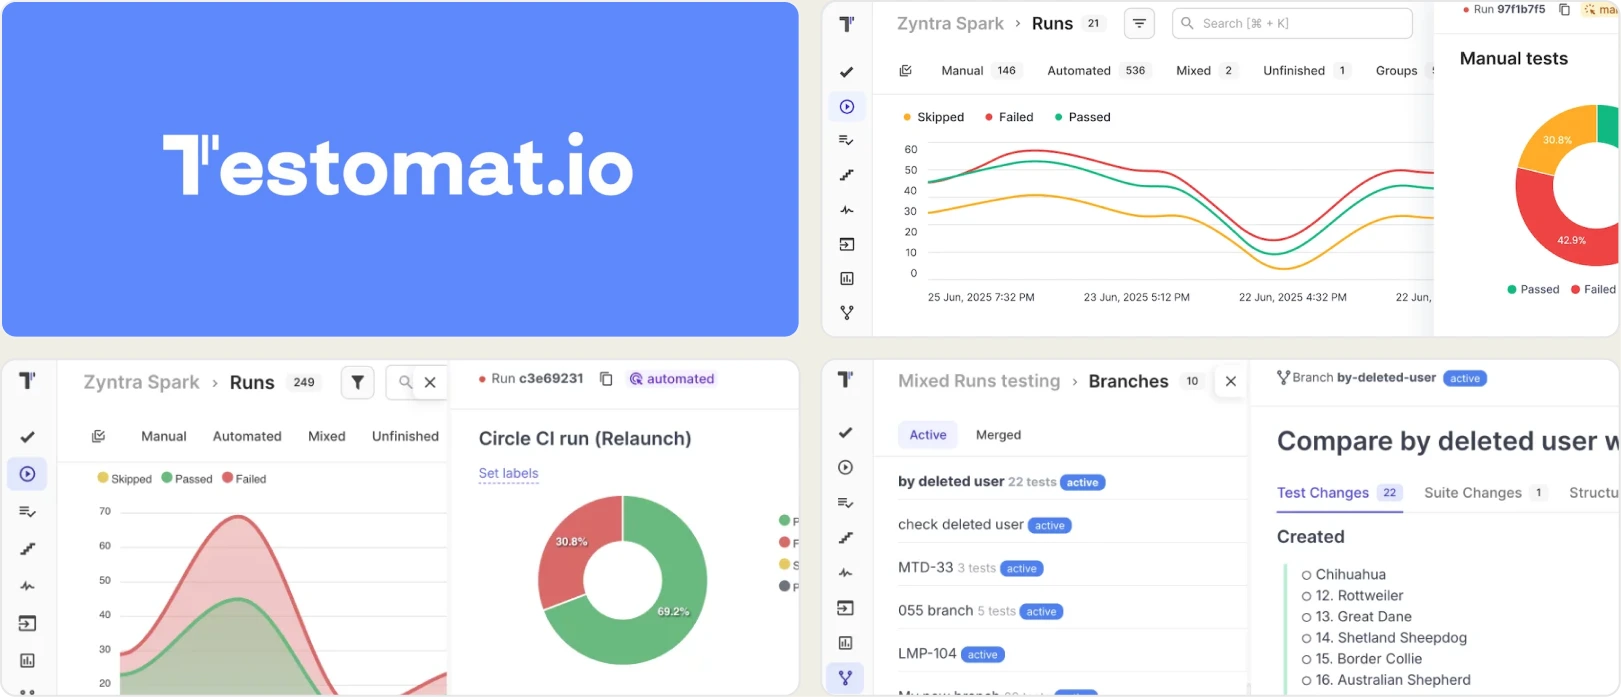
Best for:
Teams that want test management and run reporting for manual and automated tests in one place.
Platform Type:
Test management platform with integrated run reporting and analytics.
Integrations with:
GitHub, GitLab, Jenkins, Azure DevOps, CircleCI, Jira, Slack.
Key Features:
- Automated test-run reporting with live run status updates
- Native Playwright reporter plus direct JUnit XML import
- Analytics dashboard for pass/fail and coverage trends
- Flaky test detection from run history and patterns
- Traceability from run results back to managed test cases
Pros
- Manual and automated test cases managed in one platform
- Clean UI with fast onboarding and strong CI integration
- Affordable per-user pricing with a free-forever tier
Cons
- Test-management-first; reporting is tied to the test-case model
- No built-in Playwright trace viewer (traces need your own S3)
- Setup needs reporter config, IDs, and API key wiring
First-Hand Experience
Testomat.io manages manual, automated, and BDD test cases in one place and layers run reporting and analytics on top. Playwright results import through a native reporter, with live run status, pass/fail trends, and flaky detection from run history.
The reporting is organized around its test-case model, so the most value comes once tests are imported and linked. For teams that want test management alongside reporting, that structure helps; for teams that want to view raw Playwright output with deep debugging, it adds a layer, and there is no built-in trace viewer.
Pricing & Value
Free forever for small teams (2 users, 2 projects). The Professional plan is $30 per user/month, or $27 per user/month billed annually. Enterprise is custom.
Final Verdict
Testomat.io suits teams that want test case management and run reporting in one platform. For Playwright-first teams focused on reporting depth and trace-level debugging, a purpose-built reporting platform is a closer match.
8. Buildkite Test Engine
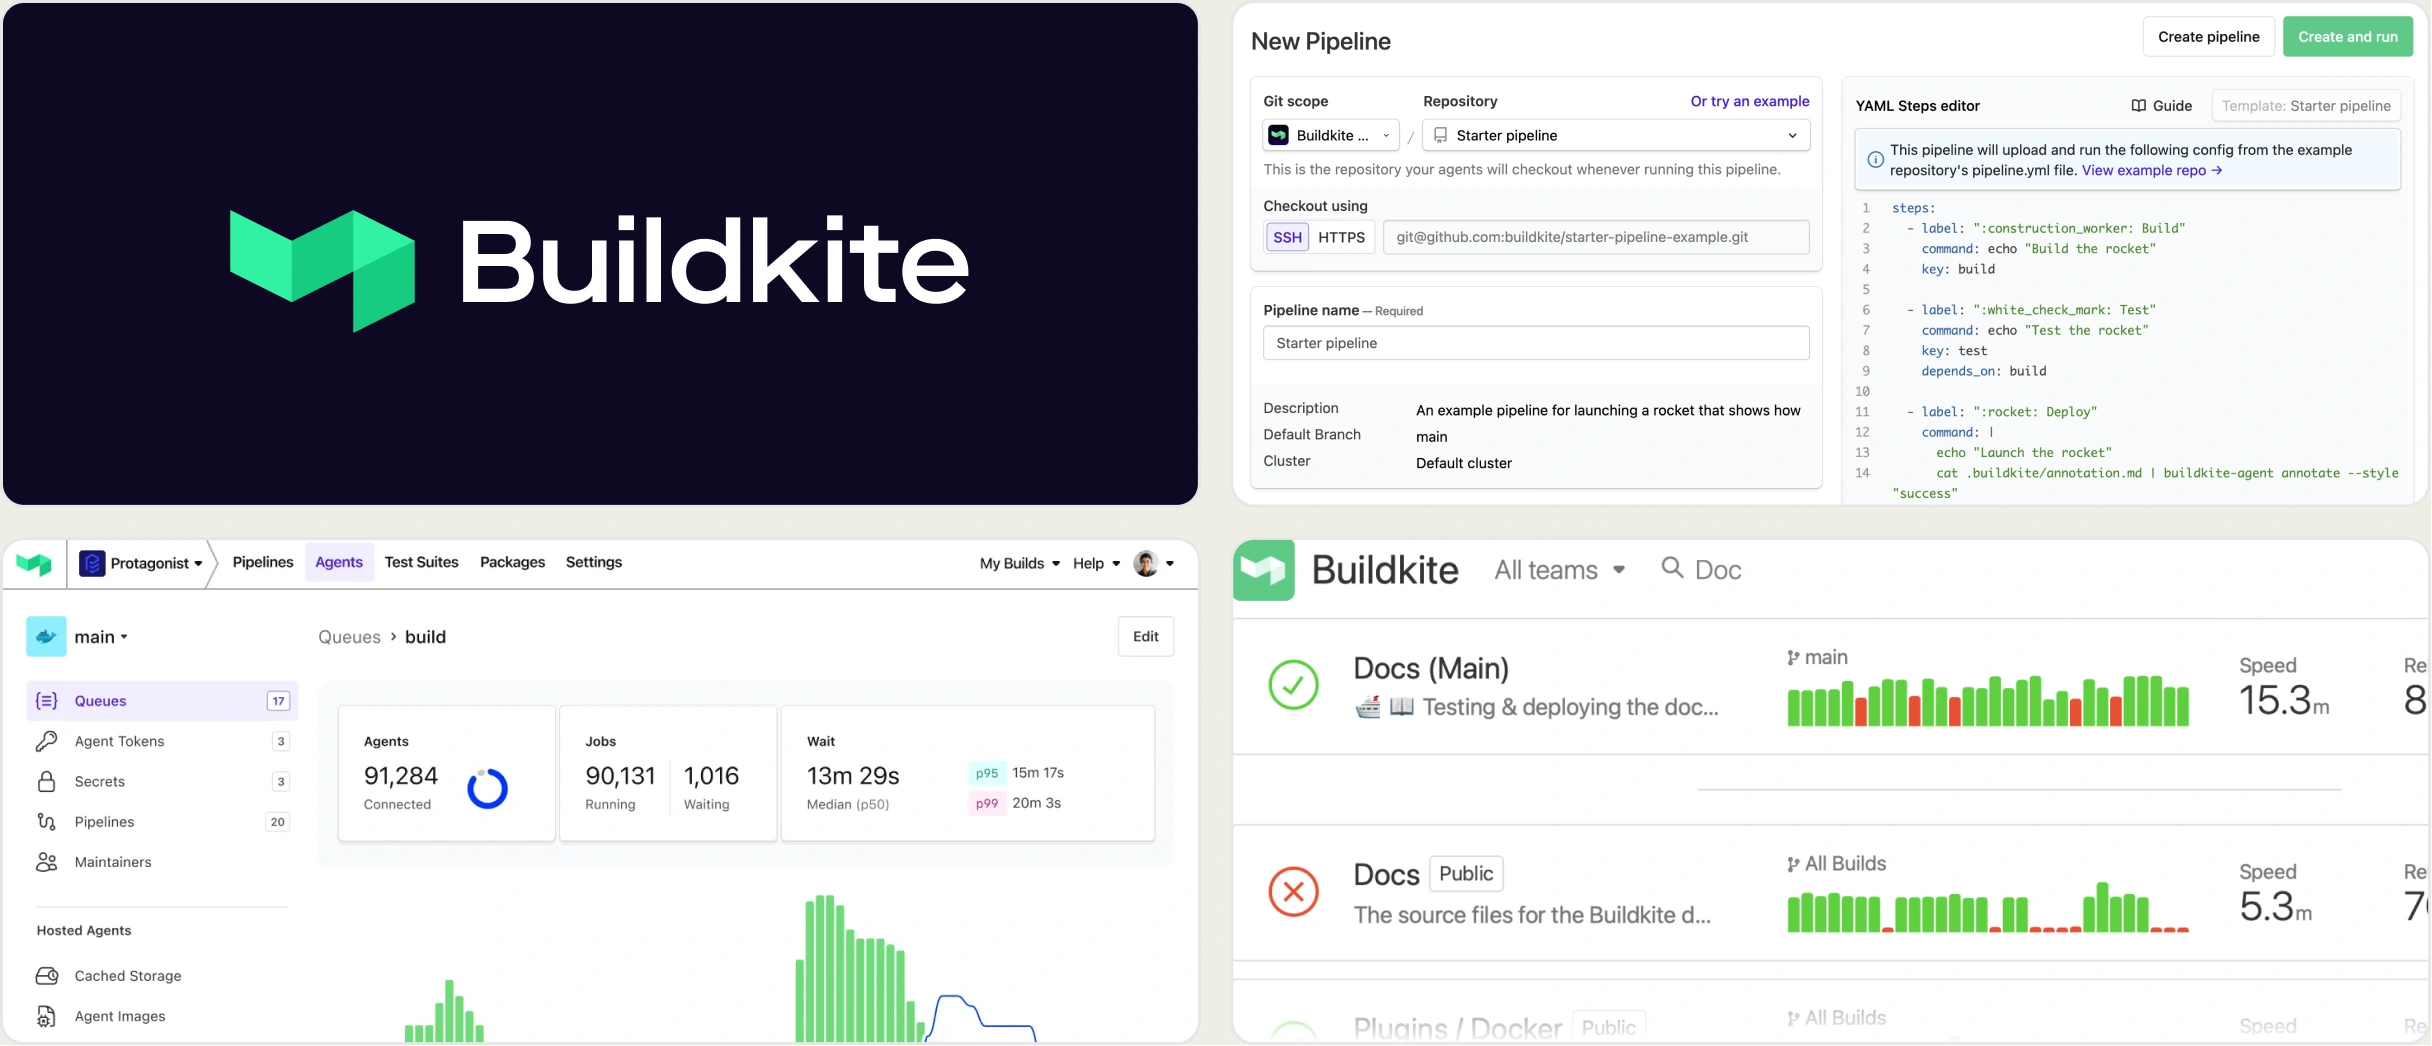
Best for:
Teams in the Buildkite ecosystem that want test-suite analytics and flaky-test management.
Platform Type:
Test reporting and analytics module within the Buildkite platform (formerly Test Analytics).
Integrations with:
Buildkite Pipelines, GitHub Actions, Jenkins, CircleCI, Slack.
Key Features:
- Test result collection across unit, integration, and e2e
- Flaky test detection with auto-quarantine workflows
- Test suite performance and slow-test reliability insights
- Per-test execution history with timing and duration trends
- Broad framework support, including Playwright and JUnit
Pros
- Strong flaky-test detection and quarantine workflows
- CI-agnostic ingestion from any pipeline, not just Buildkite
- Per-user pricing with a free tier and unlimited executions on Pro
Cons
- Oriented to suite analytics, not full Playwright reporting
- No built-in Playwright trace viewer or test case management
- Most value lands for teams already on the Buildkite platform
First-Hand Experience
Buildkite Test Engine collects test results from your pipelines and turns them into suite-level analytics: flaky test detection, auto-quarantine workflows, slow-test insights, and per-test history. It ingests results from any CI, not just Buildkite, and supports Playwright among many frameworks.
The focus is on test-suite performance and reliability rather than a rich per-test Playwright report, so debugging happens through history and timing data rather than a trace viewer. It is strongest for teams already standardizing on Buildkite.
Pricing & Value
A free Personal tier covers 50,000 test executions per month. The Pro plan is $30 per active user/month with unlimited executions and 250 managed tests included, then $0.10 per managed test. Enterprise is custom.
Final Verdict
Buildkite Test Engine is a solid fit for teams on Buildkite that want flaky-test management and suite analytics. For Playwright-first teams that want a built-in trace viewer, failure classification, and test management, a dedicated reporting platform covers more.
9. Allure TestOps
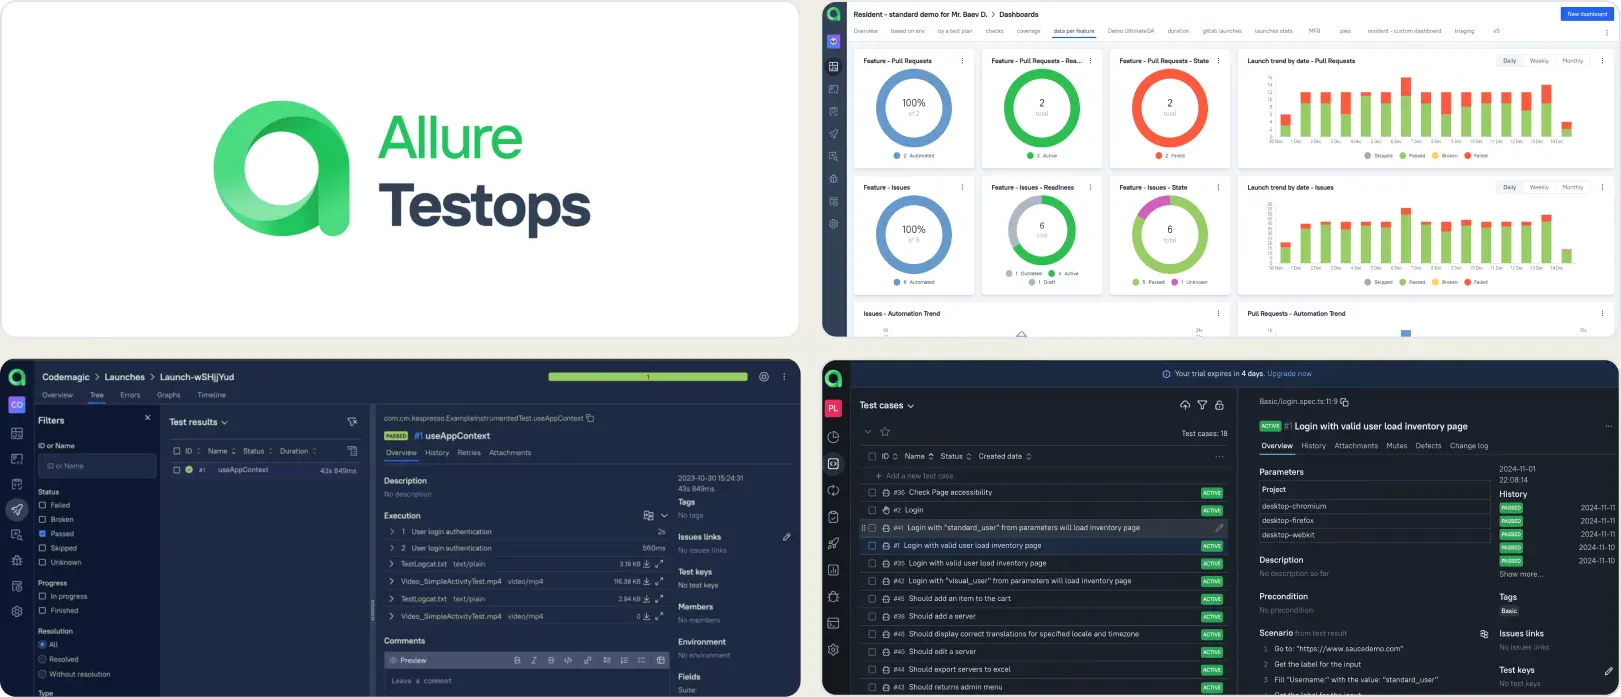
Best for:
QA teams with formal test management processes that need structured reporting workflows.
Platform Type:
Test management and reporting platform.
Integrations with:
Jira, GitHub, GitLab, Jenkins.
Key Features:
- Test case organization with launch history
- CI/CD adapter integrations
- Configurable dashboards via AQL queries
- Access control and permissions
- Report exports and sharing
Pros
- Established feature set for structured QA
- Works across multiple test frameworks
- Configurable dashboards and reports
Cons
- Setup and adapter configuration require effort
- Smaller teams may find the overhead heavy
- Reporting requires manual dashboard building
First-Hand Experience
Allure TestOps provides a structured workspace for organizing test cases and viewing launch results. The platform works best when teams have defined QA processes and the bandwidth to set up adapters and configure dashboards. Teams looking for faster onboarding and built-in failure intelligence may find the configuration effort slows time-to-value.
Pricing & Value
Custom pricing. Targets teams that need formalized test management with governance.
Final Verdict
Allure TestOps fits teams that follow structured QA processes. For teams prioritizing fast setup and focused test analytics, lighter platforms get to value faster.
What to Look for When Moving Beyond Argos for Test Reporting
Switching from, or adding to, Argos is not just about finding another visual tool. Visual diffing is one signal; the tool you pick should treat test reporting as the primary workflow, with the depth to understand a failure end-to-end.
Failure intelligence, not just visual diffs
When a test fails, you need to know whether it is a real defect, a flaky issue, or a UI change. A screenshot diff tells you the pixels changed, but not why a functional test broke. Look for tools that automatically classify failures, group related errors, and separate persistent issues from new regressions. That is the difference between "this looks different" and "here is what to fix."
Debugging evidence in the report
A flaky ranking sends you back to your CI artifacts to find the trace, the screenshots, and the logs. A reporting tool should keep that evidence in one place. A built-in trace viewer, screenshots, video, and console and network logs attached to each failed test save time when re-running tests locally.
Test management without separate tooling
If your test cases live in one tool, execution results in another, and visual checks in a third, you spend more time switching contexts than fixing problems. Argos does not include test case management, so teams using it still need a separate tool to organize suites, track manual coverage, and link cases to automated results. Platforms that combine reporting, debugging, and test management in one workspace remove that overhead.
Coverage and flaky detection across the whole suite
Visual flakiness is only part of the picture. A reporting platform should detect flaky tests across your entire suite, track a stability score per test, and show code coverage per file so you can see where tests are missing. These views tell you which tests to trust and which to fix.
Predictable pricing and broad CI support
Per-screenshot and usage-based pricing can be hard to forecast as your suite grows, and tools that only support GitHub and GitLab limit teams on other CI systems. Flat monthly pricing and broad CI support, across GitHub, GitLab, Azure DevOps, TeamCity, and more, keep costs predictable and onboarding fast from the first run.
Wrapping Up
Argos works well as a focused visual regression tool for teams that mainly want to catch UI changes before they ship. But when test reporting is a primary need rather than a single signal, purpose-built tools provide more depth.
ReportPortal offers self-hosted, open-source reporting with ML clustering. BrowserStack Test Reporting & Analytics covers reporting inside a cross-browser cloud. BuildPulse focuses on flaky-test detection. TestMu AI adds execution analytics. Datadog Test Optimization brings test visibility into a monitoring platform. Testomat.io pairs test management with run reporting. Buildkite Test Engine delivers suite analytics and flaky management. Allure TestOps targets structured QA processes.
For Playwright-first teams that want AI failure classification, a built-in trace viewer, visual diff comparison, test management, flaky detection, and CI/CD optimization in one platform, TestDino combines test intelligence, management, and reporting for $39/month billed annually.
See your test failures explained
Classify every failure by root causeDebug from the trace, not a screenshotFAQs
TestDino is built specifically for Playwright. It provides a built-in trace viewer, AI failure classification, flaky detection with stability percentages, visual diff comparison, and test management for manual and automated tests on a single platform. It also supports GitHub Actions, GitLab CI, Azure DevOps, and TeamCity.