Calliope Pro is a cloud-based DevOps test reporting tool that aggregates raw test data (like JSON and XML) from various frameworks into visual dashboards. It lets teams track test execution histories, collaborate by sharing links, and identify trends in code stability.
But Calliope Pro's test analytics stop at surface-level reporting. Flaky tests are often hard to diagnose without digging into external systems. It lacks AI failure classification, deep trace viewing, and intelligent error grouping. Teams get a bird's-eye view of project health, but still need a separate tool to understand and fix complex Playwright failures.
The pricing model and tool-agnostic nature mean that while it supports many frameworks, it often lacks the deep, specialized context needed for modern end-to-end testing frameworks.
Here are the 5 best Calliope Pro alternatives to consider in 2026.
Best Calliope Pro Alternatives: How to Choose the Right Tool
We evaluated each tool based on test reporting depth, AI failure analysis, flaky test detection with root cause classification, Playwright support, debugging evidence, CI/CD integration flexibility, and pricing transparency.
How to Compare Calliope Pro Alternatives
Here is a quick comparison of top alternatives to Calliope Pro to help you identify your preferred test reporting and CI/CD tool:
TestDino |  Calliope Pro |  ReportPortal |  Allure TestOps |  TestRail | |
|---|---|---|---|---|---|
| PricingLowest paid plan, per the listed billing terms. | $39/month (billed annually) | Custom enterprise pricing | Free (Open Source), SaaS available | Starts at $39/user/month | Starts at $37/user/month |
| Best for | Playwright test intelligence & management | Basic test reporting & collaboration | Open-source test dashboarding | Automated test reporting for DevOps | Manual & automated test case management |
| Playwright integration | Native (trace viewer, error grouping, MCP) | Generic XML/JSON parser | Via agent/plugin | Native plugin | Via API/reporter |
| Ease of use |  |  | |  | |
| One-step CI setup | One tdpw upload line | ||||
Dashboards & Reporting | |||||
| Unified Playwright dashboard | |||||
| Multi-tab test run detail view | Summary, History, AI Insights & more | Basic run overview | Basic job output | Test run view | Test run logs |
| Pull request insightsSee test results and history for each pull request. | Basic PR linking | ||||
| Test ExplorerBrowse tests as a hierarchy, a flat list, or by tag. | |||||
| Real-time streaming | Per-shard/worker | ||||
| Scheduled PDF reportsGet report PDFs emailed on a set schedule. | Daily/Weekly/Monthly | ||||
Test Analytics | |||||
| Analytics: trends & patterns | Basic Test Insights | ||||
| Code coverage, per-file | Istanbul, run-level | ||||
| Environment analytics | Pass-rate/flaky by env | ||||
Debugging & Evidence | |||||
| Built-in Playwright trace viewer | |||||
| Screenshots & video replay | Embedded | Via attachments | Embedded | Embedded | Via attachments |
| Console logs | Node + browser | Raw job logs | Raw logs | Raw logs | Raw logs |
| Visual diff comparison | |||||
| Smart error grouping | Message/stack/location | ML-based grouping | |||
| Flaky detectionSpot tests that pass and fail inconsistently, with a stability score. | Manual flagging | Basic detection | History-based | ||
| Playwright tags & annotations | Priority/owner/links/metrics | ||||
CI/CD Optimization | |||||
| Rerun only failed tests | |||||
| GitHub CI Checks quality gates | Per-env + mandatory tags | ||||
| Branch → environment mappingMatch each Git branch to the environment it runs against. | Exact/regex | ||||
| Smart rerun historyTrack reruns tied to each branch and commit. | |||||
| Sharded / parallel run support | Per-shard live view | ||||
| Native CI breadth | GitHub, GitLab, Azure, CircleCI, etc. | Any via API upload | Any via API | Any via agents | Any via API |
| Self-managed GitLab | |||||
Test Management | |||||
| Test case management | |||||
| Bulk test creationGenerate many test cases at once from PRDs, Jira, or user stories. | via MCP | ||||
| Release trackingGroup test results by release, cycle, or sprint. | |||||
| Exploratory / manual sessions | |||||
| Import / export test cases | JSON/CSV/ZIP | XML/CSV | |||
AI & Automation | |||||
| Local MCPLet AI coding assistants in your editor query test data directly. | Cursor/Claude Code/Copilot | ||||
| Remote MCPLet web-based AI tools query your test data. | |||||
| AI test run summary on GitHub PRs | |||||
| AI test suite auditAI scores your test suite and gives a downloadable report. | |||||
| AI failure classification | |||||
Integrations & Collaboration | |||||
| Bug tracking breadth | Jira, Linear, Asana, monday | Jira | Jira, Rally | Jira | Jira |
| Slack notifications | App + webhooks | Webhooks | Native | Native | Webhooks |
Platform & Security | |||||
| Public API & CLIs | REST + tdpw / testdino | REST API | REST API | REST API | REST API |
| Project-level AI controls | Per-feature toggles | ||||
| Compliance & certifications | ISO 27001, SOC 2 Type II, GDPR | ISO 27001, SOC 2 | Open Source | ISO 27001, SOC 2 | SOC 2 Type II |
| Self-managed (your infra) | |||||
Plans & Pricing | |||||
| Plan tiers | Free · Pro $39 · Team $79 · Enterprise | Custom | Open Source / SaaS | Cloud / Server | Professional / Enterprise |
| Free executions | 5,000/mo | None | Unlimited (Self-hosted) | None | None |
| Small teams free | Self-hosted | ||||
| Support | Chat + Slack Connect + Priority email | Ticket support | Community | Ticket | Ticket |
| Try for free | Learn more | Learn more | Learn more | Learn more | |
Best Calliope Pro Competitors for Test Reporting & CI/CD
Here are the 5 best alternatives to Calliope Pro for teams that want deeper test intelligence alongside their CI/CD pipeline:
1. TestDino
Best for:
Playwright-first teams that need dedicated test intelligence, AI failure classification, and debugging evidence on top of their existing CI/CD pipeline.
Platform Type:
Test intelligence, reporting, dashboards, and CI/CD optimization platform for Playwright.
Integrations with:
GitHub Actions, GitLab CI, CircleCI, Azure DevOps, TeamCity, Jira, Linear, Asana, monday, Slack.
Key Features:
 AI failure classification into 4 categories (Actual Bug, UI Change, Unstable Test, Miscellaneous)
- Built-in Playwright trace viewer with DOM snapshots and network logs
- Error grouping by message, stack trace, and location
- Flaky test detection with root cause classification (timing, environment, network, assertion)
- GitHub CI Checks as merge quality gates
- Rerun only failed tests to cut CI pipeline time
- MCP Server for AI agent queries from your IDE
- Real-time results streaming via WebSocket
- Test case management with suites up to 6 levels deep
- Code coverage per file breakdown

Pros
- Works with any CI/CD provider including CircleCI, GitHub Actions, GitLab CI
- AI failure classification and trace viewer built in from day one
- Flat monthly pricing, no credits to track or per-user scaling

Cons
- Purpose-built for Playwright (multi-framework support on the roadmap)
First-Hand Experience
With Calliope Pro, your pipeline runs tests and reports basic pass/fail metrics. But when you need to understand the root cause of failures or distinguish real bugs from environment issues, Calliope Pro's insights stop short.
TestDino sits on top of your CI pipeline. Add the reporter to your config, and your first run populates a dashboard with AI failure classification, root-cause flaky detection, and active error grouping. The Test Explorer shows manual and automated tests side by side, providing failure intelligence with confidence scores and 1-click bug filing into tools like Jira or Linear.
Debugging That Saves You from Re-running Locally
Failed tests in TestDino include screenshots, video, console logs, and a step-by-step trace viewer. While Calliope Pro only shows basic logs, TestDino shows exactly what happened in the browser. AI Insights classifies failures as Bugs, UI Changes, or Unstable Tests.
CI/CD Speed and Merge Safety
Rerun failed tests re-executes only failures, not the full suite, across sharded runs. GitHub CI Checks add PR quality gates. You can set minimum pass rates and environment-specific rules. AI-generated summaries are posted to commits and merge requests automatically.
Flaky Test Detection That Tells You Why
Flaky test detection classifies unstable tests by root cause, such as timing or network. Each test gets a stability score. Unlike Calliope Pro, which relies heavily on raw historical data, TestDino tells you exactly why tests are flaky.
Real-Time Streaming and Scheduled Reports
Results appear instantly via real-time streaming as each test completes. You can also schedule automated PDF reports for health summaries and configure Slack notifications.
MCP Server for AI-Assisted Test Management
The MCP Server connects AI assistants (Cursor, Claude Code) directly to test data. You can pull debugging context, perform root cause analysis, and manage manual test cases through natural language without switching tools.
Pricing & Value
Pricing may vary. Check the pricing page for the latest details.
Final Verdict
TestDino complements your CI/CD by filling the reporting gaps of generic tools like Calliope Pro: it adds AI failure classification, trace viewing, and error grouping. At a flat $39/month per workspace, it delivers dedicated test intelligence on top of any CI provider.
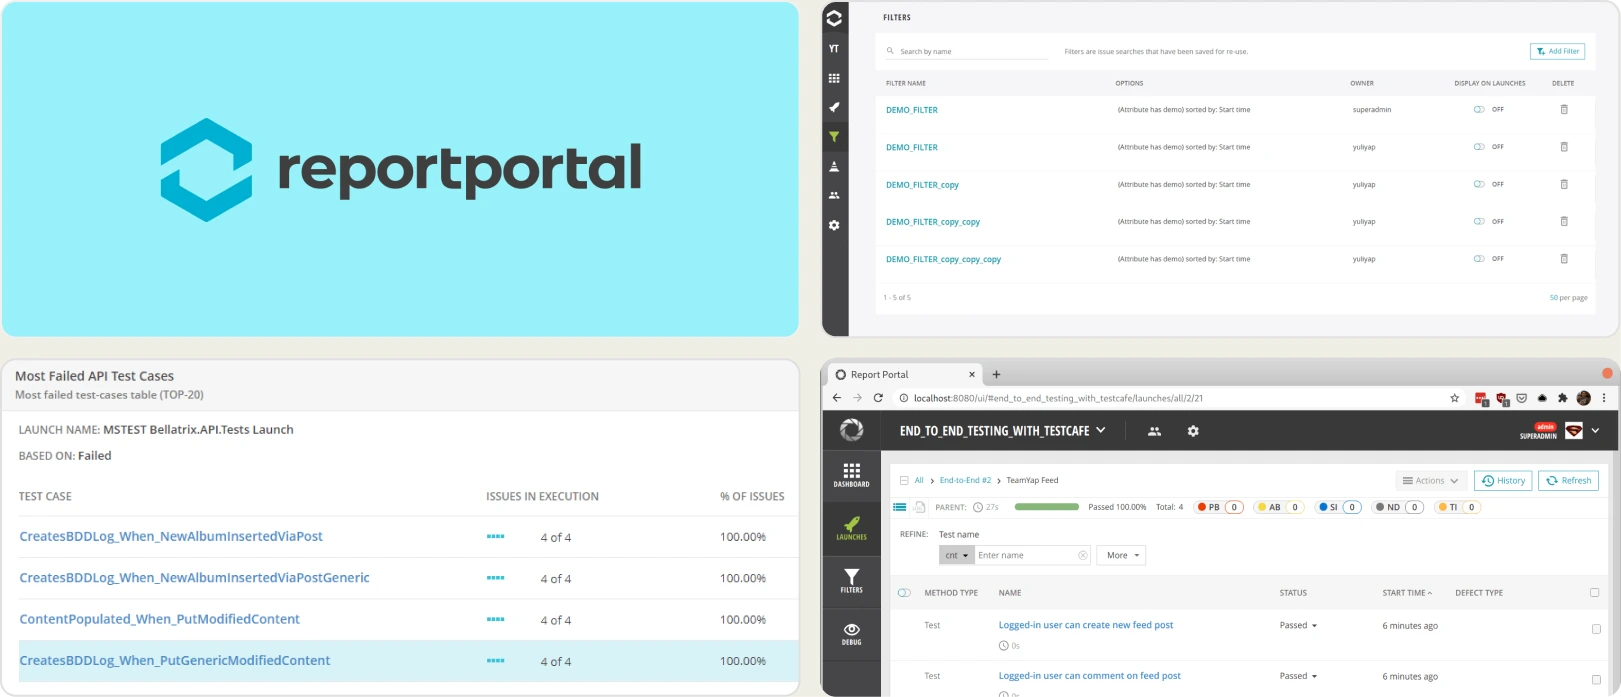
2. ReportPortal
Best for:
Teams looking for an open-source test reporting dashboard with machine learning for error categorization, though it requires self-hosting or an enterprise SaaS plan.
Platform Type:
AI-powered test automation dashboard.
Integrations with:
Jira, Rally, Slack, Jenkins, GitHub Actions, GitLab CI.
Key Features:
- Machine Learning-based auto-analysis for categorizing test failures
- Real-time integration and reporting
- Open-source self-hosted version available
- Custom dashboards and widgets
- Multi-framework support
Pros
- Free and open-source option available
- Auto-Analysis uses ML to group known failures
- Highly customizable dashboard widgets
Cons
- Self-hosting requires significant infrastructure maintenance
- No built-in Playwright trace viewer
- Lacks native CI/CD execution capabilities
- Complex initial setup and onboarding
First-Hand Experience
ReportPortal serves as a robust open-source alternative to Calliope Pro. Its standout feature is Auto-Analysis, which uses machine learning to categorize new failures based on historical data. This is a step up from Calliope Pro's basic reporting.
However, ReportPortal lacks deep debugging evidence like a built-in trace viewer. You still have to jump between tools to see what went wrong at the browser level.
Pricing & Value
The open-source version is free. SaaS and Enterprise support plans are available and scaled based on data retention and processing needs.
Final Verdict
ReportPortal is an excellent choice for teams that want an open-source, framework-agnostic dashboard and are willing to manage the infrastructure, but it falls short of the rich, Playwright-specific debugging evidence found in TestDino.
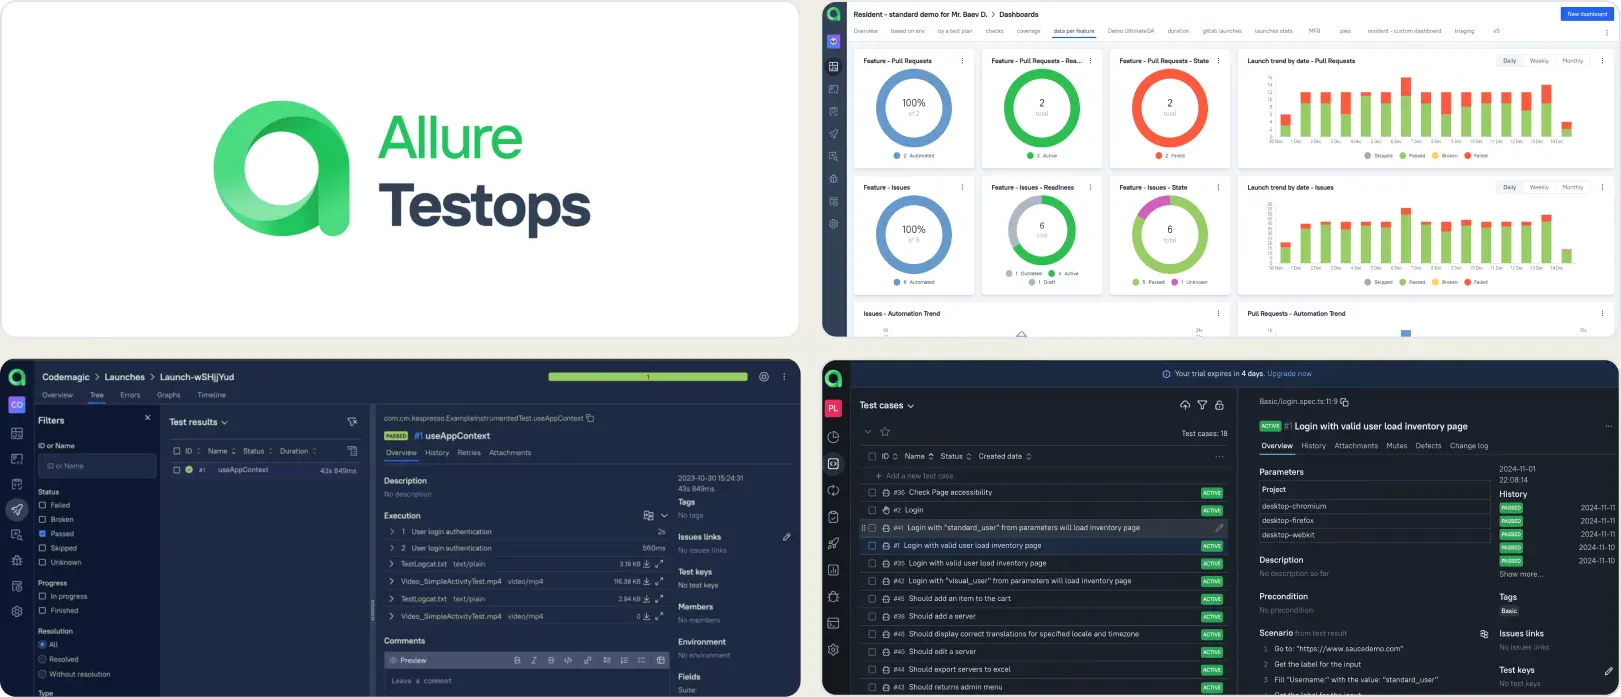
3. Allure TestOps
Best for:
DevOps teams that need a central hub linking automated test execution with manual test case management, though its UI and setup can be complex.
Platform Type:
Software quality management and test reporting platform.
Integrations with:
Jira, Jenkins, GitHub Actions, GitLab, Bitbucket.
Key Features:
- Automated test case documentation based on code
- Native integration with major CI/CD pipelines
- Defect linking and tracking
- Rich visual test reporting (Allure Reports)
- History and trend analysis
Pros
- Bridges the gap between automated execution and manual testing
- Excellent visual representation of test steps
- Live documentation generation from test code
Cons
- Expensive per-user pricing model
- Complex configuration for advanced CI/CD setups
- Lacks AI-driven failure classification
- No built-in Playwright trace viewer
First-Hand Experience
Allure TestOps takes the popular open-source Allure Reports and scales it for enterprise test management. Unlike Calliope Pro, it builds test documentation directly from your code, keeping manual QA and automated QA on the same page.
Despite this, debugging is still primarily log and screenshot-based. It lacks the modern AI failure analysis and built-in Playwright trace viewing that developers need to fix bugs quickly.
Pricing & Value
Cloud pricing starts around $39/user/month, scaling up for enterprise self-hosted instances.
Final Verdict
Allure TestOps is a strong contender if you prioritize generating live test documentation from your code, but for teams wanting AI-driven debugging and flat pricing, TestDino is a superior choice.
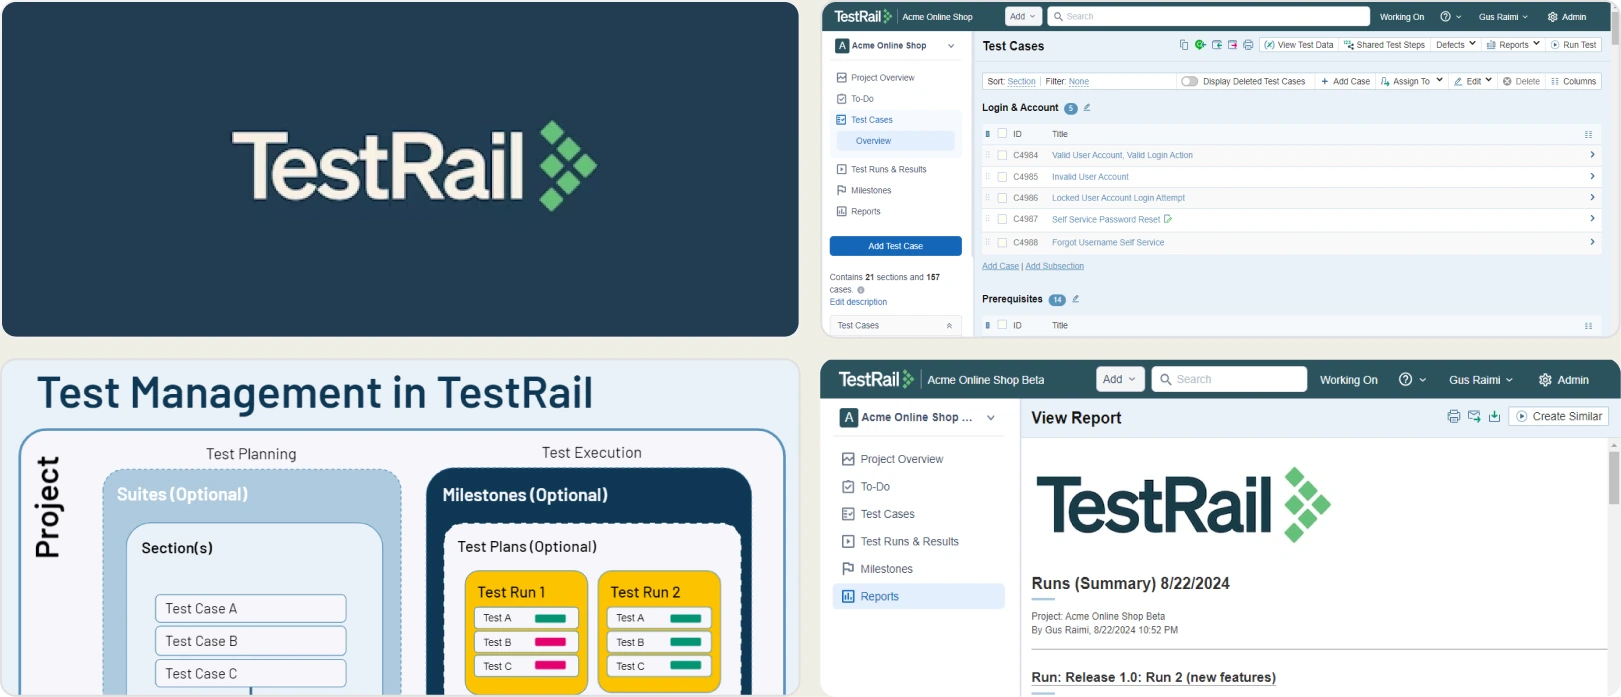
4. TestRail
Best for:
Traditional QA teams that need rigorous manual test case management alongside basic automated test results injection via APIs.
Platform Type:
Test case management and QA software.
Integrations with:
Jira, GitHub, GitLab, Jenkins, Trello, Asana.
Key Features:
- Comprehensive test case and suite management
- Milestone and release tracking
- Push defects directly to Jira
- Custom reporting and metrics
- REST API for automated test results
Pros
- Industry standard for manual test case management
- Deep integration with Jira
- Highly customizable templates and workflows
Cons
- Not built for modern CI/CD speed
- Automated reporting feels tacked on via API
- No AI failure analysis or smart error grouping
- Expensive per-user pricing
First-Hand Experience
TestRail is the heavyweight champion of manual test case management. While Calliope Pro focuses on aggregating automated results, TestRail is where QA teams write steps, plan releases, and track coverage. You can push automated results into TestRail via its API, but the experience is rigid.
It provides no built-in debugging context, trace viewing, or AI analysis for automated runs, making it a record-keeping tool rather than an active debugging platform.
Pricing & Value
Professional Cloud starts at $37/user/month, with Enterprise options scaling higher.
Final Verdict
Choose TestRail if manual test planning is your top priority. If your focus is making your automated Playwright pipeline faster and easier to debug, TestRail will slow you down compared to TestDino.
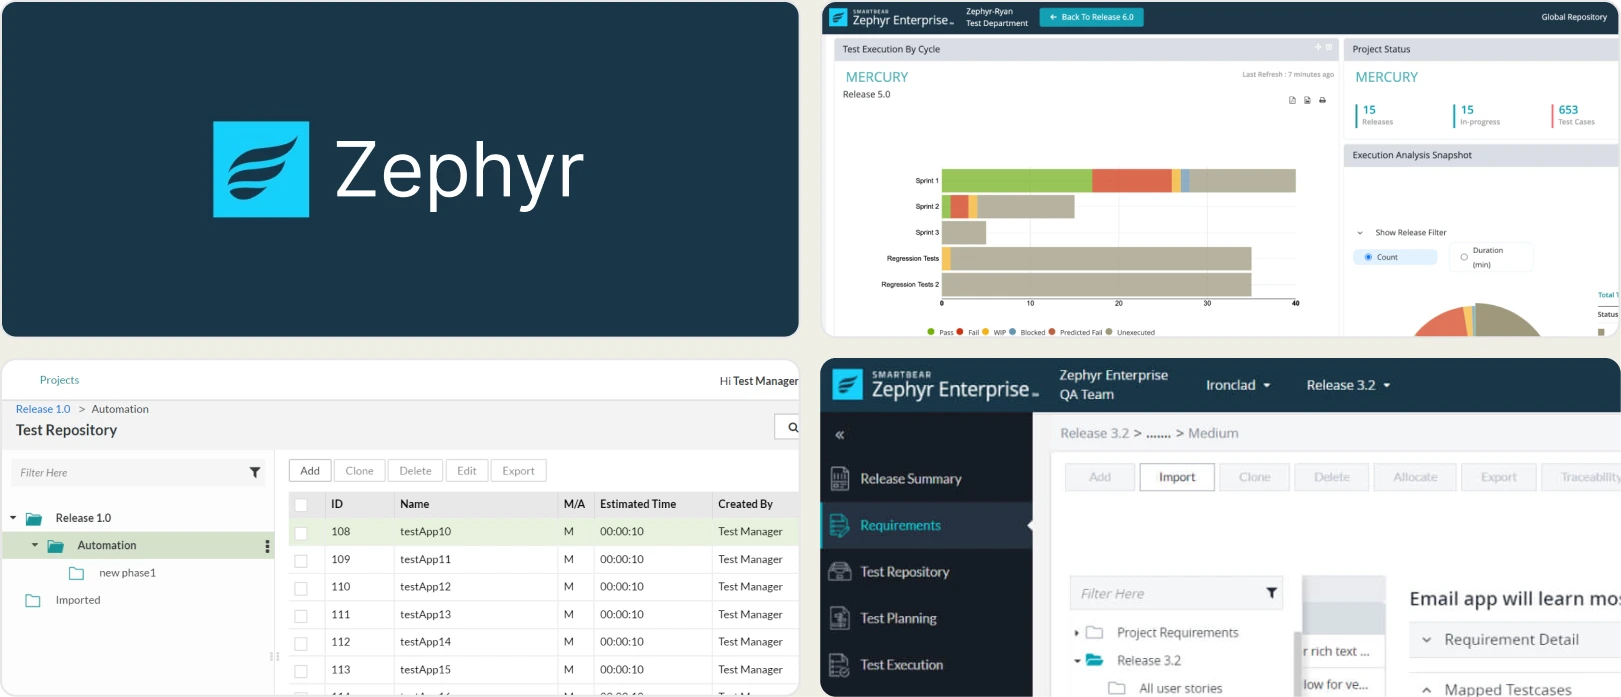
5. Zephyr Scale
Best for:
Teams living entirely inside the Jira ecosystem that want test management directly embedded in their bug tracking software.
Platform Type:
Jira-native test management application.
Integrations with:
Jira (Native), Jenkins, Bamboo, Cucumber.
Key Features:
- Lives entirely inside Jira
- Traceability between requirements, test cases, and bugs
- BDD and Cucumber support
- Cross-project test library sharing
- Built-in reports and dashboard gadgets
Pros
- Zero context switching if you already use Jira
- Single source of truth for requirements and tests
- Scales well for large enterprise Jira instances
Cons
- Jira can become bloated and slow
- Automated test reporting is basic and lacks deep debugging tools
- No native AI failure classification or trace viewing
- Dependent entirely on Atlassian's ecosystem uptime
First-Hand Experience
Zephyr Scale transforms Jira into a full-fledged test management suite. If your team is heavily invested in Atlassian, the traceability from a Jira Epic down to a specific test execution is unmatched. Calliope Pro requires a separate dashboard, but Zephyr keeps you in Jira.
However, for developers looking at a failed Playwright test, Zephyr Scale offers nothing. It's a management tool, not an engineering tool. You still need a platform like TestDino to debug the code.
Pricing & Value
Pricing is tiered based on your Jira user tier. For small teams, it's affordable, but it scales up significantly as your Jira user base grows.
Final Verdict
Zephyr Scale is the best choice for Jira purists focused on test planning. For developers who need to fix flaky tests, debug pipelines, and analyze failures, it must be paired with an intelligence layer like TestDino.
What to Look for in a Calliope Pro Alternative
Choosing a Calliope Pro replacement is not just about finding another test reporting dashboard. The right platform should address the limitations that led you to explore alternatives in the first place. Here are the key factors to evaluate.
Test intelligence and failure analysis
Calliope Pro provides centralized dashboards and test execution history, but it stops at reporting what happened. Modern engineering teams need to understand why tests failed so they can fix issues faster.
Look for tools that classify failures automatically, group similar errors, and distinguish flaky tests from genuine product defects. AI-powered failure classification and root cause analysis can significantly reduce the time spent manually reviewing CI failures.
Playwright debugging and execution insights
If your team uses Playwright, debugging capabilities matter as much as reporting. Basic logs are rarely enough to identify the source of a failed test.
Choose a platform that includes a built-in Playwright trace viewer, screenshots, video recordings, console logs, network requests, and detailed execution history. Having all debugging evidence available from the CI run eliminates the need to reproduce failures locally.
CI/CD integration and pipeline optimization
Calliope Pro integrates with multiple testing frameworks, but many teams also need tools that actively improve their CI workflow rather than simply reporting results.
Look for capabilities such as rerunning only failed tests, pull request quality gates, branch and environment tracking, and integrations with GitHub Actions, GitLab CI, CircleCI, Azure DevOps, and other CI/CD platforms.
Team collaboration and workflow automation
Test reporting should help teams resolve failures, not just display them. The best alternatives streamline collaboration by connecting directly with your existing development workflow.
Features such as one-click bug creation for Jira or Linear, Slack notifications, scheduled reports, and shared dashboards help developers and QA teams move from failed test to resolved issue faster.
Analytics and flaky test detection
Execution history alone provides limited insight. A modern test intelligence platform should help teams identify long-term quality trends and recurring stability issues.
Look for flaky test detection that identifies the underlying cause of instability, such as timing issues, environment differences, intermittent network failures, or unreliable assertions. Historical trends, stability scores, and environment-based analytics make it easier to prioritize improvements based on real data.
Ease of setup and pricing
A reporting platform should be quick to adopt and simple to maintain. If setup requires significant infrastructure or ongoing maintenance, it becomes another engineering burden.
Choose a solution with straightforward CI integration, managed hosting, transparent pricing, and minimal configuration. Platforms that connect to existing pipelines within minutes typically deliver value faster than tools requiring complex deployment.
Wrapping Up
Calliope Pro gives teams a centralized way to aggregate test results and monitor execution history across frameworks. But its reporting is limited to high-level dashboards, making it harder to investigate flaky tests, understand failure patterns, or debug Playwright issues without relying on additional tools.
The alternatives above address different priorities. ReportPortal offers open-source reporting with machine learning-based failure analysis. Allure TestOps combines automated reporting with test management and documentation. TestRail focuses on structured manual and automated test management, while Zephyr Scale is ideal for teams that manage testing directly within Jira.
For Playwright-first teams that want AI-powered failure classification, built-in trace viewing, flaky test detection with root cause analysis, test management, and CI/CD optimization in a single platform, TestDino provides a dedicated test intelligence solution starting at $39/month billed annually.
Trade surface-level reporting for test intelligence
See why each CI failure happenedTrack flaky tests by root causeFAQs
Yes. While Calliope Pro aggregates test data, TestDino provides a much richer alternative focused specifically on deep test intelligence, AI failure classification, and Playwright-specific debugging evidence.