
Looking to migrate from Allure Report? Compare Allure Report vs TestDino. TestDino provides a managed dashboard, inline trace viewing, and feeds AI coding agents.
Allure Report generates a static HTML folder per run. History, flakiness, and categorization all require extra CI steps: preserving a history subfolder, maintaining a categories.json with regex rules, and serving the folder somewhere teams can reach it. TestDino is what teams reach for when they need persistence without the hosting work. If you're weighing Allure Report vs TestDino for a Playwright suite, the difference is hosting and history.
TestDino is a managed platform. There's no artifact server to configure and no history folder to preserve. Errors cluster automatically by root cause across message, stack, and failure location, replacing the categories.json regex approach. The Playwright trace viewer renders inline on every failure with DOM snapshots, network panel, and console logs. Each run is linked to its PR via a dedicated Pull Request view. Manual and automated test cases live in the same workspace, and the entire test record is queryable by Claude Code, Cursor, or any MCP-compatible agent.
Allure Report vs TestDino comes down to static HTML versus a managed platform. Here's where that difference shows.
Managed dashboard, no hosting required
The reporter sends results to a hosted dashboard on every CI run. No artifact server, no history subfolder to preserve, no GitHub Pages configuration. The trend data is there on the second run without any extra setup.
Inline trace viewer, screenshots, and video
Every failed test opens with an embedded trace viewer showing DOM snapshots, network calls, and console logs, plus screenshots and video for each attempt. Debugging happens inside the dashboard without downloading a trace zip or opening a local Playwright Trace Viewer.
MCP-native test access
Cursor, Claude Code, Claude Desktop, and ChatGPT or Claude on the web (via mcp.testdino.com) connect through the TestDino MCP Server. Agents debug failures with debug_testcase, list runs by branch or commit, and update manual test cases from the editor without leaving the IDE.
Analytics that persist across runs
Test Run Volume, Flakiness, New Failures, and Retry Trends accumulate automatically. The dashboard surfaces Persistent Failures separate from Emerging Failures, and the Most Flaky Tests tile ranks instability across the full run history.

Static HTML, no persistent dashboard
Each run generates a self-contained HTML folder. To share results, teams need GitHub Pages, S3, or a CI artifact server. History requires preserving a subfolder across runs, which is an extra CI step teams have to maintain.
Manual setup for history, flakiness, and categorization
Trend graphs require history folder preservation from a previous run. Flakiness detection requires that history. Categorization requires maintaining a categories.json file with regex rules for every error pattern the team wants to label.
No AI failure intelligence
There's no automatic failure classification, no AI summaries posted to GitHub or Slack, and no confidence scores. Every Playwright failure that lands in Allure still needs a developer to read the stack trace and decide what kind of problem it is.
No agent ecosystem or CI optimization
There's no MCP Server, so AI coding agents can't query failures or create test cases through agent workflows. There's also no merge-blocking quality gates and no GitHub status checks.
TestDino | Allure Report | |
|---|---|---|
| Pricing (starts at) | $39/month (billed annually) | Open source* |
| Best for | Playwright cloud companion & test management | Free single-run HTML reports |
| Playwright integration | Native (trace viewer, error grouping, MCP) | Via adapters |
| One-step CI setup | ||
Dashboards & Reporting | ||
| Unified Playwright dashboard | Static HTML per run | |
| Multi-tab test run detail | Summary, History, AI Insights & more | Overview/Suites/Graphs/Timeline |
| Pull request insights | ||
| Test ExplorerBrowse tests as a hierarchy, a flat list, or by tag. | Suites, Behaviors, Categories | |
| Real-time streaming | Per-shard/worker | |
| Scheduled PDF reports | Daily/Weekly/Monthly (Team plan) | |
Test Analytics | ||
| Analytics: trends & patterns | For test runs, test cases & more | Trend graphs only |
| Code coverage, per-file | Istanbul, run-level | |
| Environment analytics | Pass-rate/flaky by env | environment.properties file |
Debugging & Evidence | ||
| Built-in Playwright trace viewer | ||
| Screenshots & video replay | Embedded | Screenshots; video as attachment |
| Console logs (per test) | Node + browser | Via attachment |
| Visual diff comparison | ||
| Smart error grouping | Message/stack/location | Categories.json rules |
| Flaky detection | Flaky marker via retry | |
| Playwright Tags and AnnotationsAttach priority, owner, links, and metrics to tests. | Priority/owner/links/metrics | |
CI/CD Optimization | ||
| GitHub CI Checks quality gates | Per-env + mandatory tags (Team plan) | |
| Branch → environment mappingMatch each Git branch to the environment it runs against. | Exact/regex | |
| Sharded / parallel run support | Per-shard live view | Merge result dirs |
| Native CI breadth | GitHub, GitLab, Azure DevOps, Bitbucket, CircleCI, Jenkins, TeamCity, AWS CodeBuild, Buildkite, Harness | Jenkins, GitHub Actions, GitLab CI, Azure DevOps, TeamCity, CircleCI |
| Self-managed GitLab | ||
Test Management | ||
| Test case management (suites, ownership) | ||
| Bulk test creation (PRDs/Jira/stories) | via MCP | |
| Release tracking (releases/cycles/sprints) | ||
| Exploratory/manual sessions | ||
| Import/export test cases | JSON/CSV/ZIP (export on Team) | |
AI & Automation | ||
| Local MCP (IDE agents) | Cursor/Claude Code/Copilot | |
| Remote MCP (web AI) | ||
| AI test run summary on GitHub PRs | ||
| AI test suite audit (audit score + report) | ||
| AI failure classification | ||
Integrations & Collaboration | ||
| Bug tracking breadth | Jira, Linear, Asana, monday | Jira (link via annotations) |
| Slack notifications (run summaries) | App + webhooks | |
Platform & Security | ||
| Public API & CLIs | REST API + CLI | CLI only (allure generate) |
| Project-level AI controls | Per-feature toggles | |
| Compliance & certifications | ISO 27001, SOC 2 Type II, GDPR | N/A (OSS library) |
Plans & Pricing | ||
| Plan tiers | Free · Pro $39 · Team $79 · Enterprise | Free (OSS)* |
| Free executions | 5,000/mo | Unlimited (self-hosted) |
| Support | Email (Pro) · Priority (Team) · Slack Connect (Enterprise) | Community (GitHub, Slack) |
| Start for Free | ||
Feature-by-feature breakdown showing how each tool handles the areas that matter most to testing teams.
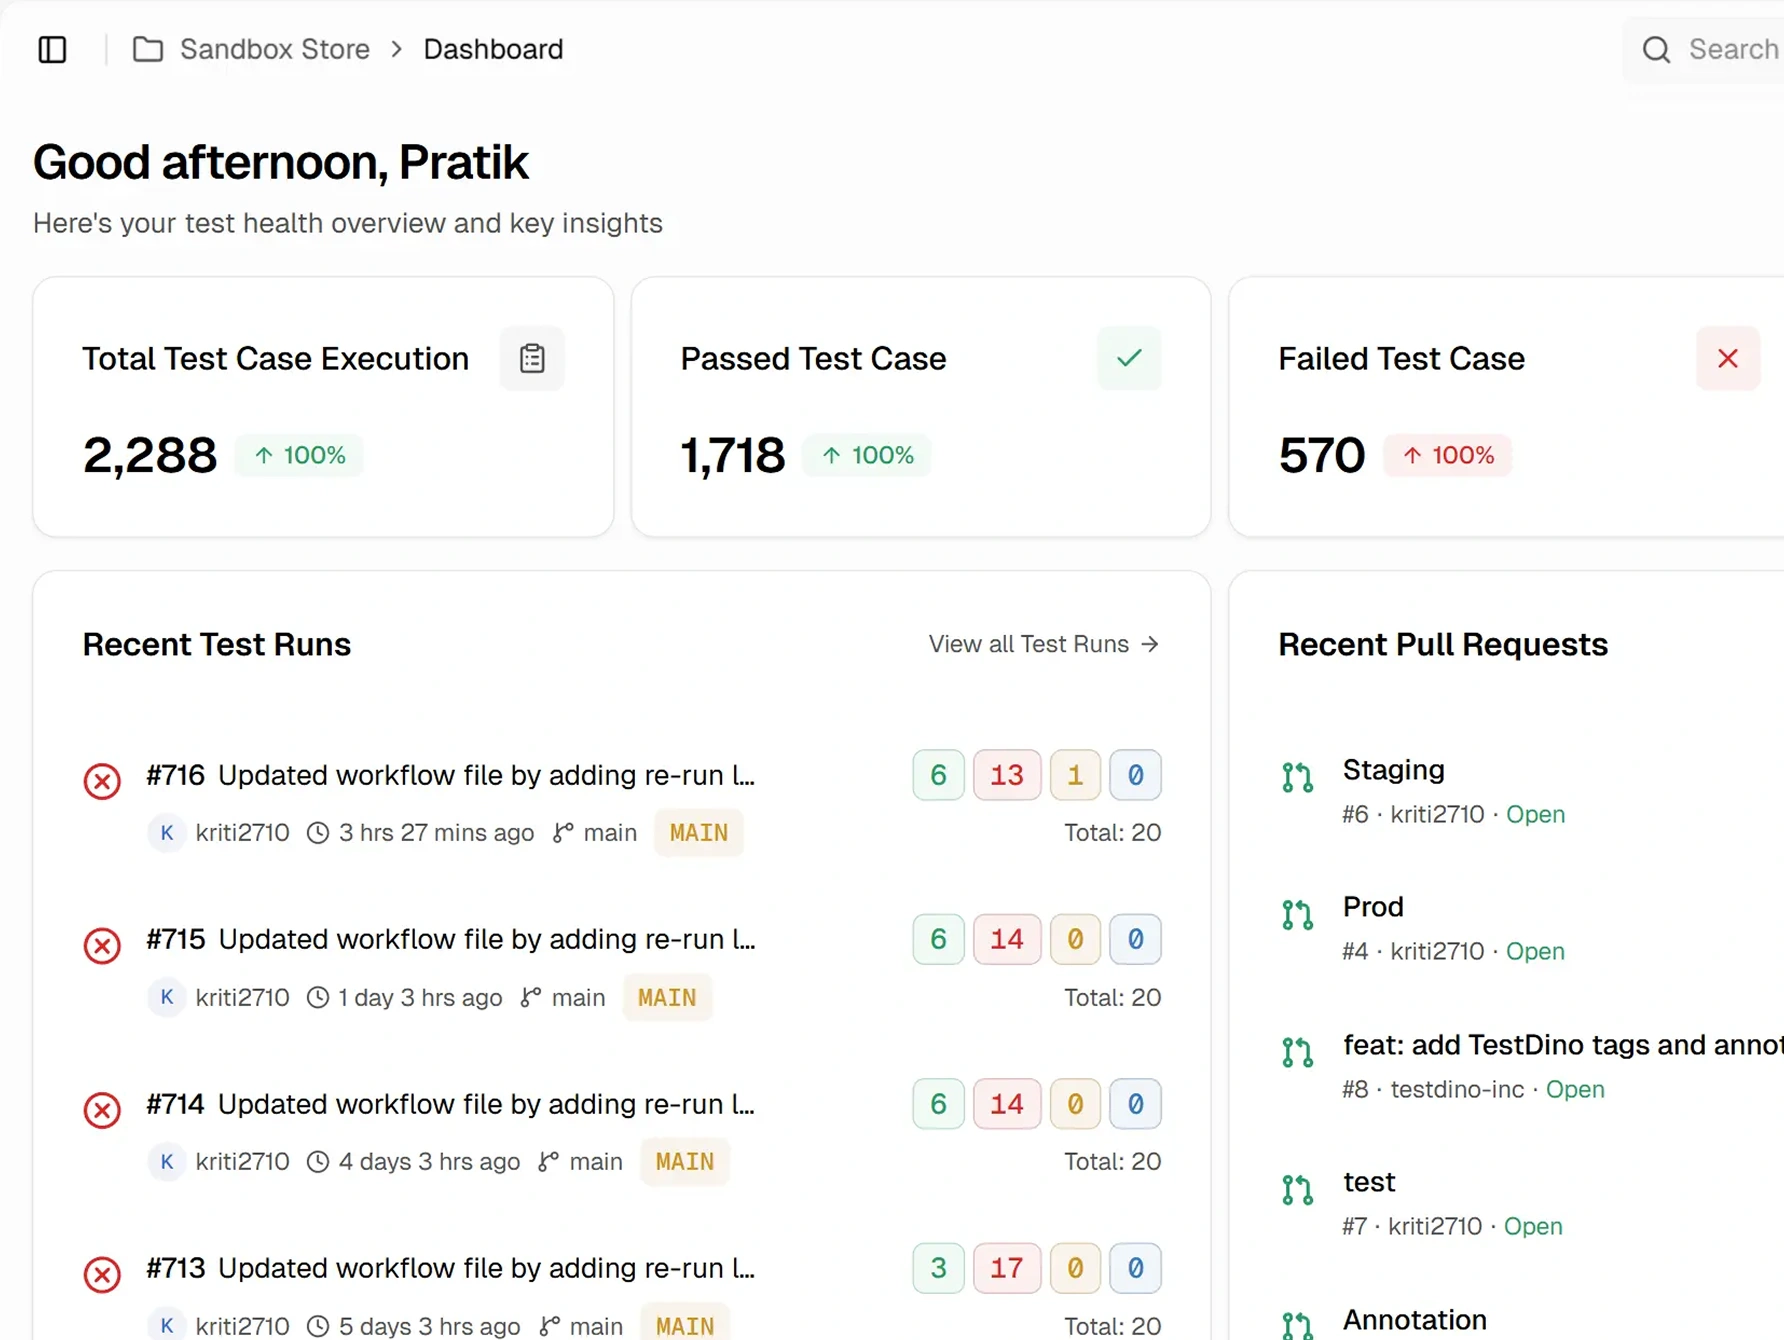
Allure generates an HTML folder per run with categories, timelines, and trend widgets when history is configured. There's no persistent managed dashboard, no PR view tied to commits and files, and no scheduled PDF exports. Trend graphs only appear when the history subfolder was preserved from a previous run.
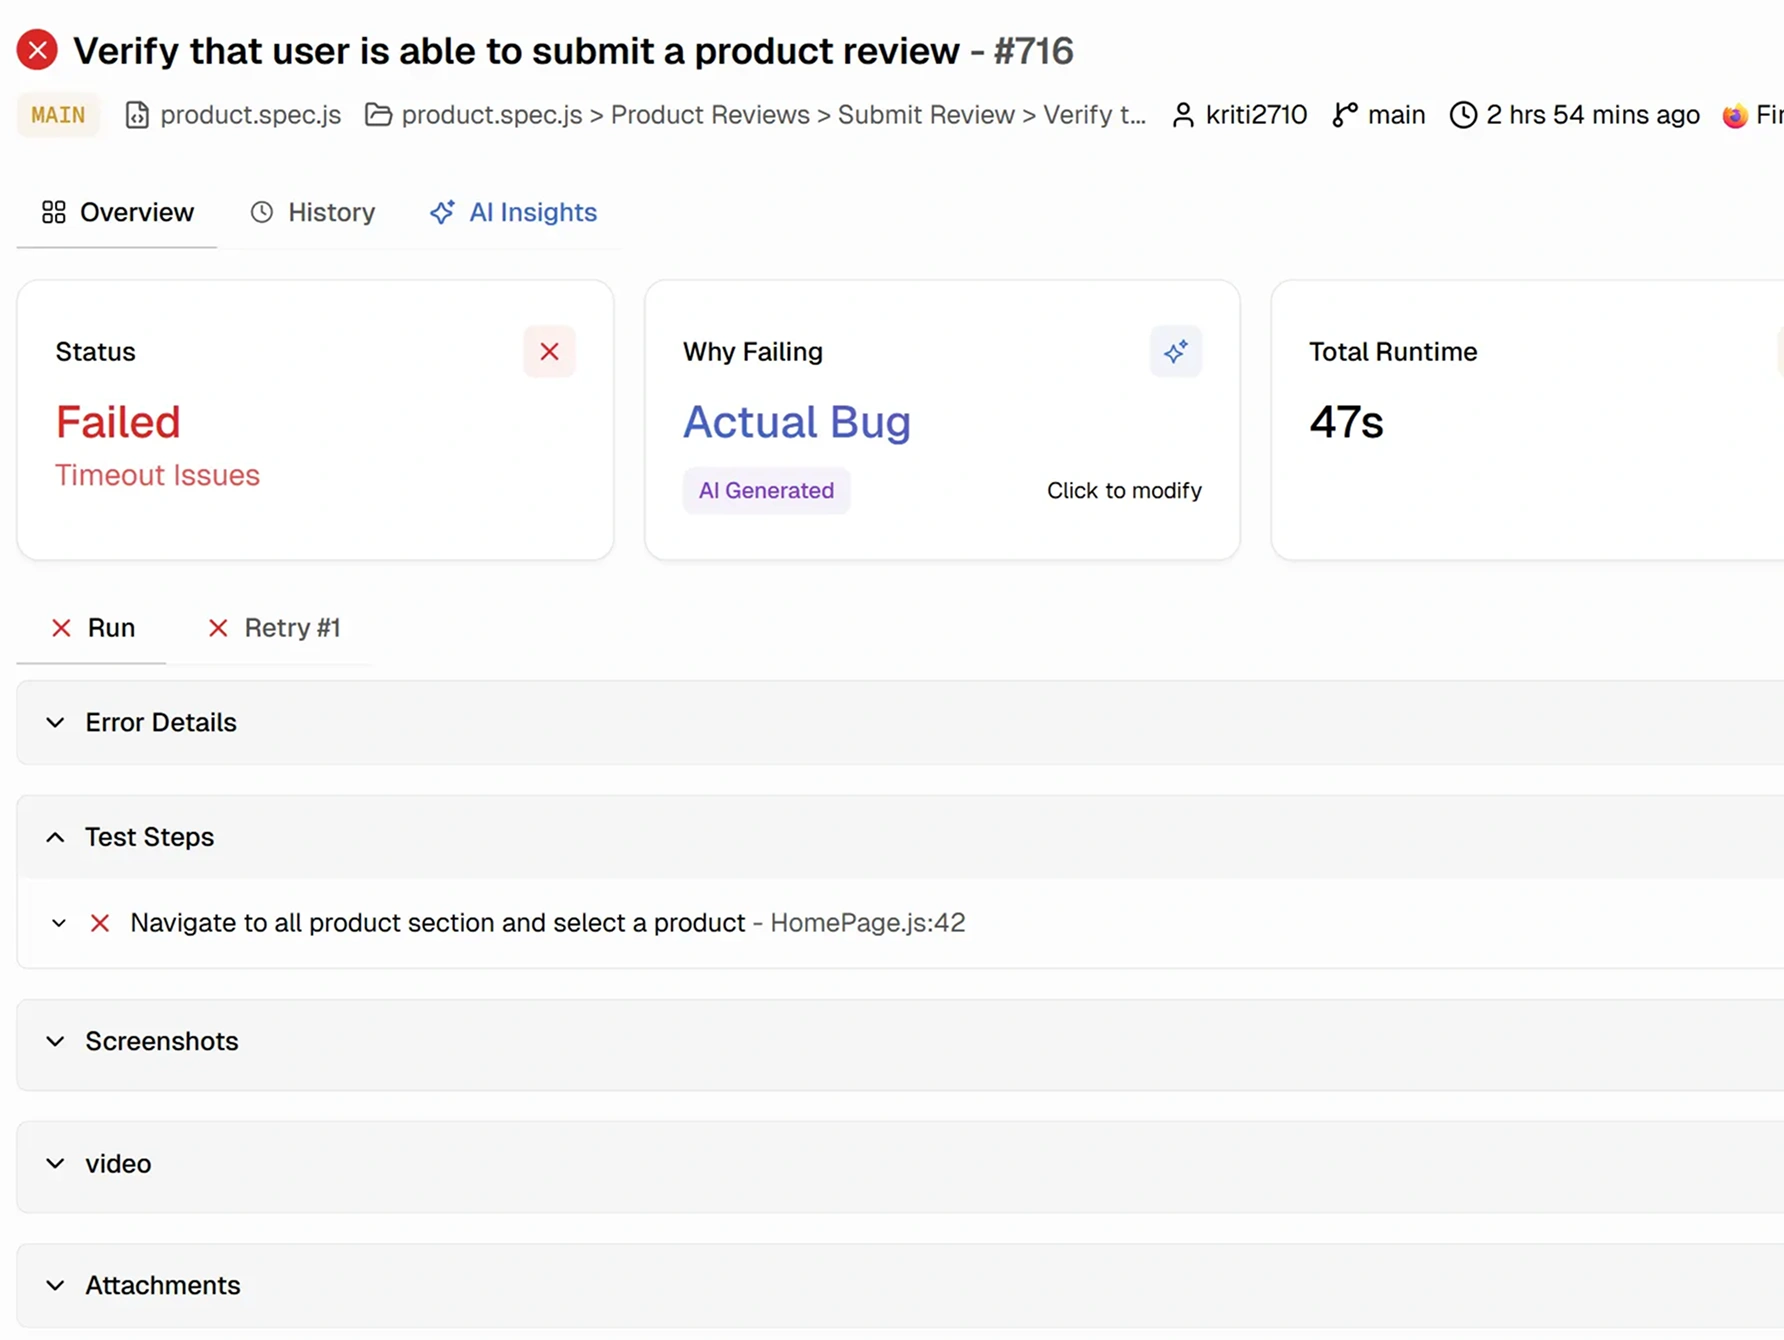
Failed tests show screenshots, videos, and trace files as attachments viewable from the test detail page. The trace file opens the local Playwright Trace Viewer, not an inline panel. Error grouping works through categories.json regex rules the team writes and maintains.
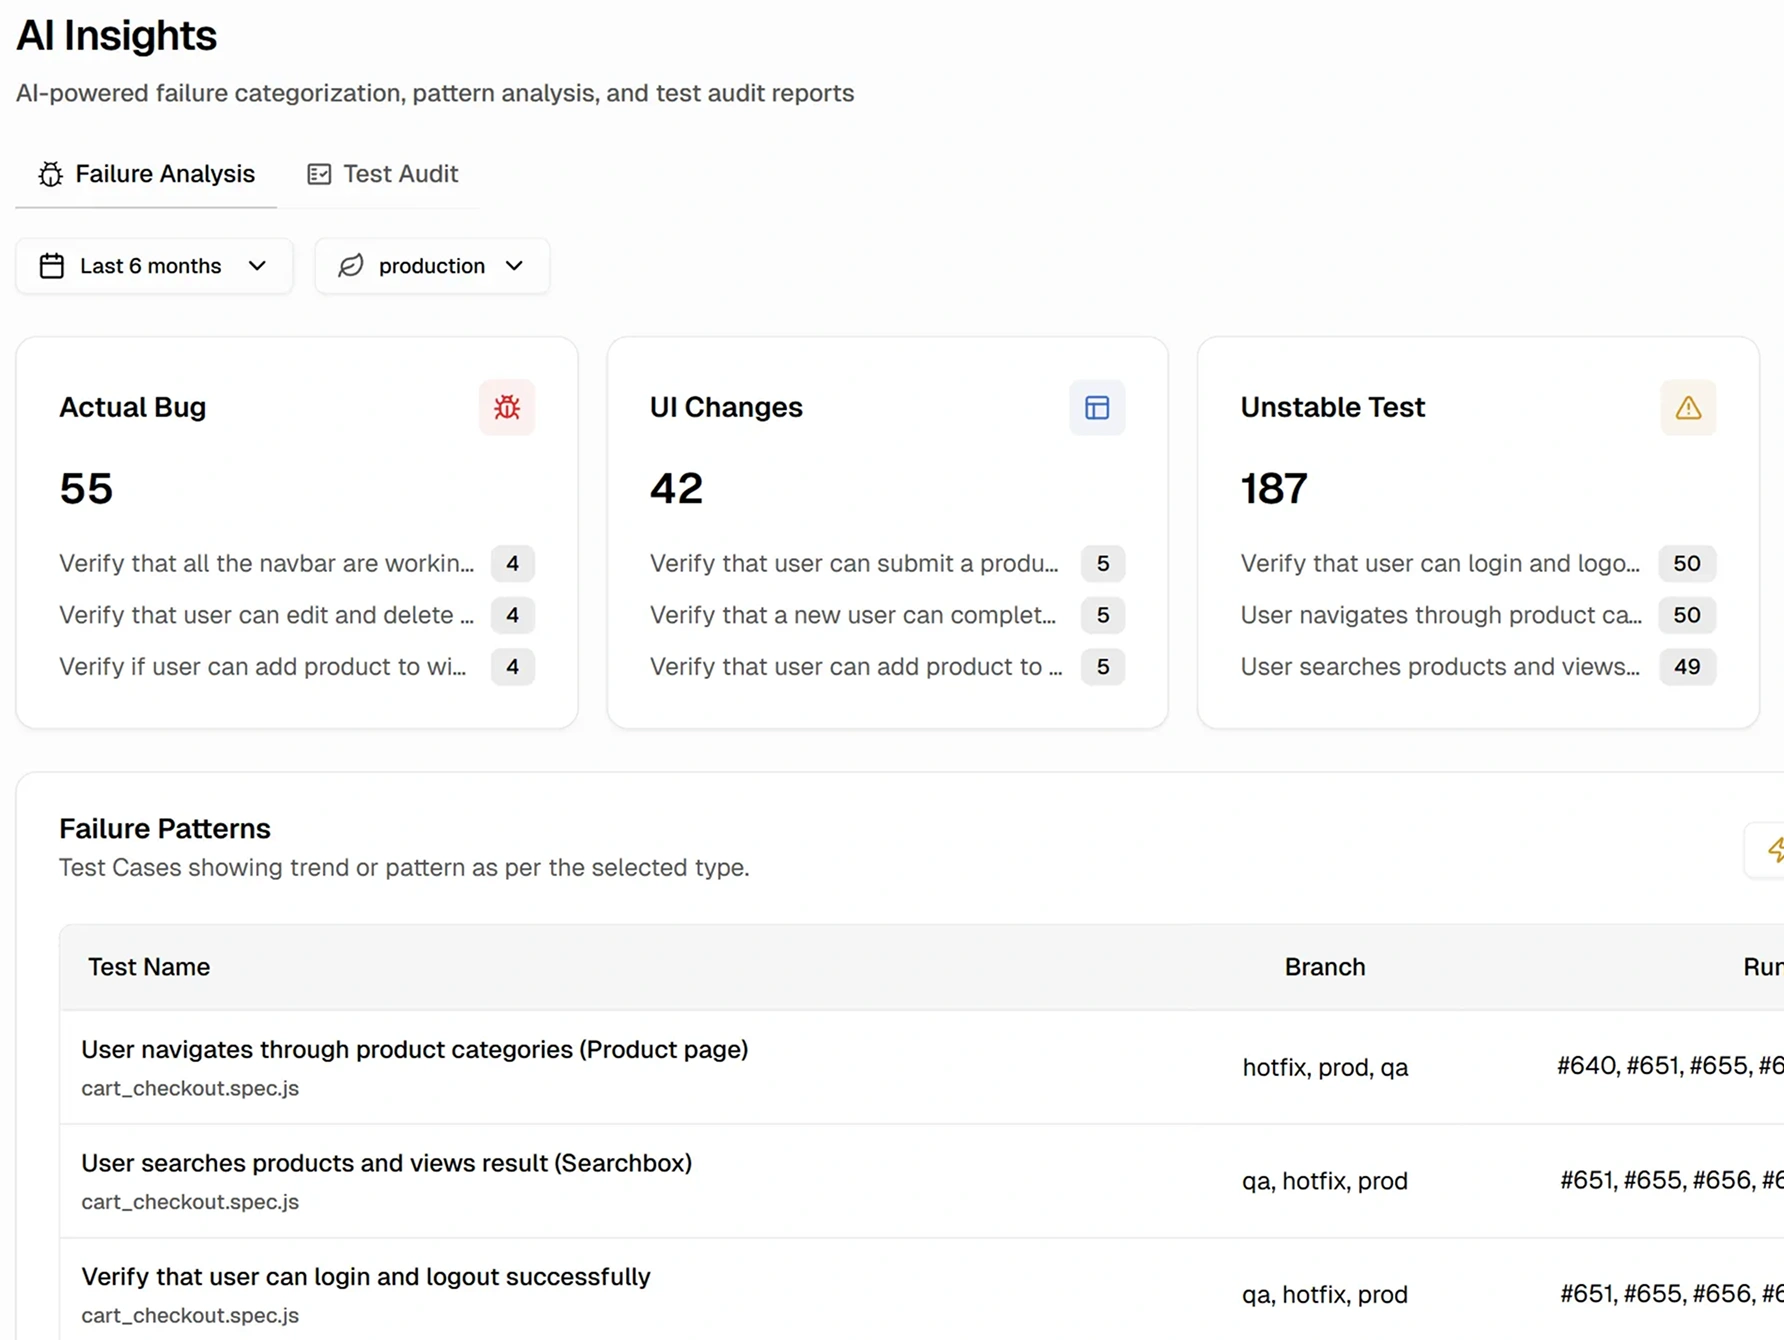
Allure has no AI. Failure categorization is rule-based through categories.json. Allure 3 added flaky detection, but it requires the history folder preserved from prior runs and flags tests based on status changes, not pattern analysis.
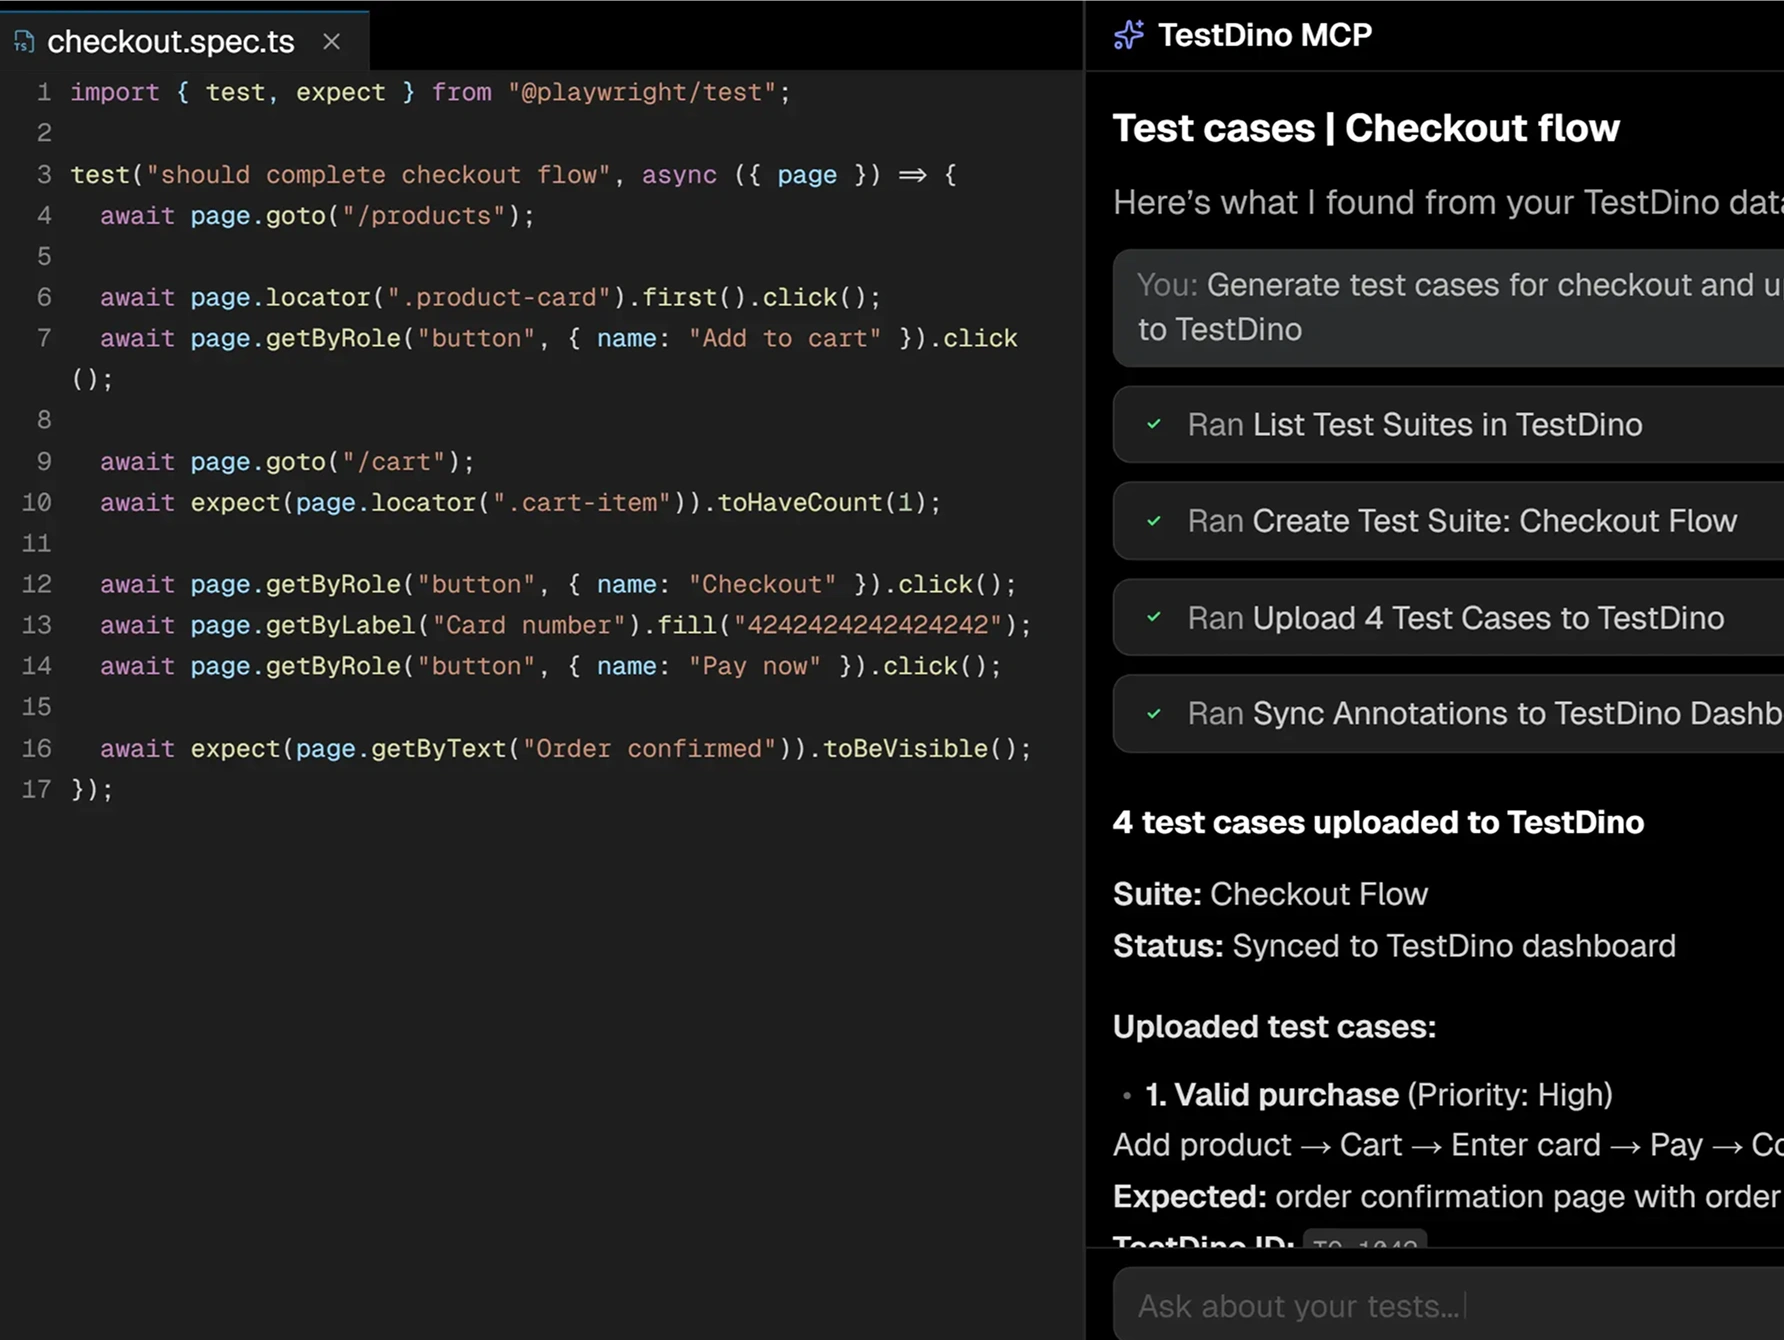
npx -y @testdino/mcp@latest. Agents cluster failures and file tickets, scope runs by branch, environment, commit, time, or author through list_testruns, debug failures with full trace and artifact context through debug_testcase, and rank flaky tests through list_testcase, all from inside the IDE.There's no MCP Server. Allure generates static HTML for human consumption. AI coding agents in Cursor or Claude Code have no way to query Allure test data, debug failures, or create test cases through an agent workflow.
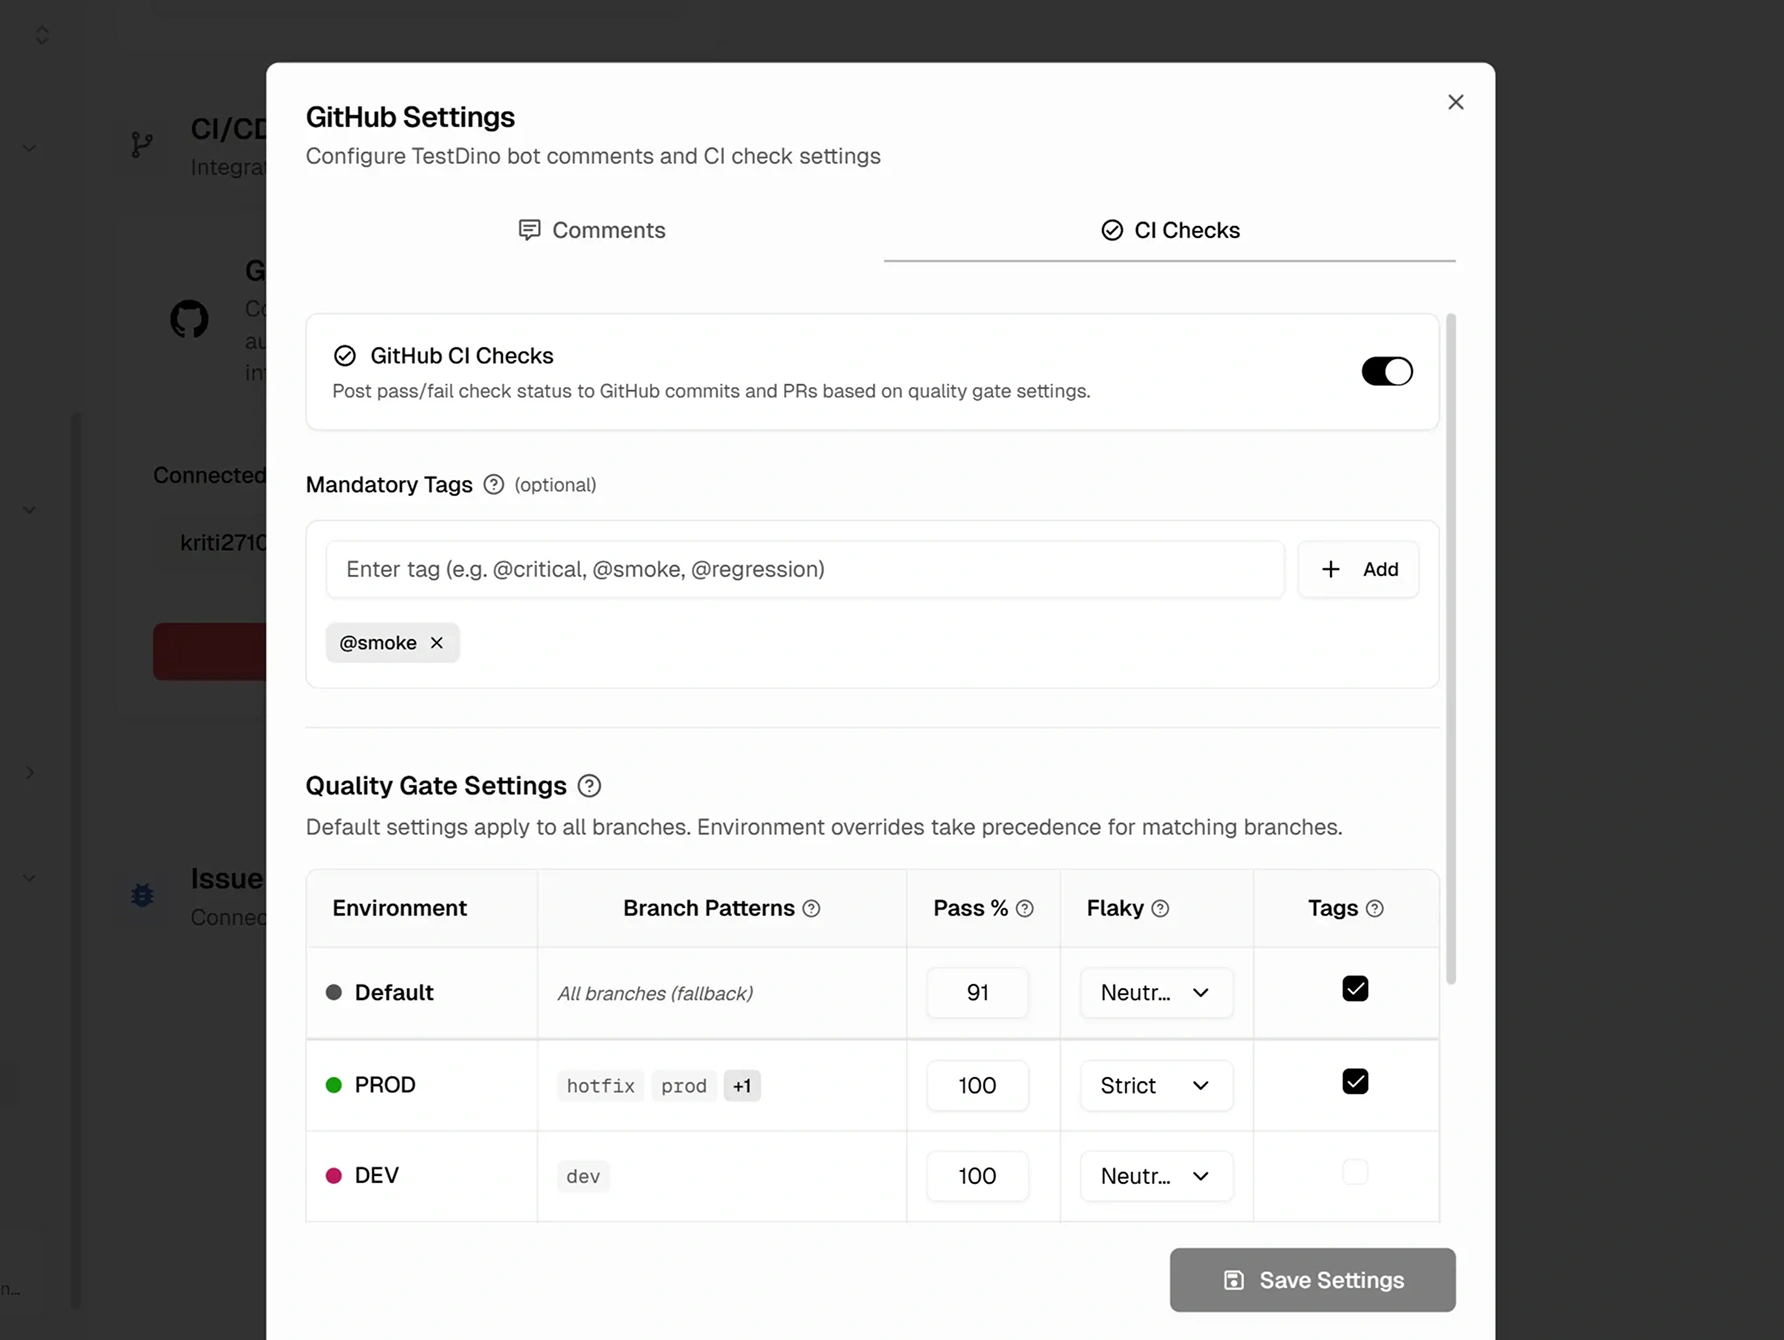
Quality gates were added in Allure 3 for fail-fast CI control based on pass-rate thresholds and category counts. GitHub status checks that block merges and branch-regex environment mapping aren't part of the report.
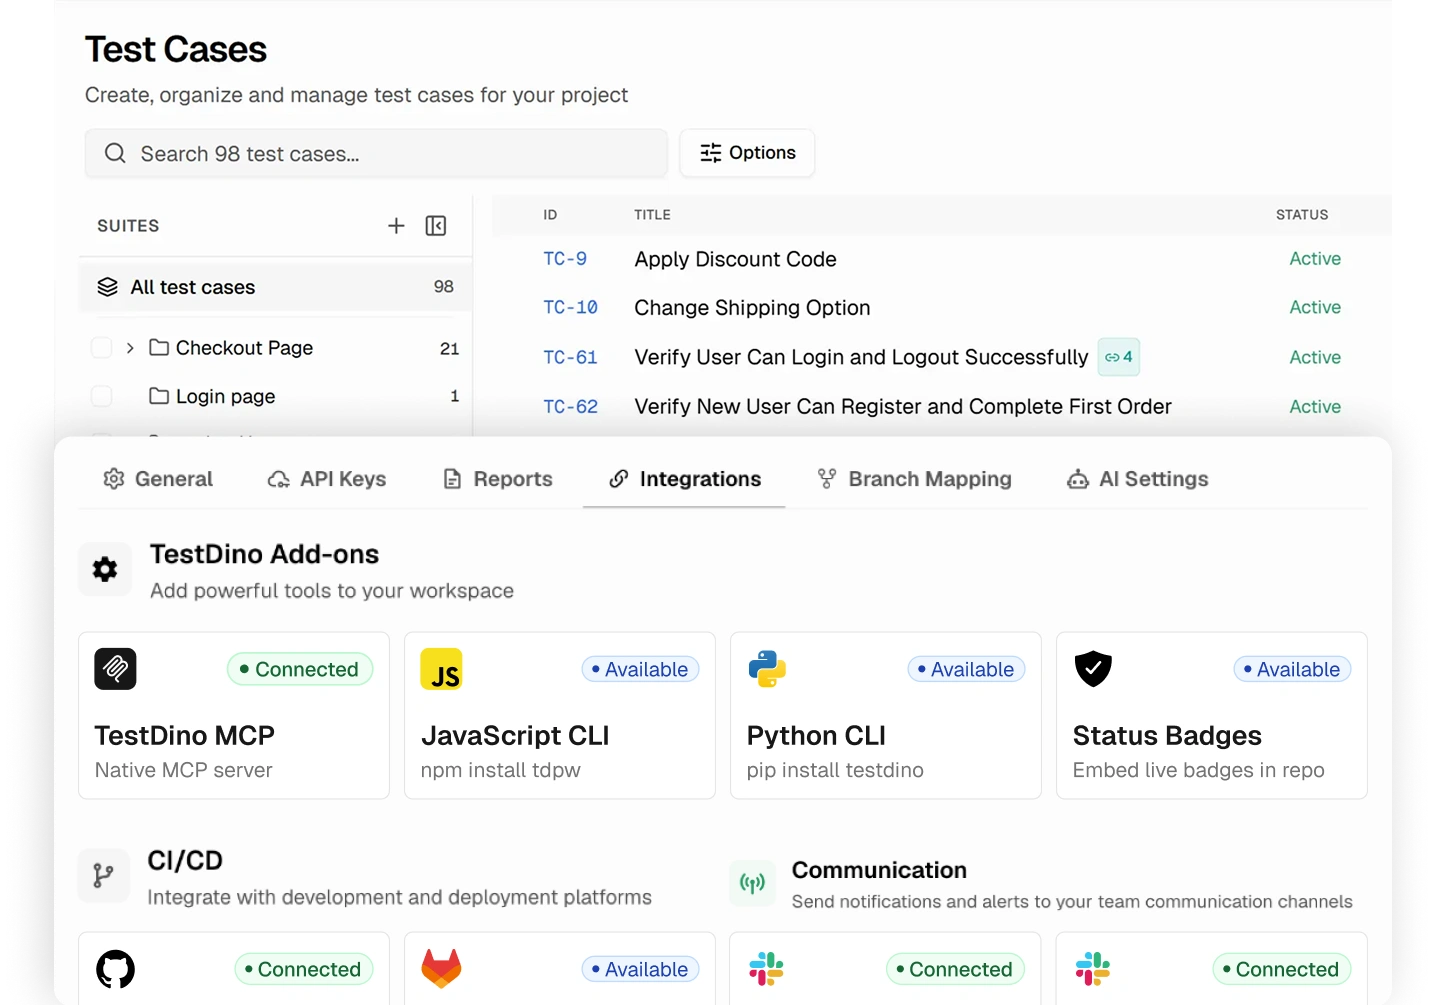
Test management isn't part of Allure Report. Bug tracker links are added per test through metadata calls in the test code to generate clickable Jira or GitHub Issues links from issue IDs.
Purpose-built capabilities that help Playwright teams ship faster and debug smarter.
Watch test results stream as each test completes. Shard-aware, no refresh needed.
Screenshots, video, and retry-level evidence are attached to every failed test attempt.
Rerun only failed tests with shard and branch awareness. Cut CI retry time.
Where each platform focuses.
Allure Report is a free, open-source HTML report generator with adapters for over 30 testing frameworks and languages.
Free and Open Source
Apache 2.0 license. No cost to run. Teams that self-host already have a working pipeline and no vendor dependency.
Framework-Agnostic
Adapters for Java, Python, .NET, Ruby, JavaScript, Go, and more. Works with any test framework across any language.
Customizable HTML Reports
Epics, features, stories, severity, BDD hierarchies, and custom attachments. Deep customization for teams that want control over how results are presented.
TestDino is a Playwright cloud companion. It records CI runs, detects flakes, and keeps traces and fix workflows ready for teams and AI agents over MCP.
AI-Powered Failure Classification
Every failure is tagged as Actual Bug, UI Change, Unstable Test, or Miscellaneous. Triage starts at the top of the list, not inside a regex rules file.
Inline Playwright Debugging
Trace viewer, screenshots, video, and console logs all open inline on the failed test. No local trace viewer, no artifact downloads.
Cross-Run Flakiness Detection
Retry analysis plus pattern detection across run history. Flakes get caught even when CI retries aren't enabled and without a manually preserved history folder.
TestDino MCP Server
Lets AI coding agents query Playwright test runs, debug failures with full retry and artifact context, detect flaky tests, and manage manual test cases and suites, all from the editor.
Verified reviews from QA and engineering teams running Playwright in production.

Analyzing failed Playwright runs in CI used to eat up a lot of our time. TestDino solved that with a centralized dashboard that pulls in screenshots, logs, and failure trends in one place. What's been most useful is the automatic grouping of failures, since instead of checking each failing test individually, we can immediately see patterns and likely causes. It's made triaging failures, and identifying which tests are simply flaky, dramatically faster.

Lead Software Engineer
We inherited an existing test suite without much context on how it was built, and TestDino gave us a real way to take ownership of it. It shows us clearly which tests are the slowest, the flakiest, and the ones failing most often, which has been essential for knowing where to focus our effort. It's given us the visibility to understand the current state of the code and steadily improve its reliability.

Senior QA Engineer at Penpot by Kaleidos
I monitor everything my tests do, from the full list of tests to detailed error screenshots. The GitHub integration is smooth, so commit hashes, CI runs, and HTML reports open straight from the dashboard. I use TestDino almost every day, and it has improved the quality of our automation code.

Lead QA Automation Engineer
Before TestDino, we were manually digging through raw reports to catch flaky and failing tests, and it took a lot of time. Now everything is stored and analyzed automatically, with no extra setup layers needed. The installation itself was simple, and it's made spotting flaky tests a much faster, cleaner process for our team.
Test Automation Team Lead
TestDino gives us a clean dashboard and reporting setup that's genuinely easy to work with, packed with useful analytics. It's effectively replaced what used to be a custom Power BI dashboard for us, while being far simpler to set up and maintain. The platform makes it easy to centralize and visualize results, so tracking trends and understanding failures no longer takes extra effort.
QA Automation Engineer
Reviewing our Playwright test results used to mean sifting through raw output to figure out what actually broke. TestDino changed that by giving us a clear, structured view of every run. Failed tests are easy to spot right away, and debugging that used to take real effort now moves a lot faster.
Automation Engineer
Enterprise-grade security so your team can focus on shipping instead of worrying about data.
Secure authentication, role-based access control, and data encryption safeguard your test data in transit and at rest.
Persistent analytics with historical tracking deliver reliable insights about test performance, coverage, and release readiness.
Automated backups and retention policies maintain a complete history of test data. Project-scoped access prevents unauthorized changes.
Allure Report is free and self-hosted. TestDino is a managed platform with a Free plan and a Pro plan from $39/month billed annually ($49 monthly).
Free to use under Apache 2.0. Self-hosting, artifact storage, and history preservation are your team's responsibility.
Competitor pricing shown as published on the vendor's website and may vary. Check the vendor's pricing page for current rates.
Static HTML reports per run
Framework-agnostic (30+ adapters)
Categories, timelines, and trend widgets
History and flakiness (requires CI setup)
Attachments: screenshots, video, traces
BDD support and custom hierarchies
Self-managed hosting required
Community support
For dev teams shipping to production. Up to 3 users, no per-test overage.
10,000 test executions per month
Up to 3 users
3-month data retention
AI failure classification with confidence scores
TestDino MCP Server with test case writes
PR view and CI/CD optimization
Embedded trace viewer and debugging features
Slack notifications and GitHub PR comments
Competitor pricing shown as published on the vendor's website and may vary. Check the vendor's pricing page for current rates.
Stop wasting time on
flaky tests
No. TestDino is a managed platform. The reporter sends results to a hosted dashboard on every CI run. There's no artifact server to configure, no history subfolder to preserve, and no GitHub Pages or S3 bucket to maintain. Trend data accumulates automatically from the second run onward.
Side-by-side comparisons of features, pricing, and integrations to help you pick the right testing tool.
All product names, logos, and trademarks referenced on this page are the property of their respective owners. TestDino is not affiliated with, endorsed by, or sponsored by any competitor named above. Competitor features and pricing reflect publicly available information as of May 2026 and may have changed since. Check with each vendor for current details.