
See exactly what happened. Screenshots and video.
Failure screenshots, full video, console logs, and retry-level evidence for every test attempt in one dashboard.








Debugging blind because CI
gives you no visual evidence
A test fails in CI, you get a cryptic error, and you spend an hour trying to reproduce locally.

“It passed on my machine”
The test fails in CI but works fine locally. You have no visual proof of what actually happened in the headless browser. Was it a layout shift? A missing element? Without screenshots or video, you're guessing.
Re-running tests locally to see the failure
You pull the branch, run the test, and it passes. You run it again. It passes again. You've wasted 30 minutes and still have no idea what went wrong in CI.
Scrolling through raw HTML reports for a single screenshot
Your CI saves Playwright's HTML report as an artifact. You download it, unzip it, open it in a browser, and click through a tree of specs just to find one screenshot.
No way to see what happened across retries
Playwright retried the test three times before it passed. Was the first attempt a real failure or just flaky? You can't tell because the retry evidence is collapsed or missing entirely.
How screenshots and video work
Automatically collects screenshots, video recordings, and retry-level artifacts from every Playwright test run. No extra configuration, no file management.
Add the TestDino reporter
One line in your Playwright config and every test run starts sending visual evidence to TestDino automatically. No wrappers, no new dependencies.

reporter: [
  ['@testdino/playwright', {
    token: process.env.TESTDINO_TOKEN
  }],
]
npx playwright testEvidence is captured per attempt
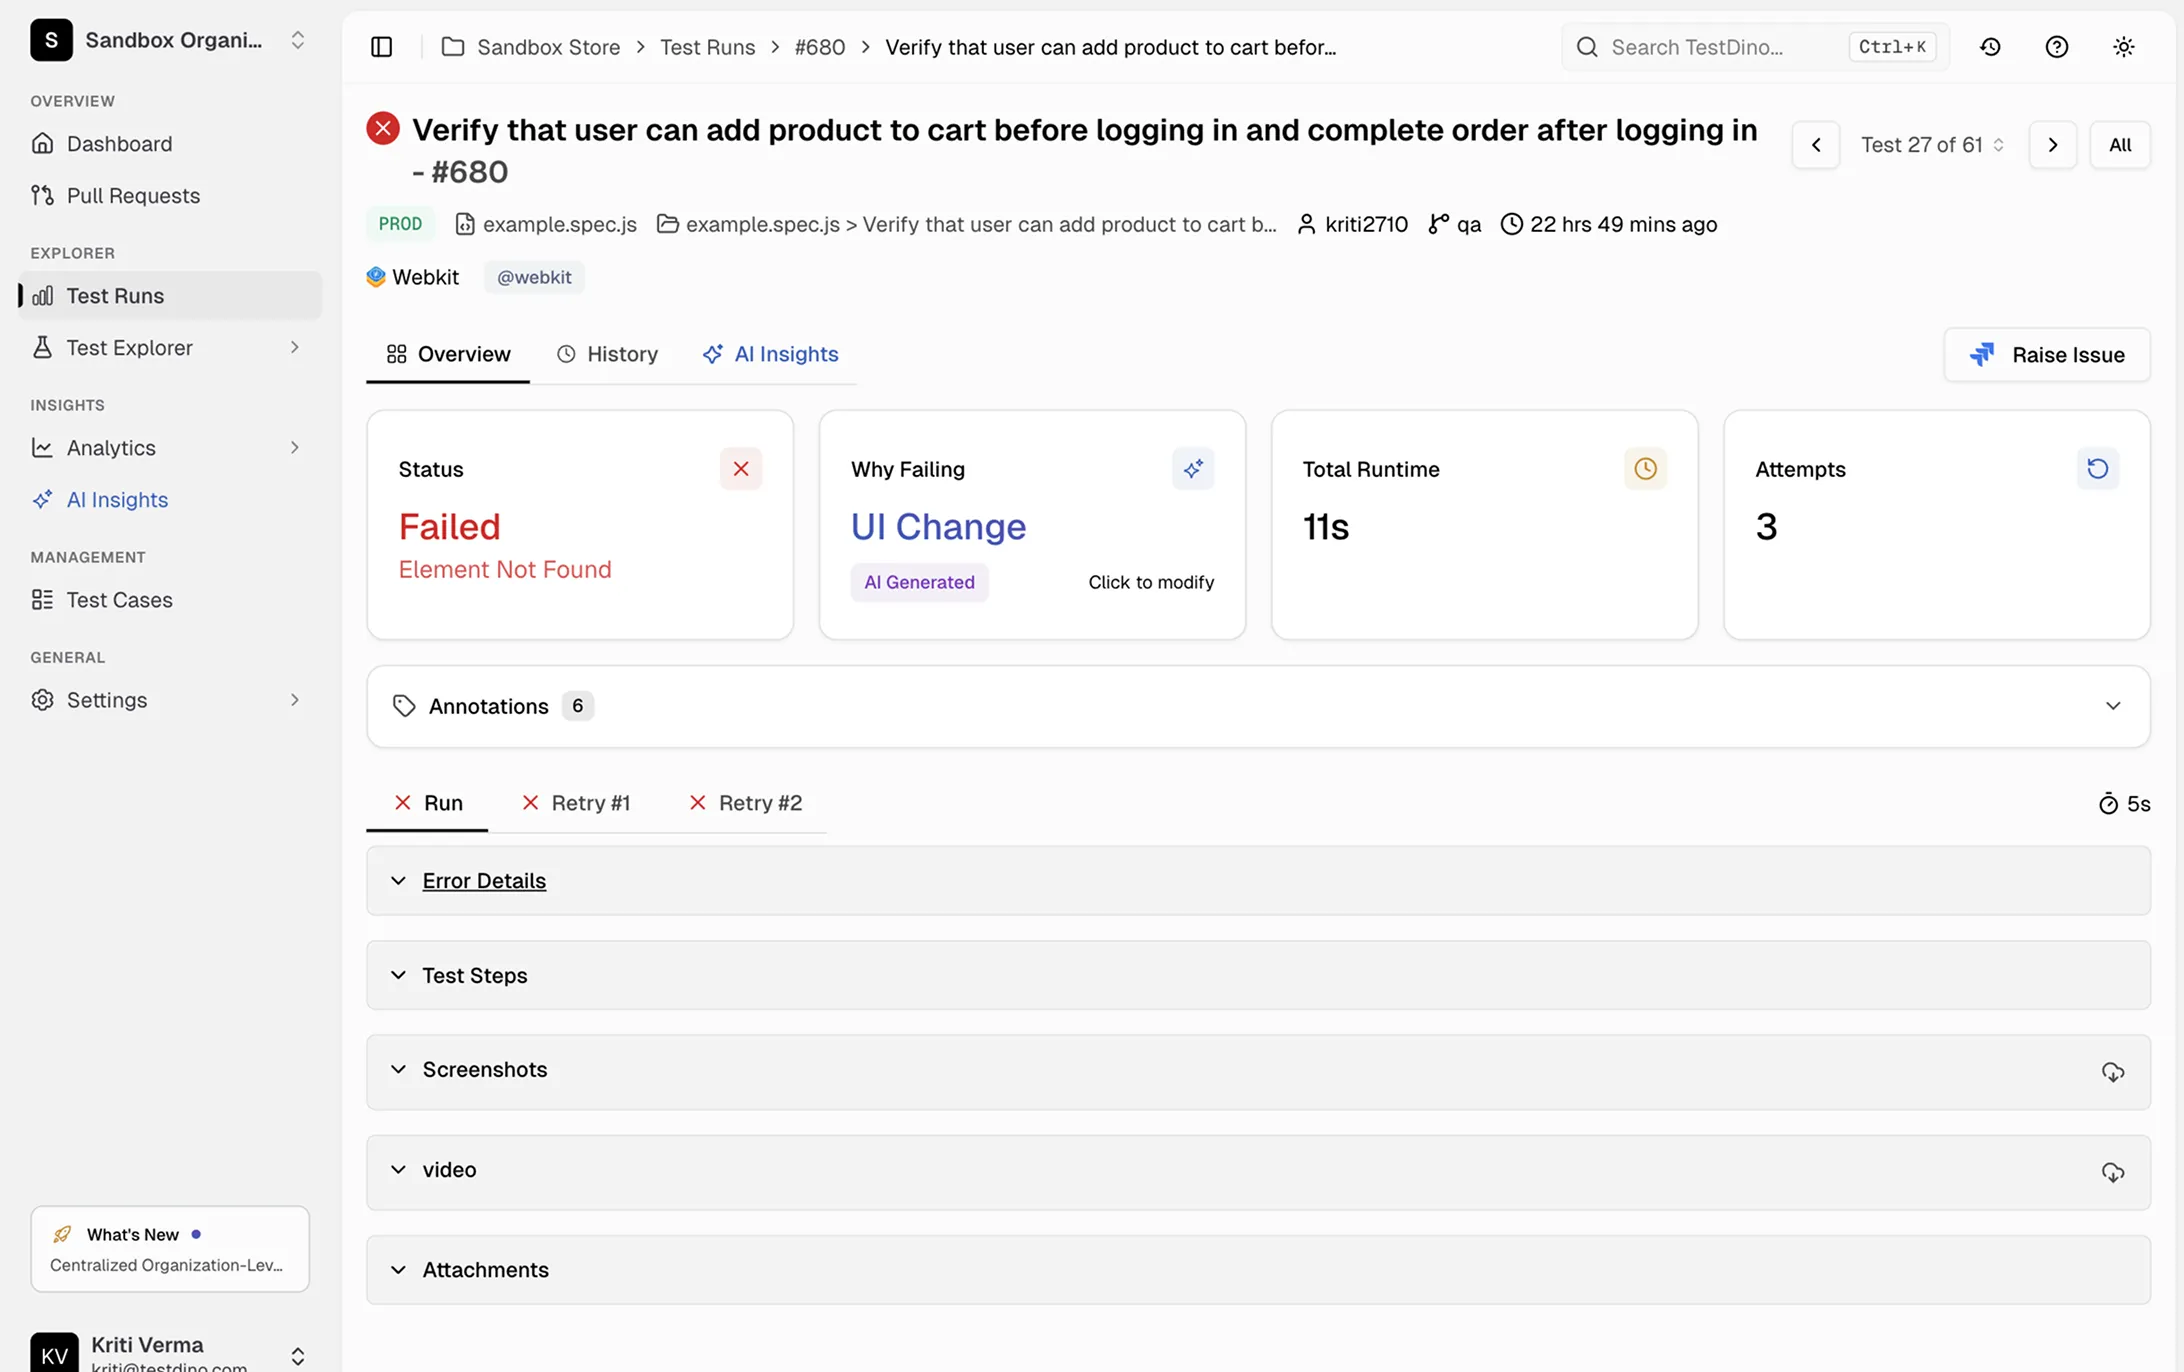
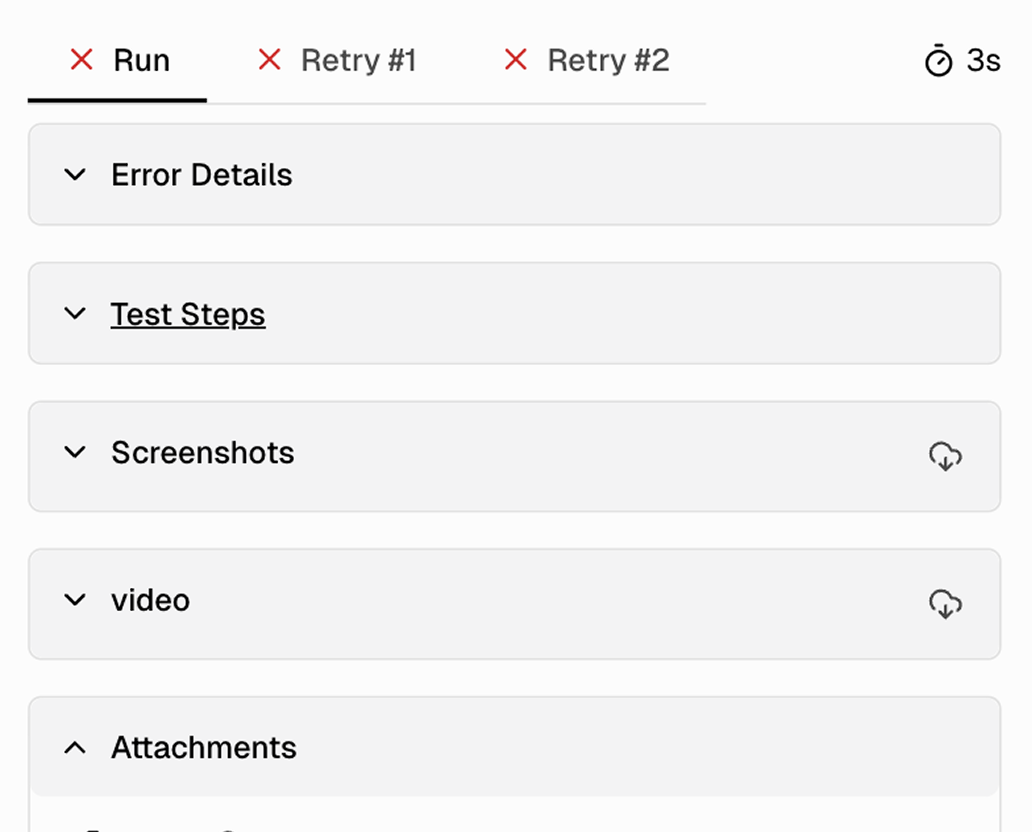
TestDino collects failure screenshots, full execution video, console logs, and trace data for every test attempt. Each retry gets its own tab with independent artifacts so you can compare what changed between attempts.

Click any test to see the full evidence
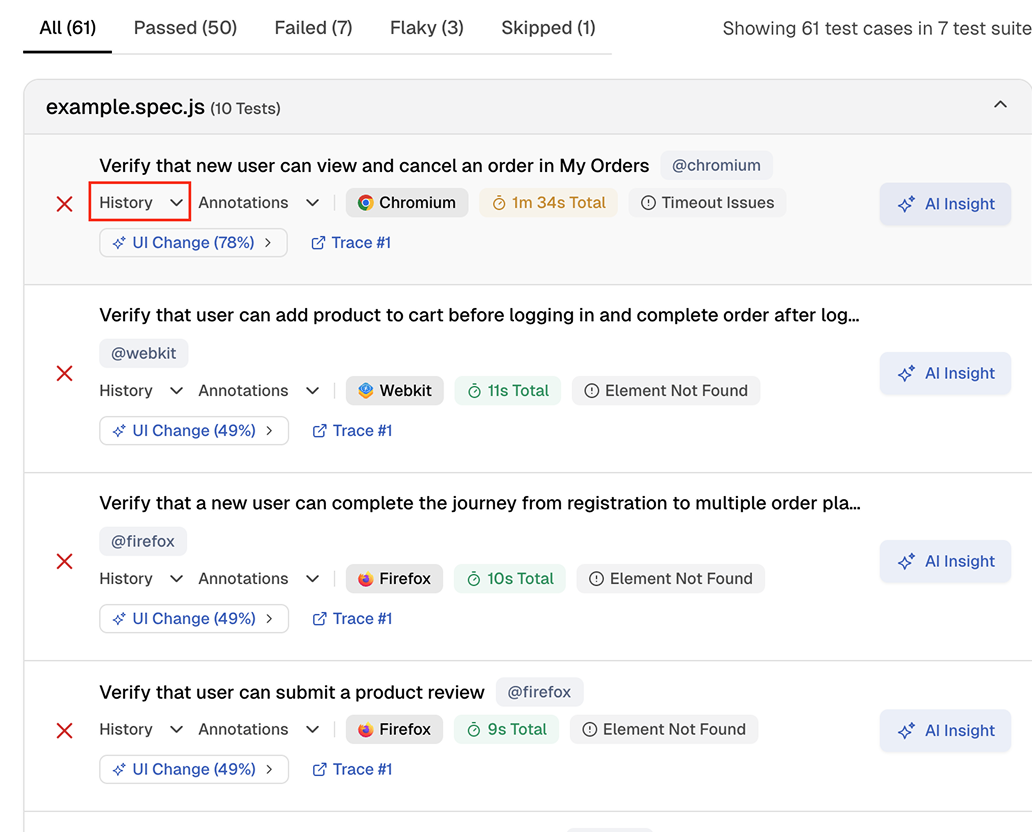
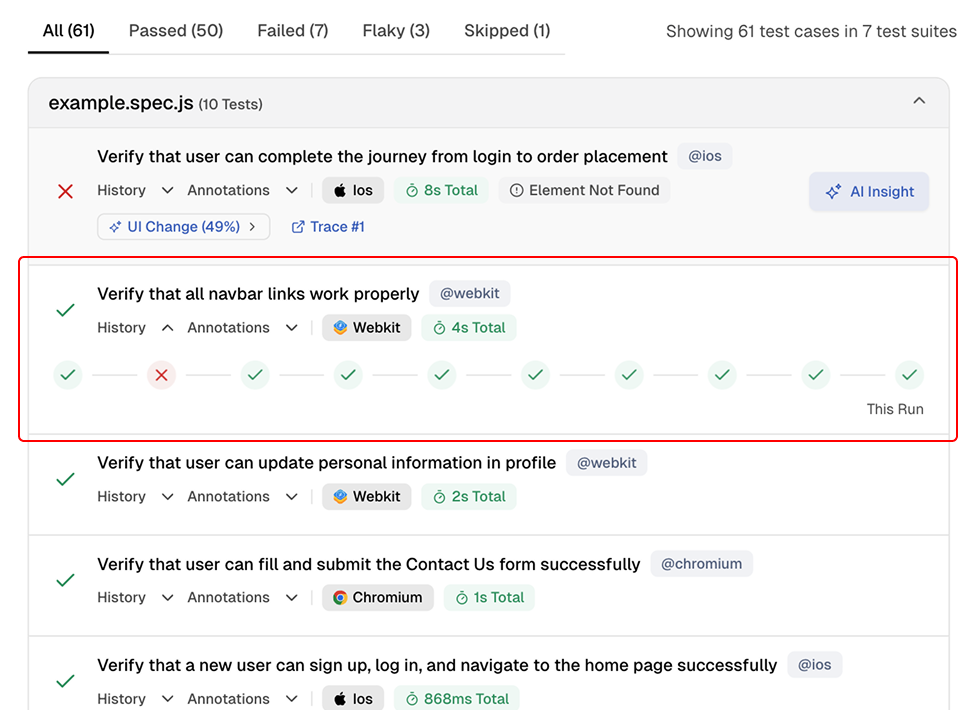
Open any spec file to see every test case with its status, browser, annotations, and history indicators. Click into a failing test to view error details, screenshots, video, and trace links.
Let your AI agent debug failures for you
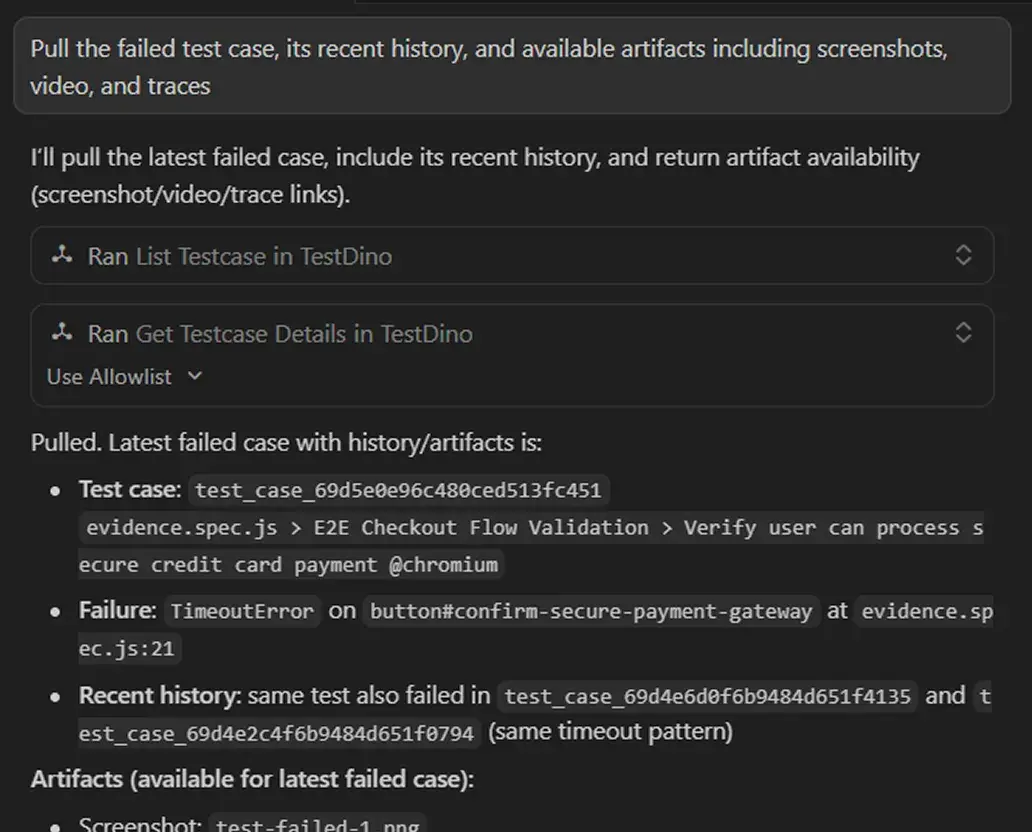
Connect TestDino's MCP server to Cursor, Claude Code, or Copilot. Your AI agent pulls screenshots, video, traces, and failure history without any downloads or local setup. It sees the evidence, understands the failure, and suggests a fix right in your editor.

Visual evidence vs digging
through CI artifacts
Failure screenshots at the exact moment of failure
Full page screenshots captured when a test fails. See the complete page state including layout, elements, and error modals without re-running.
Video playback with timeline controls
Full video of the browser during the test with timeline seeking. Watch page loads, interactions, and the exact moment it broke.
Per-attempt tabs with independent artifacts
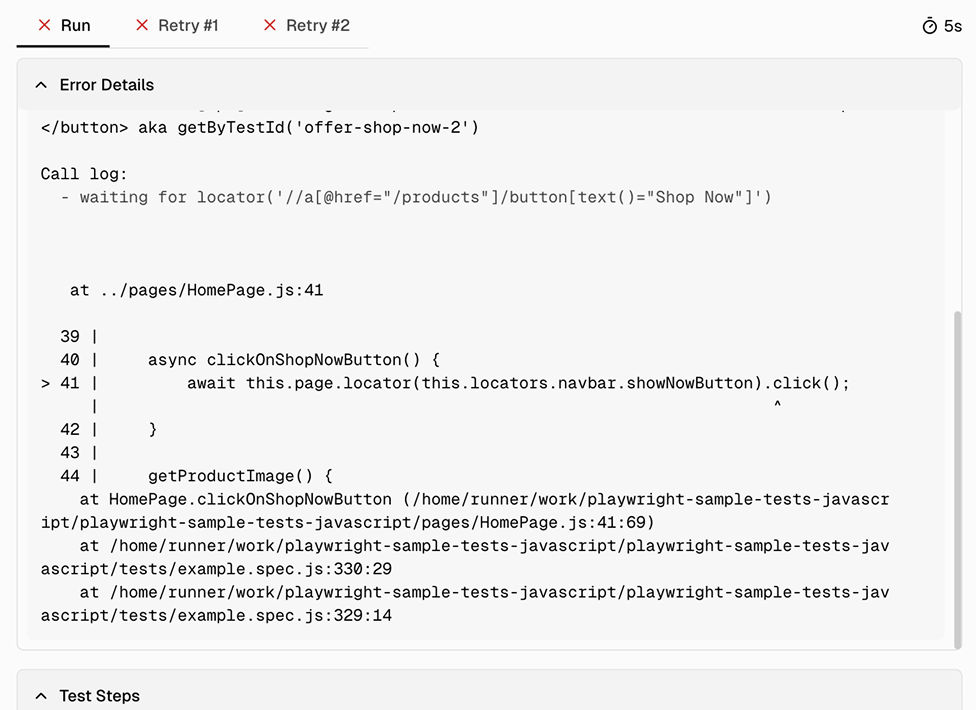
Each retry gets its own tab (Run, Retry 1, Retry 2) with separate screenshots, video, console logs, and error details. Compare attempts side by side.
Console logs with JS errors and warnings
Browser console output captured per attempt. Spot JavaScript errors, failed network requests, and application warnings alongside the visual evidence.
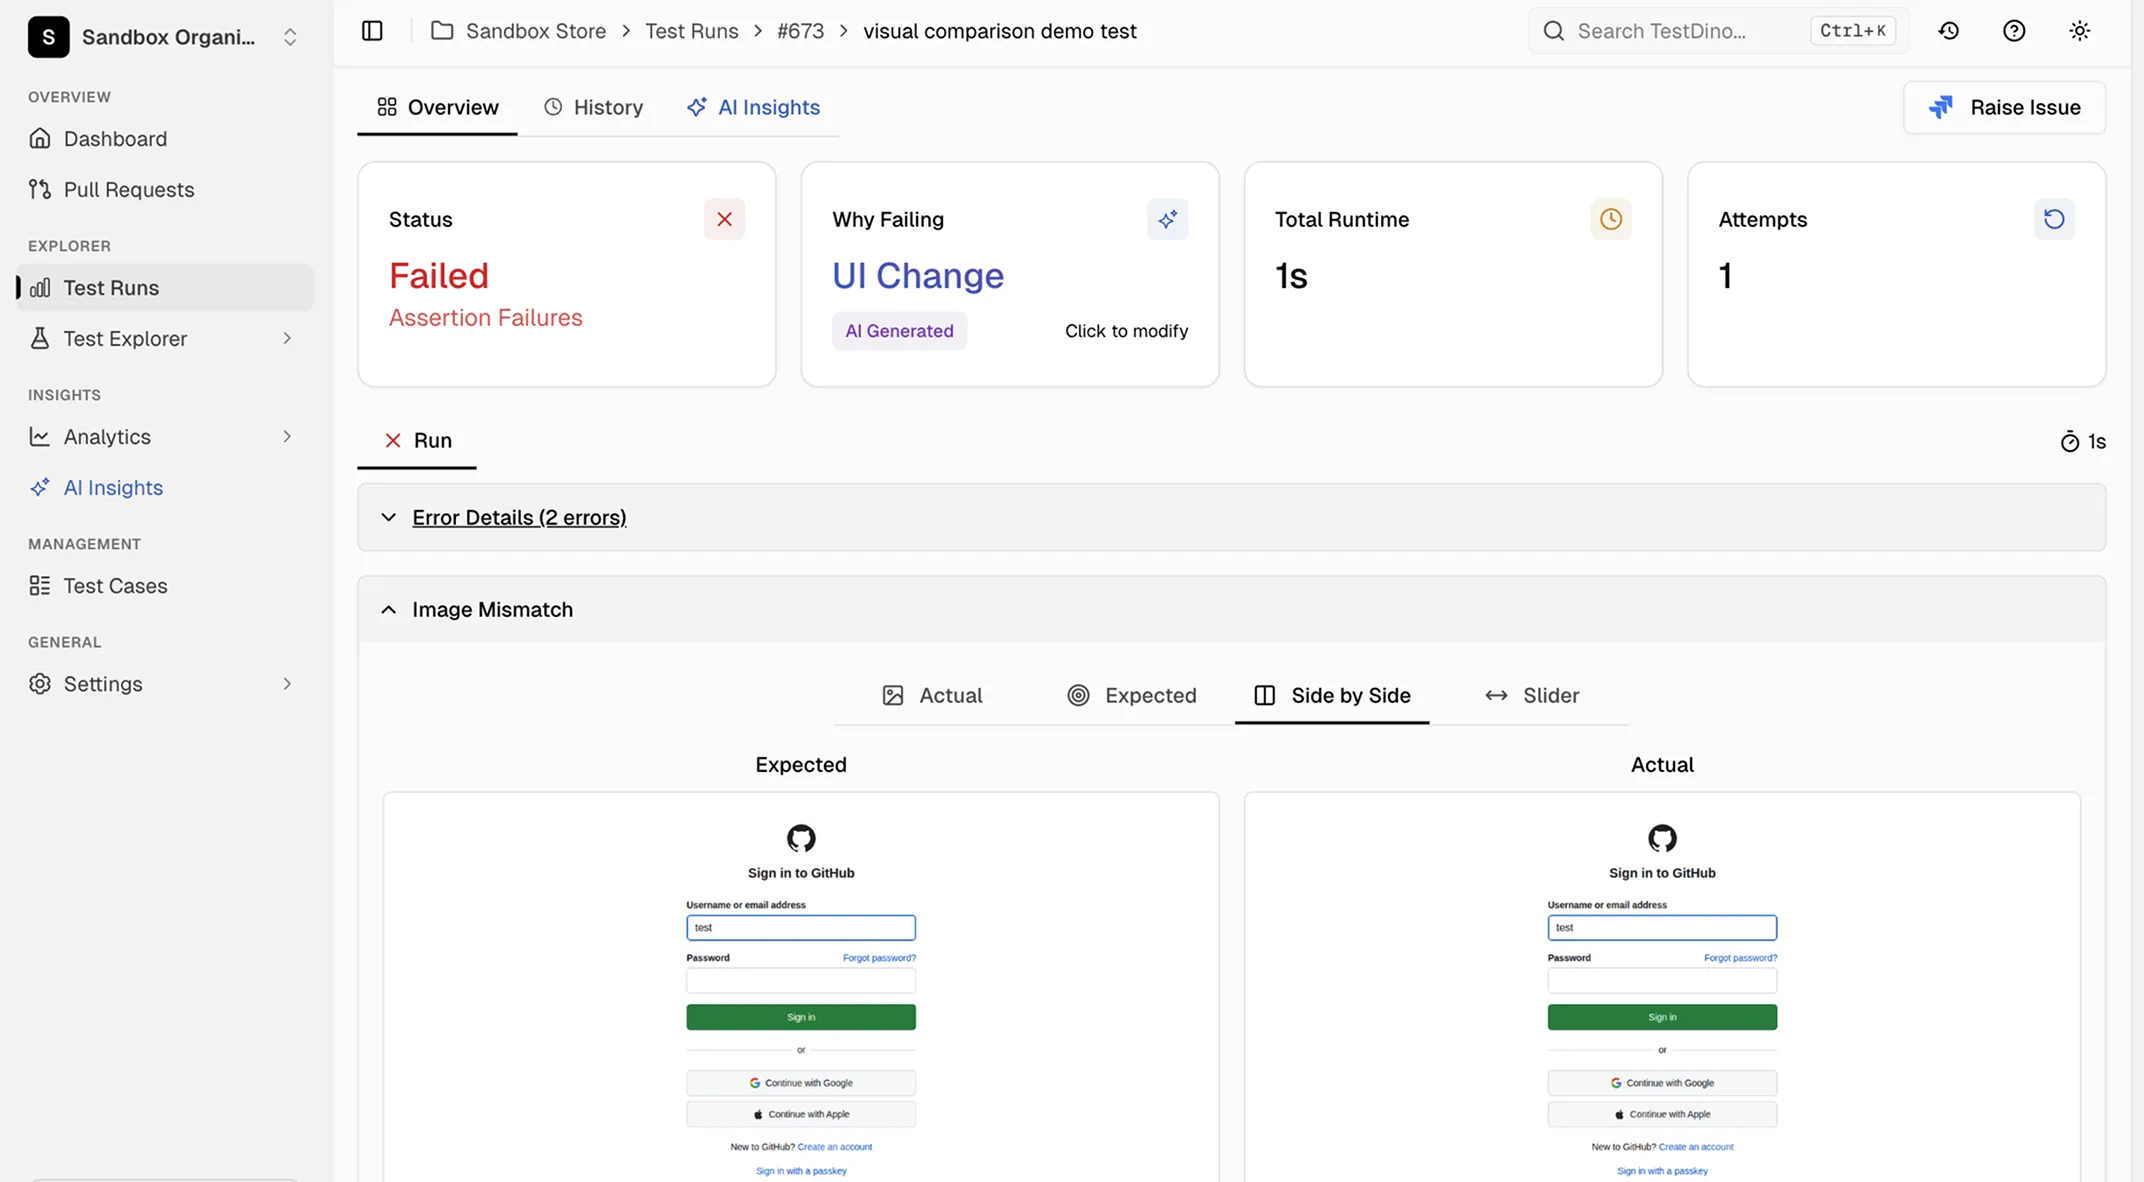
Visual comparison for screenshot assertions
Multiple comparison modes for toHaveScreenshot() tests: Diff, Actual, Expected, Side-by-Side, and Slider. See exactly what changed pixel by pixel.
Test data kept for 90 days on every plan
CI artifacts expire in 7 to 30 days. TestDino keeps test runs and results for 90 days on every plan, and artifacts like screenshots and videos for 21 days. Look back at failures long after CI has cleaned up.
What you get with screenshots and video
Visual evidence for every attempt, organized in one dashboard.
Visual comparison modes for screenshot assertions
When a toHaveScreenshot() assertion fails, TestDino shows diff, actual, expected, side-by-side, and slider views so you can see exactly what changed between the baseline and the test result.
Error details and test steps with full call context
Expand the error details section to see the exact locator, assertion code, call log with timing, and every retry attempt. Test steps show per-step duration so you can pinpoint where the test spent its time.
Test case history across past executions
The history preview shows the current run alongside recent past executions. Spot patterns like a test that started failing after a specific commit or one that only fails on certain days.
Works with your favourite tools
Connect Jira, Slack, GitHub, Linear, Azure DevOps, Asana, and monday to keep your workflow smooth and your team aligned.





FAQs
TestDino works with Playwright's built-in video and screenshot capabilities. If you already have video or screenshot settings in your Playwright config, TestDino captures and organizes those artifacts automatically. If you don't have them enabled, TestDino's reporter can still capture failure screenshots and trace data.