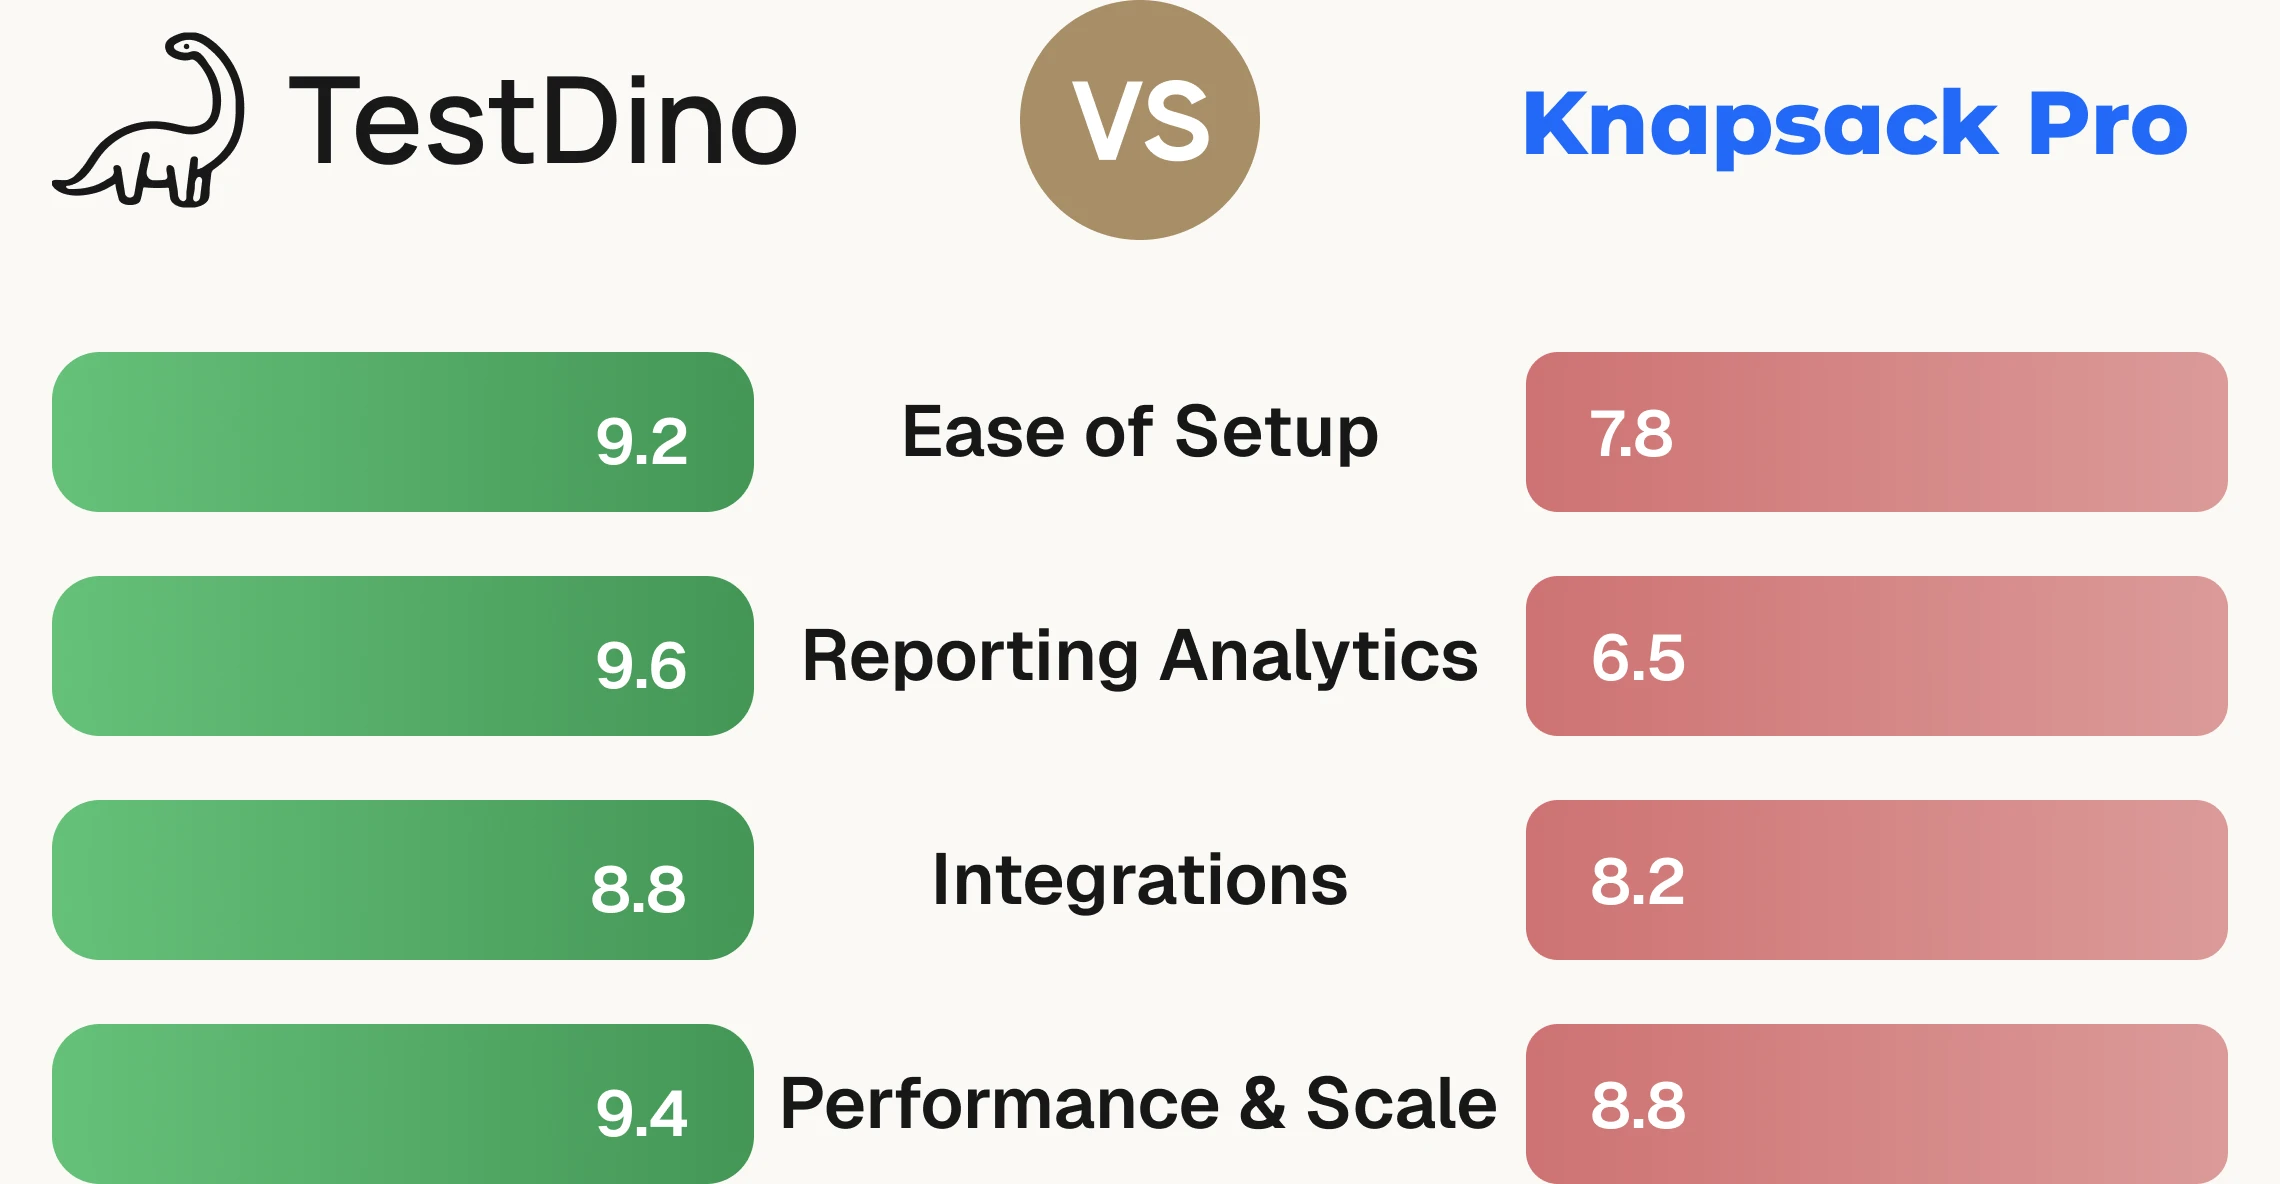
Compare Knapsack Pro vs TestDino. See how TestDino adds test intelligence, flaky detection, PR-linked history, and MCP agent workflows to fast CI.
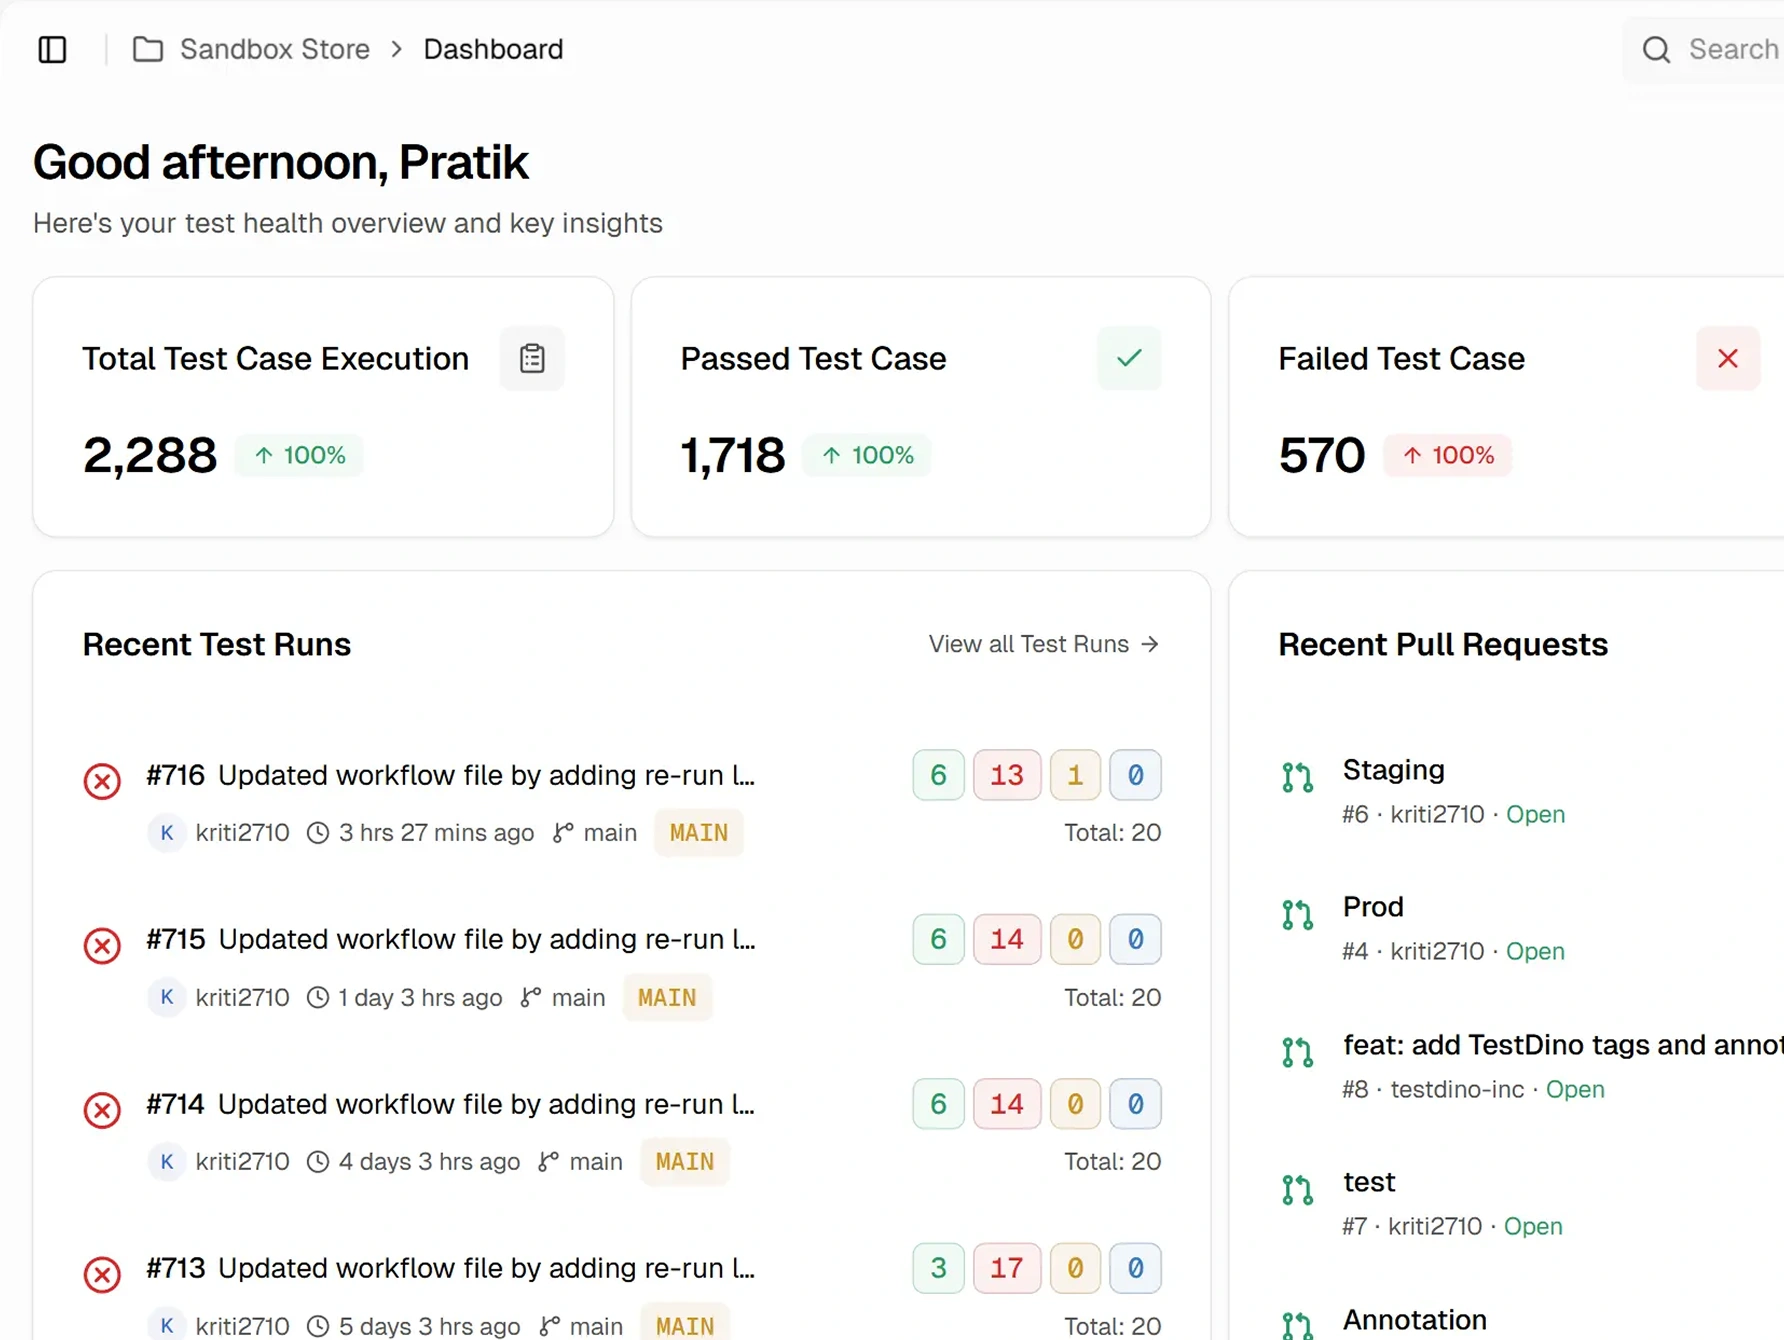
Both tools speed up CI with intelligent test splitting and parallel execution, but TestDino goes further with built-in test reporting. It links every test run to its pull request, detects flaky tests, and makes your entire test history available to Claude Code, Cursor, or any MCP-compatible agent through its MCP Server.
Beyond CI optimization, TestDino includes built-in test management. Test cases, manual runs, exploratory testing, and release tracking all live in one place, giving engineering teams complete visibility into their testing workflow.
Knapsack Pro vs TestDino comes down to scope. Knapsack Pro helps teams run tests faster. TestDino combines fast CI with test intelligence, built-in test management, and AI-powered workflows.
MCP Server for AI agents
Claude, Cursor, and Copilot can query test results, analyze failures, and manage test cases through natural language directly from your coding environment. Knapsack Pro offers no AI agent access.
Built-in test management
Test cases, manual runs, exploratory sessions, and release tracking all live in one platform. Teams don't need a separate tool to organize and track quality.
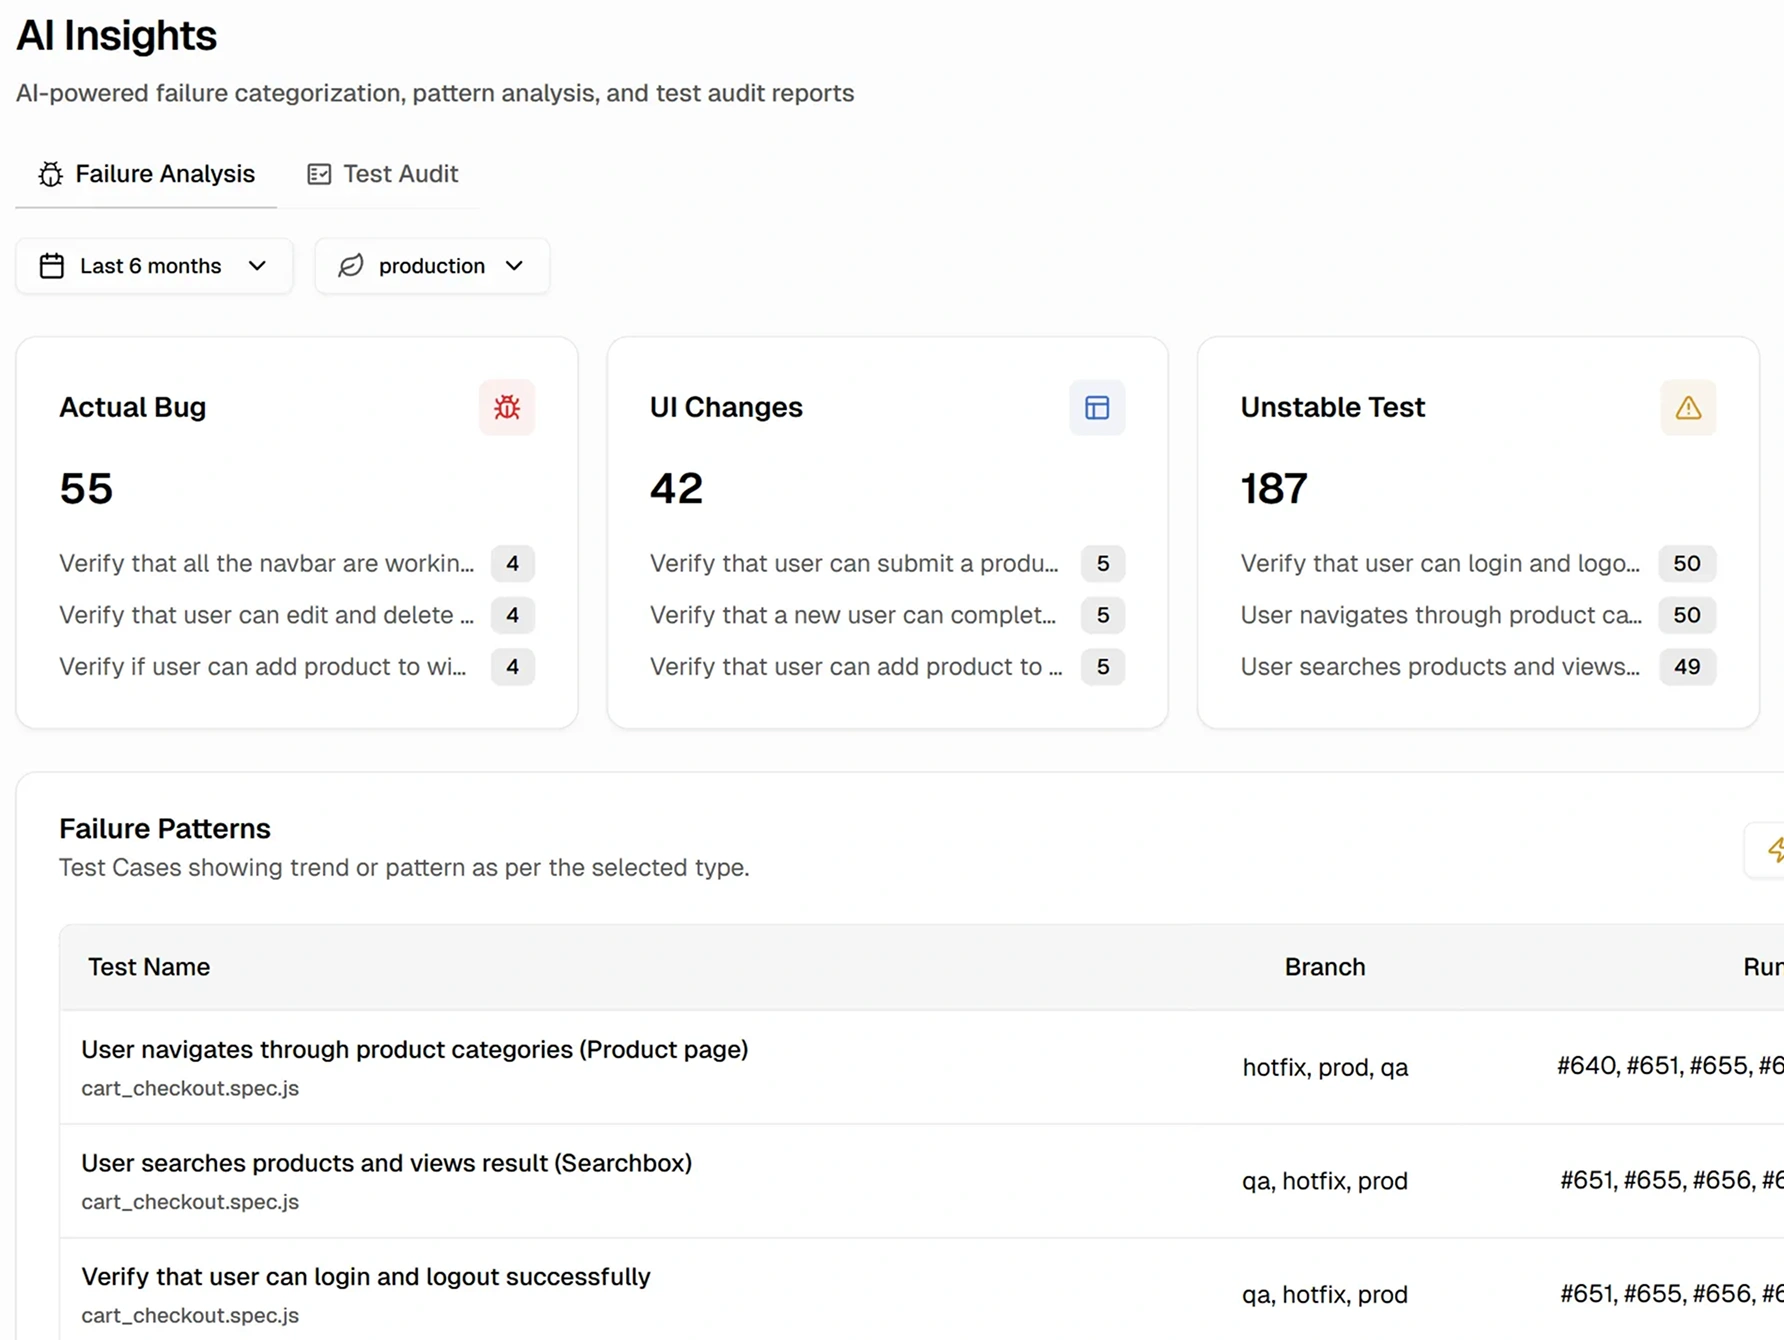
Flaky test detection
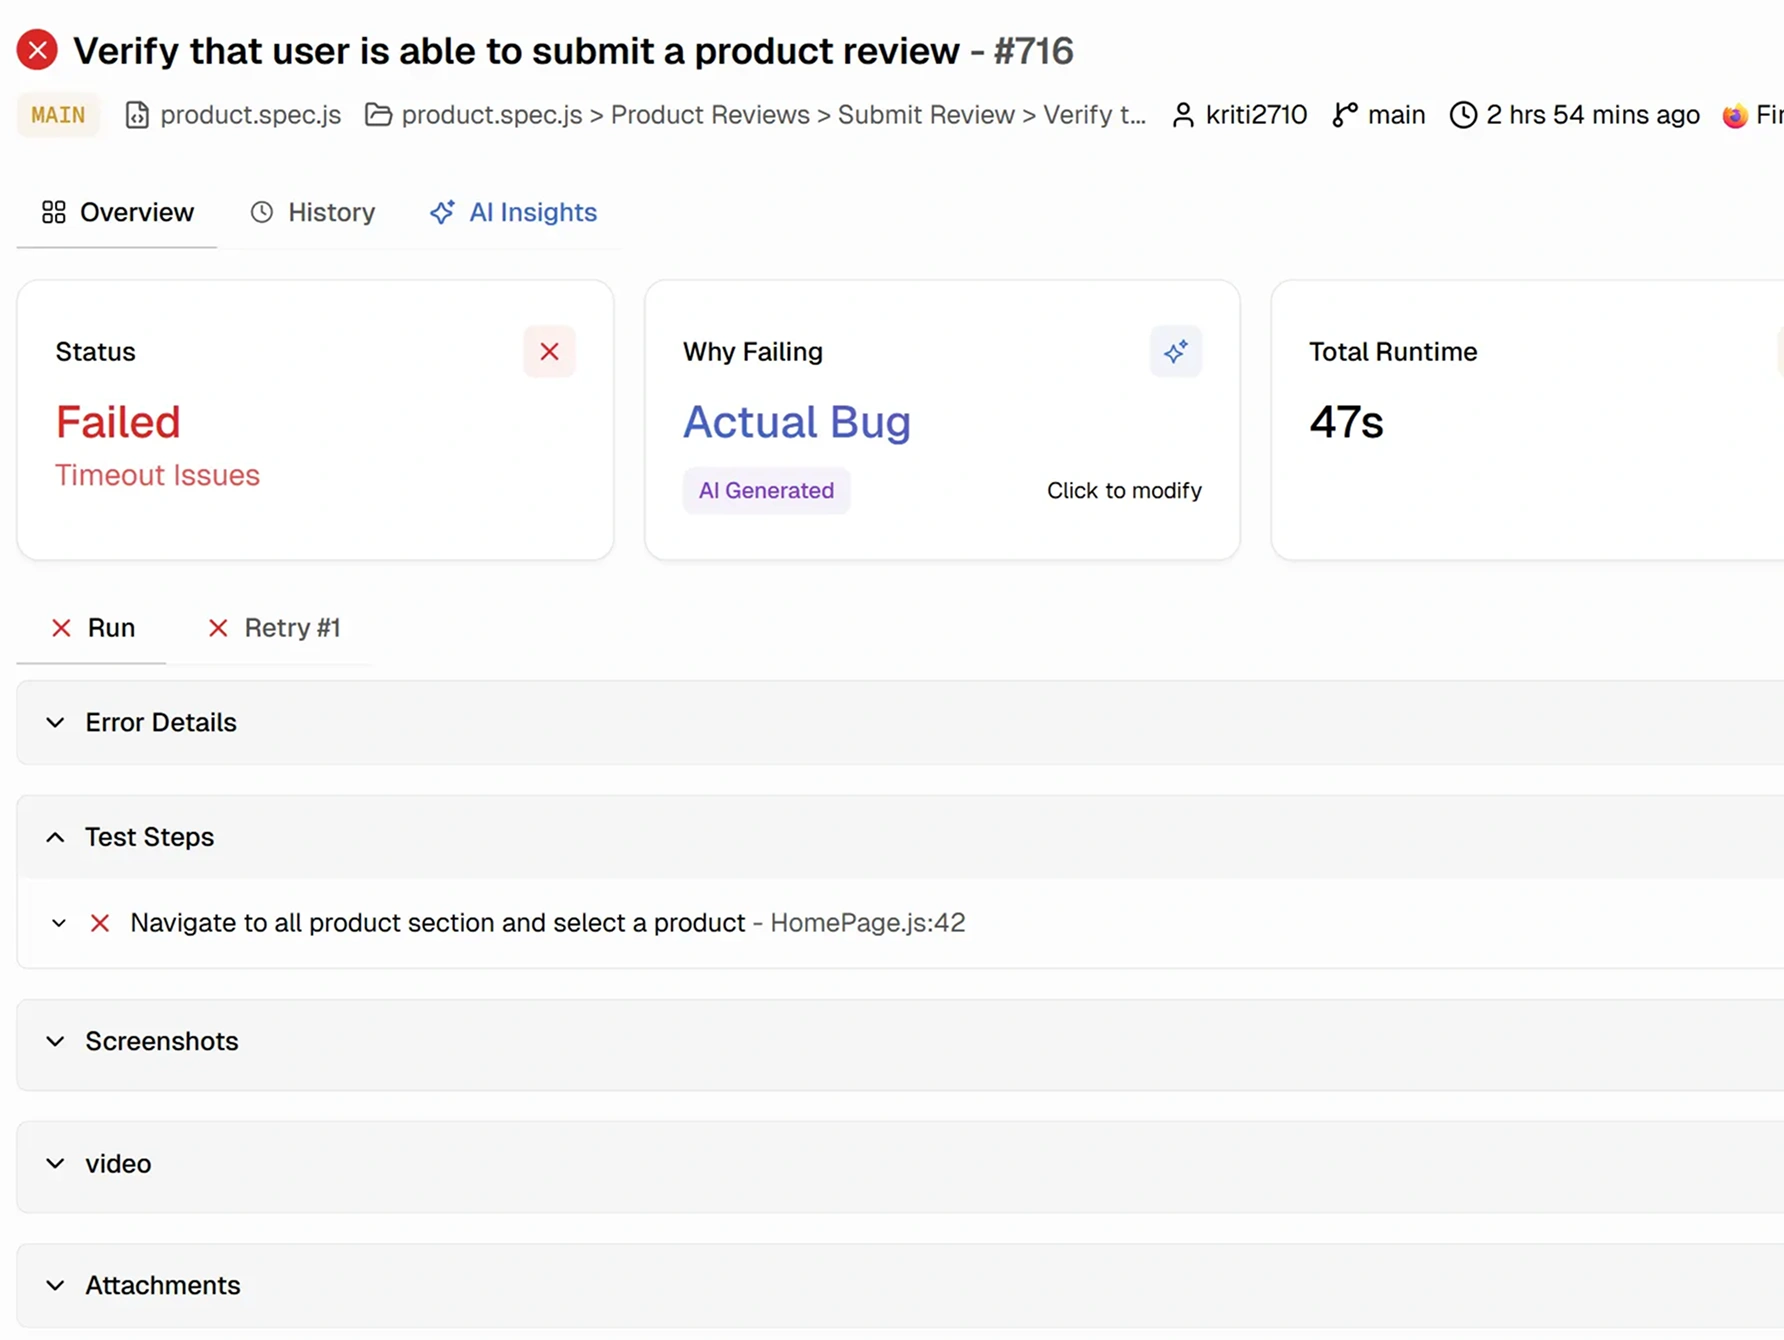
Every test gets a stability percentage and root cause category (timing, environment, network, or assertion), so teams can see which tests are unreliable and why.
PR-linked test history
Every test run is connected to the pull request that triggered it, making it easy to identify when failures were introduced, compare runs, and trace regressions over time.

Limited visibility beyond CI
Knapsack Pro excels at speeding up CI pipelines but doesn't provide built-in test management, release tracking, or a centralized repository for test cases and execution history.
No AI-powered test intelligence
Knapsack Pro distributes tests efficiently but doesn't offer AI-driven failure analysis or an MCP Server that lets AI coding assistants query your testing data.
Requires additional tools
Teams often pair Knapsack Pro with separate solutions for test management, analytics, and reporting, increasing integration and maintenance effort.
Focused on execution, not quality insights
Knapsack Pro helps reduce CI time, but it doesn't help teams understand flaky tests, track quality trends, or manage the complete testing lifecycle from a single platform.
| ||
|---|---|---|
| Pricing (starts at) | $39/month (billed annually) | $10/committer/month |
| Best for | Playwright test intelligence & management | Test parallelization for Ruby, JS & more |
| Playwright integration | Native (trace viewer, error grouping, MCP) | Via reporters |
| Ease of use |  |  |
| One-step CI setup | Gem/SDK + CI YML tweaks | |
Dashboards & Reporting | ||
| Unified Playwright dashboard | Build timing & wall-time graphs only | |
| Multi-tab test run detail | Summary, History, AI Insights & more | Build metrics, node timings, bottlenecks |
| Pull request insights | ||
| Test ExplorerBrowse tests as a hierarchy, a flat list, or by tag. | ||
| Real-time streaming | Per-shard/worker | Live build view in dashboard |
| Scheduled PDF reports | Daily/Weekly/Monthly | |
Test Analytics | ||
| Analytics: trends & patterns | For test runs, test cases & more | CI build trends & timing history |
| Code coverage, per-file | Istanbul, run-level | |
| Environment analytics | Pass-rate/flaky by env | |
Debugging & Evidence | ||
| Built-in Playwright trace viewer | ||
| Screenshots & video replay | Embedded | |
| Console logs (per test) | Node + browser | |
| Visual diff comparison | ||
| Smart error grouping | Message/stack/location | |
| Flaky detection | Handles flaky tests during run; no detection dashboard | |
| Playwright tags & annotationsAttach priority, owner, links, and metrics to tests. | Priority/owner/links/metrics | |
CI/CD Optimization | ||
| Rerun only failed tests | Failed-only reruns via CLI | |
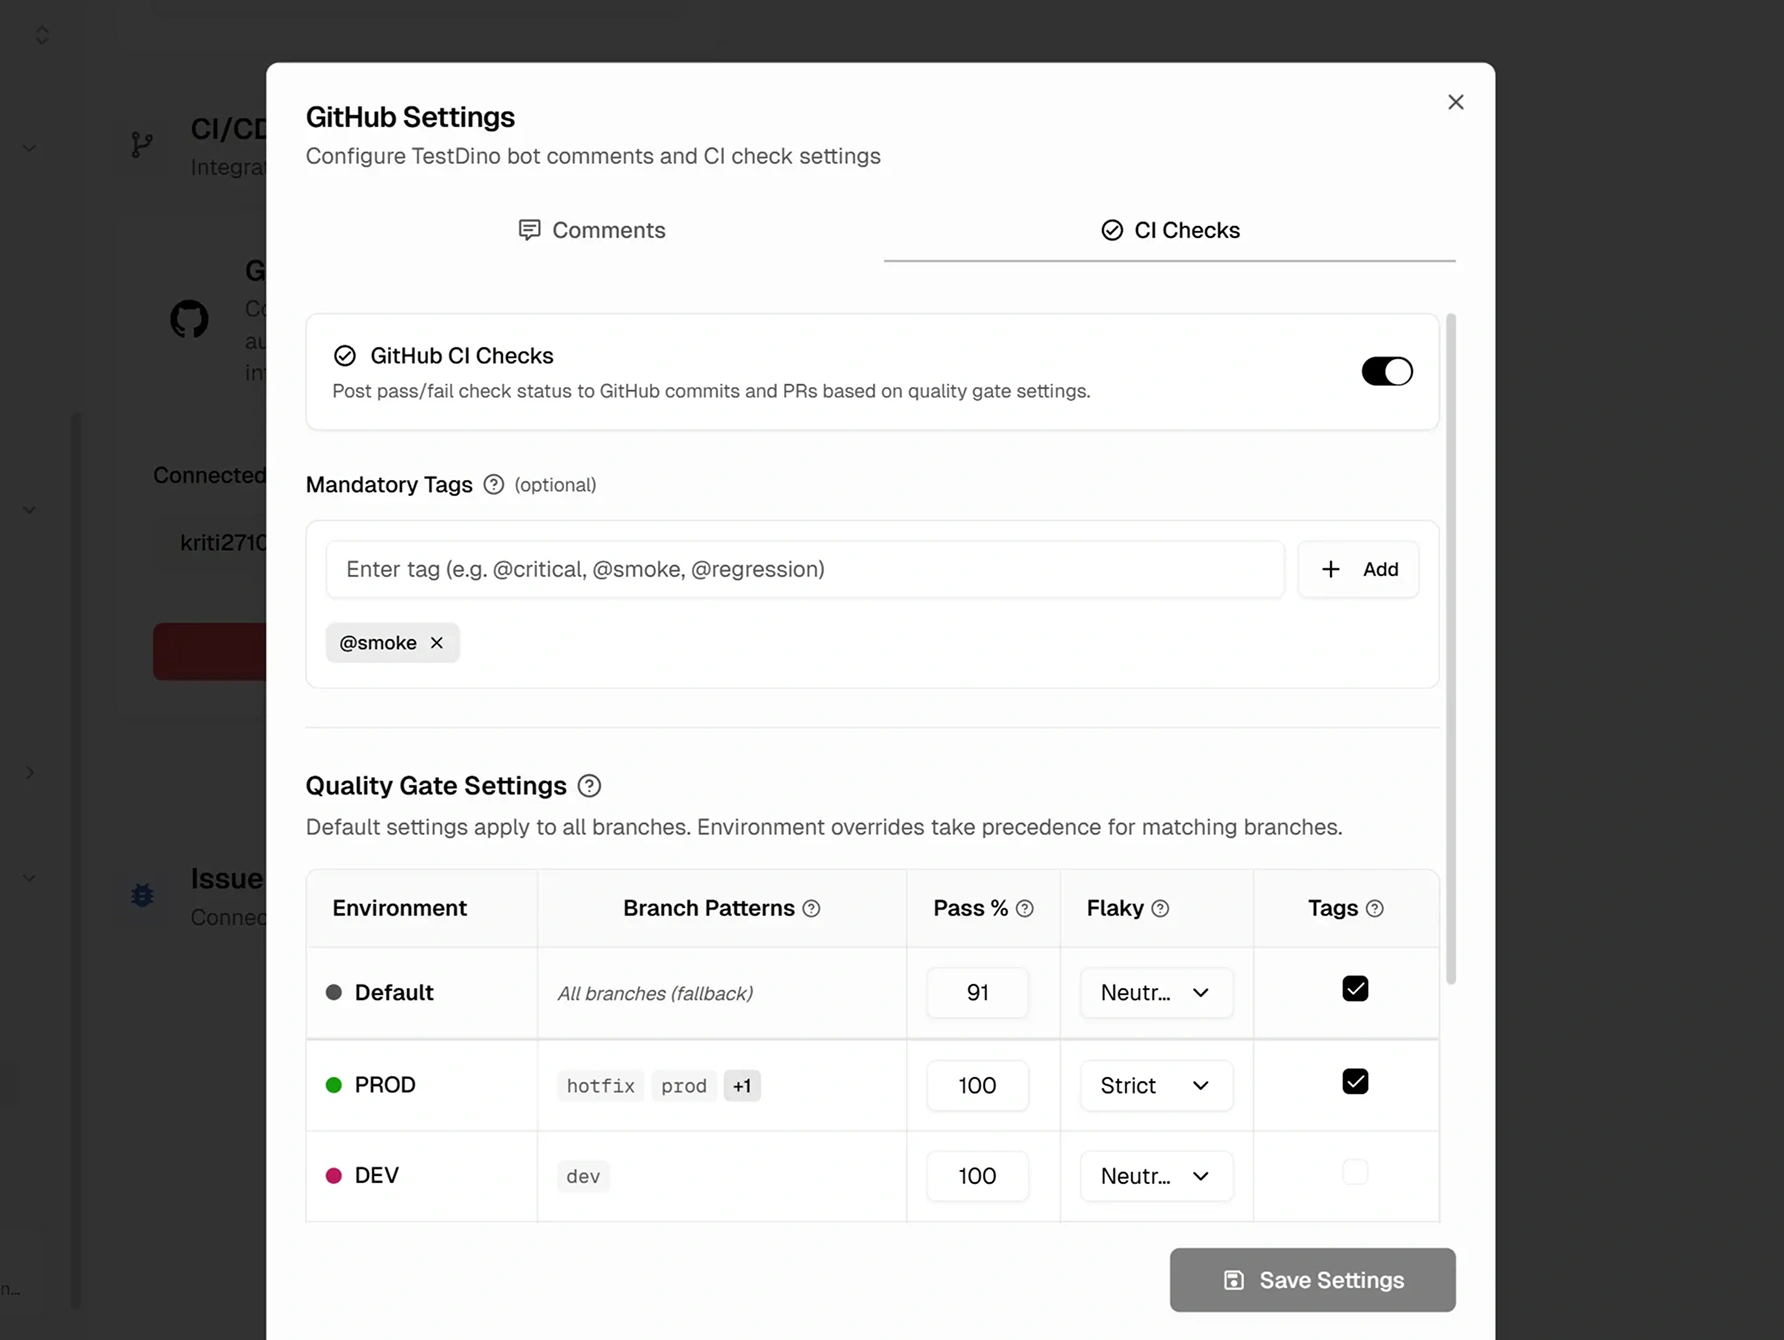
| GitHub CI Checks quality gates | Per-env + mandatory tags | |
| Branch → environment mappingMatch each Git branch to the environment it runs against. | Exact/regex | |
| Smart rerun history (branch+commit) | ||
| Sharded / parallel run support | Per-shard live view | Core feature: Queue Mode dynamic splitting |
| Native CI breadth | GitHub, GitLab, Azure DevOps, TeamCity, Bitbucket, CircleCI, Jenkins | GitHub Actions, CircleCI, GitLab CI, Buildkite, Travis CI, Jenkins, others via ENV vars |
| Self-managed GitLab | ||
Test Management | ||
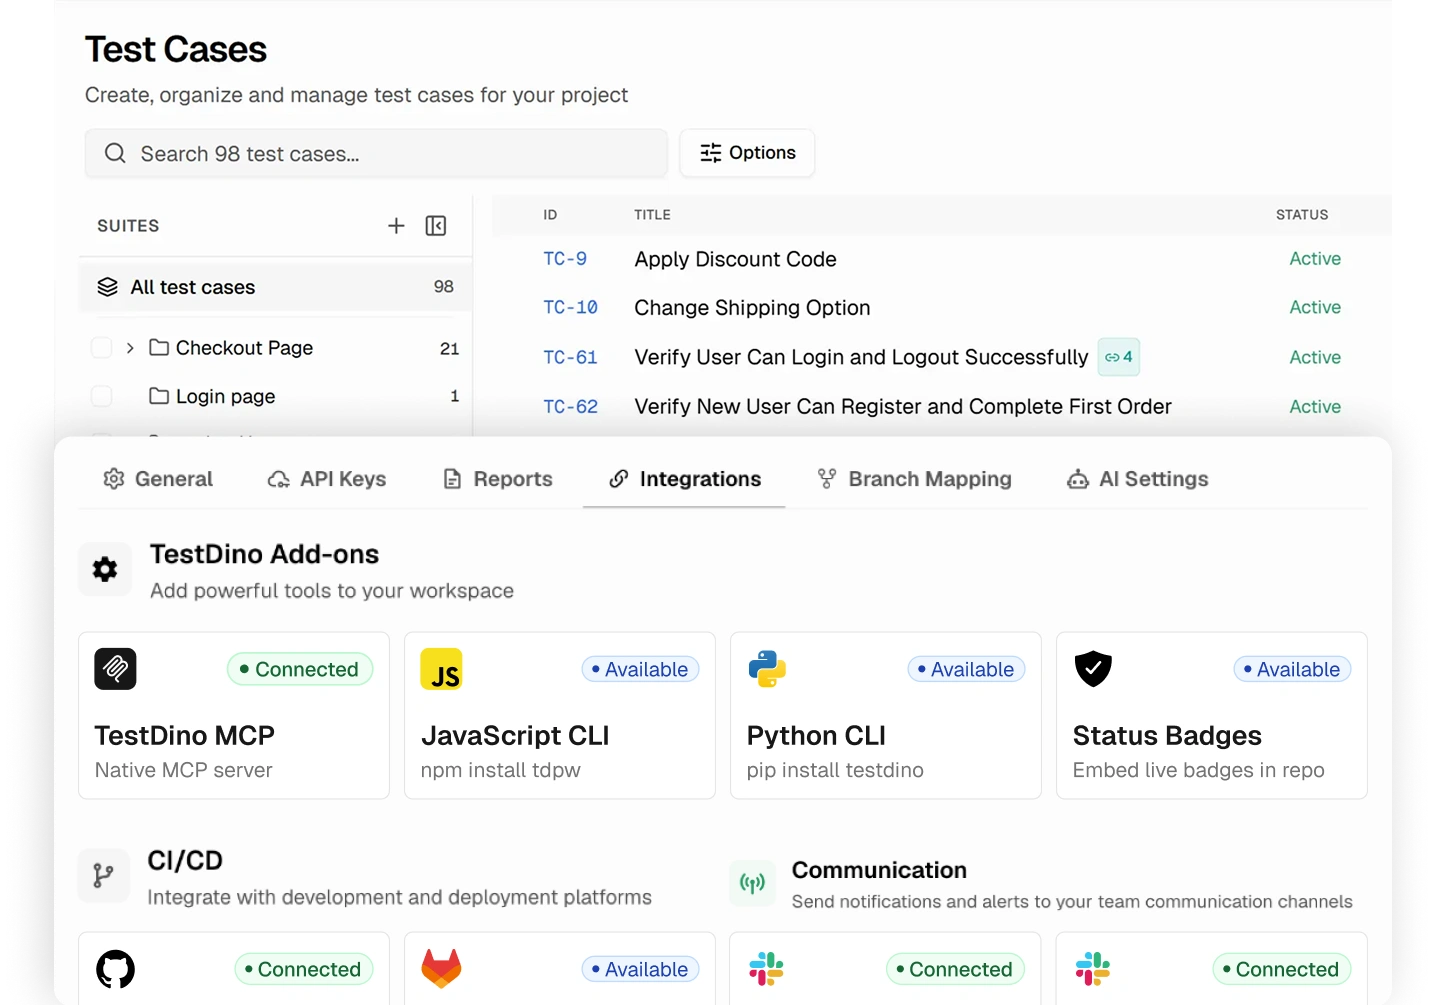
| Test case management (suites, ownership) | ||
| Bulk test creation (PRDs/Jira/stories) | via MCP | |
| Release tracking (releases/cycles/sprints) | ||
| Exploratory / manual sessions | ||
| Import / export test cases | JSON/CSV/ZIP | Export timing data via API only |
AI & Automation | ||
| Local MCP (IDE agents) | Cursor/Claude Code/Copilot | |
| Remote MCP (web AI) | ||
| AI test run summary on GitHub PRs | ||
| AI test suite audit (audit score + report) | ||
| AI failure classification | ||
Integrations & Collaboration | ||
| Bug tracking breadth | Jira, Linear, Asana, monday | No native integrations |
| Slack notifications (run summaries) | App + webhooks | |
Platform & Security | ||
| Public API & CLIs | REST API + CLI | REST API (export timing data) |
| Project-level AI controls | Per-feature toggles | |
| Compliance & certifications | ISO 27001, SOC 2 Type II, GDPR | Minimal data collection; no published certs |
Plans & Pricing | ||
| Plan tiers | Free · Pro $39 · Team $79 · Enterprise | Pro $10/committer · Enterprise: Custom |
| Free executions | 5,000/mo | 14-day trial (no free tier) |
| Support | Chat + Slack Connect + Priority email | Standard email (Pro) · Priority email + private Slack (Enterprise) |
| Start for Free | ||
Feature-by-feature breakdown showing how each tool handles the areas that matter most to testing teams.
Reporting is built around build-level visibility: a live view of running CI builds, test file trends across recent runs, and exported metrics via API for custom analysis. There are no dedicated dashboards for test health, pull request history, AI insights, or release tracking.
Failed tests can be retried locally via the CLI, and the dashboard tracks test file trends and build history to spot patterns over time. There's no built-in trace viewing, screenshots, video playback, or AI error grouping, so teams rely on external tools to investigate failures in depth.
AI-powered failure categorization, pattern analysis, and intelligent quality reports are not part of the workflow.
AI integrations are limited to CI workflows and don't provide an MCP Server or structured access to testing data. This leaves developers switching between multiple tools during debugging.
CI optimization focuses on intelligent test splitting and parallel execution to reduce build times. It doesn't provide branch-to-environment mapping, GitHub quality gates, smart rerun history, or release-aware analytics, so teams have less visibility into test quality across environments.
It doesn't include built-in test case management, release tracking, manual testing, or broad project management integrations, so teams typically rely on separate tools to manage test planning and collaboration.
Purpose-built capabilities that help Playwright teams ship faster and debug smarter.
Where each platform leads, and where it falls short.
Knapsack Pro is a CI optimization platform focused on intelligent test splitting, parallel execution, and faster build pipelines.
Intelligent Test Distribution
Splits tests across parallel CI runners using historical execution data to reduce pipeline time.
Parallel Test Execution
Balances workloads across available runners to improve CI efficiency.
CI Performance Focus
Built to shorten test execution time and improve resource utilization in CI pipelines.
TestDino is a Playwright-native AI test intelligence platform that classifies failures, groups errors by root cause, and opens test data to AI agents through MCP.
Flaky Test Detection
Detects flaky tests using retry history and cross-run pattern analysis, surfacing stability trends so teams can find, prioritize, and fix unreliable tests faster.
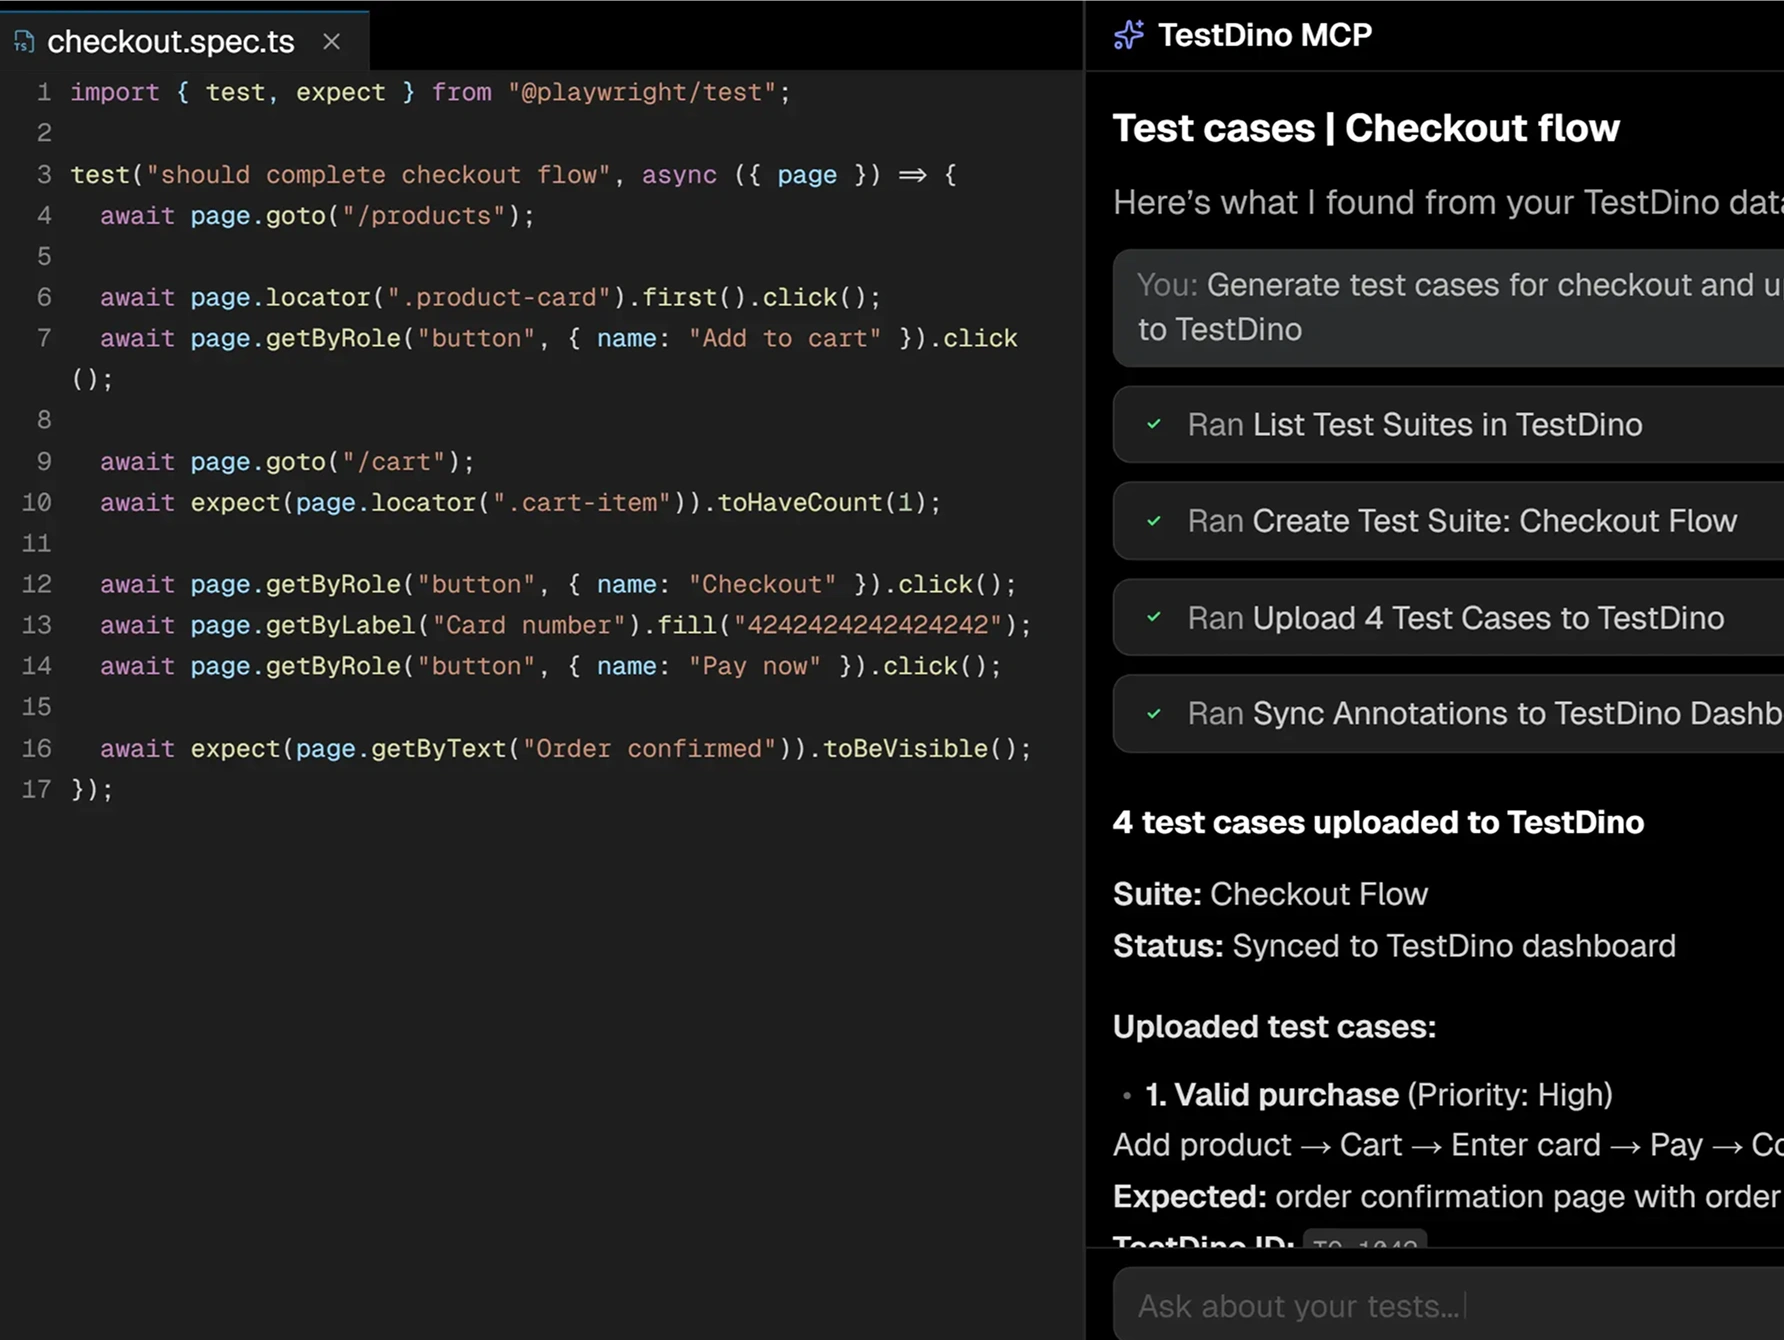
TestDino MCP Server
Lets AI coding agents query Playwright test runs, debug failures with full retry and artifact context, detect flaky tests, and manage manual test cases and suites, all from the editor.
Multi-Dimensional Error Grouping
Failures cluster by message, stack trace, and location together, so the same root cause lands in one bucket instead of three.
CI/CD Optimization Stack
Rerun failed tests only, GitHub quality gates that block merges on flaky thresholds, and environment mapping for branch-to-env trends.
Verified reviews from QA and engineering teams running Playwright in production.
Analyzing failed test runs in CI used to take a lot of time. TestDino gives me a centralized dashboard for Playwright results with screenshots, logs, and failure trends. The automatic grouping and categorization of failures means I triage from patterns instead of reading each CI log.
Lead Software Engineer
I monitor everything my tests do, from the full list of tests to detailed error screenshots. The GitHub integration is smooth, so commit hashes, CI runs, and HTML reports open straight from the dashboard. I use TestDino almost every day, and it has improved the quality of our automation code.
Lead QA Automation Engineer
TestDino shows us which tests are slowest, most flaky, and fail most often, which helps us prioritize improvements. We inherited an existing project, and it gave us the insights to take ownership of the suite and improve its reliability.
Senior QA Engineer
The interface is clean and easy to navigate, so getting started with test creation is straightforward. I like having both visual workflows and code-based options, and the dashboard makes it easy to review results and understand failures quickly.
QA Specialist
Support has been excellent, and the setup was straightforward. The interface is intuitive and gives a clear overview, and the pricing is competitive. The team is active, consistently shipping new features and improvements.
CTO & Co-Founder
TestDino is easy to use and delivers valuable analytics out of the box. The dashboard is clean and intuitive, and the initial setup was not difficult at all. I would rate it a nine for recommending it to colleagues.
Senior Quality Assurance Manager
Enterprise-grade security so your team can focus on shipping instead of worrying about data.
Secure authentication, role-based access control, and data encryption safeguard your test data in transit and at rest.
Persistent analytics with historical tracking deliver reliable insights about test performance, coverage, and release readiness.
Automated backups and retention policies maintain a complete history of test data. Project-scoped access prevents unauthorized changes.
Knapsack Pro uses per-committer pricing, while TestDino offers flat, predictable pricing with no usage-based overages.
For teams that need fast CI with intelligent test splitting and parallel execution.
CI test splitting and parallel execution
Dynamic workload balancing
Multi-framework support
Enterprise support options
For dev teams shipping to production. Flat pricing, no per-test overage.
25,000 test executions per month
Up to 3 users
90-day data retention
AI failure classification
TestDino MCP Server with read and write access
PR features and CI/CD optimization
Debugging features and trace viewer
Integrations with Jira, Linear, Asana, Slack
Stop wasting time on
untracked flaky tests
Knapsack Pro focuses on reducing CI execution time through intelligent test distribution. TestDino goes beyond CI optimization with AI failure analysis, PR insights, test management, flaky test detection, and MCP-powered AI workflows.
Side-by-side comparisons of features, pricing, and integrations to help you pick the right testing tool.