Compare Playwright HTML Report vs TestDino. See how TestDino adds a managed dashboard, inline traces, AI failure classification, and an MCP Server.
Playwright's built-in HTML Reporter generates a static, self-contained HTML folder every time your tests run. It renders test steps, attachments, and traces into a local page. When it comes to Playwright HTML Report vs TestDino, the difference lies in infrastructure. TestDino is a managed platform with a persistent history dashboard, no self-hosting required. It groups errors by root cause without manual triage, ships an embedded Playwright trace viewer inline on every failure, and ties each run to its PR with a dedicated Pull Request view.
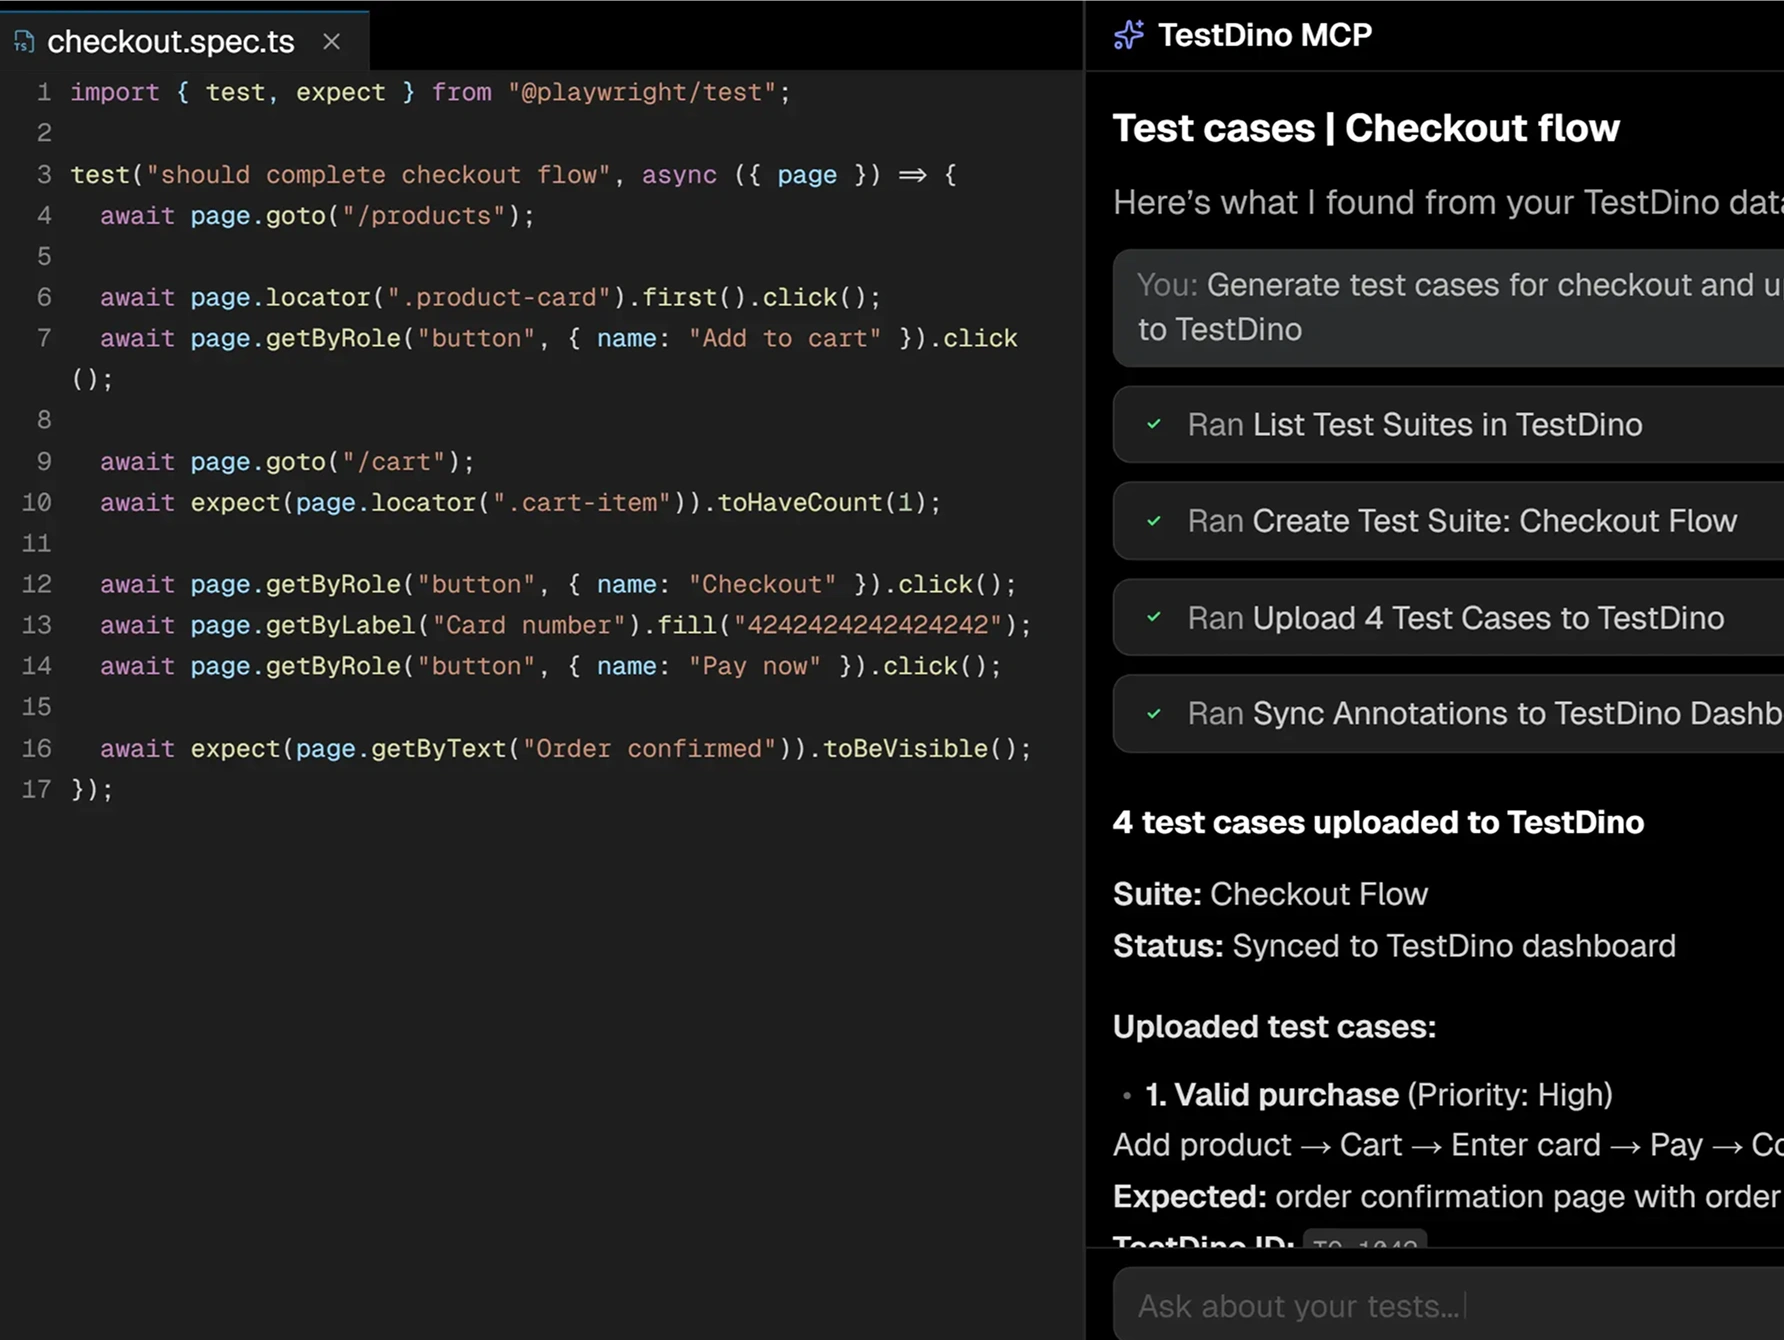
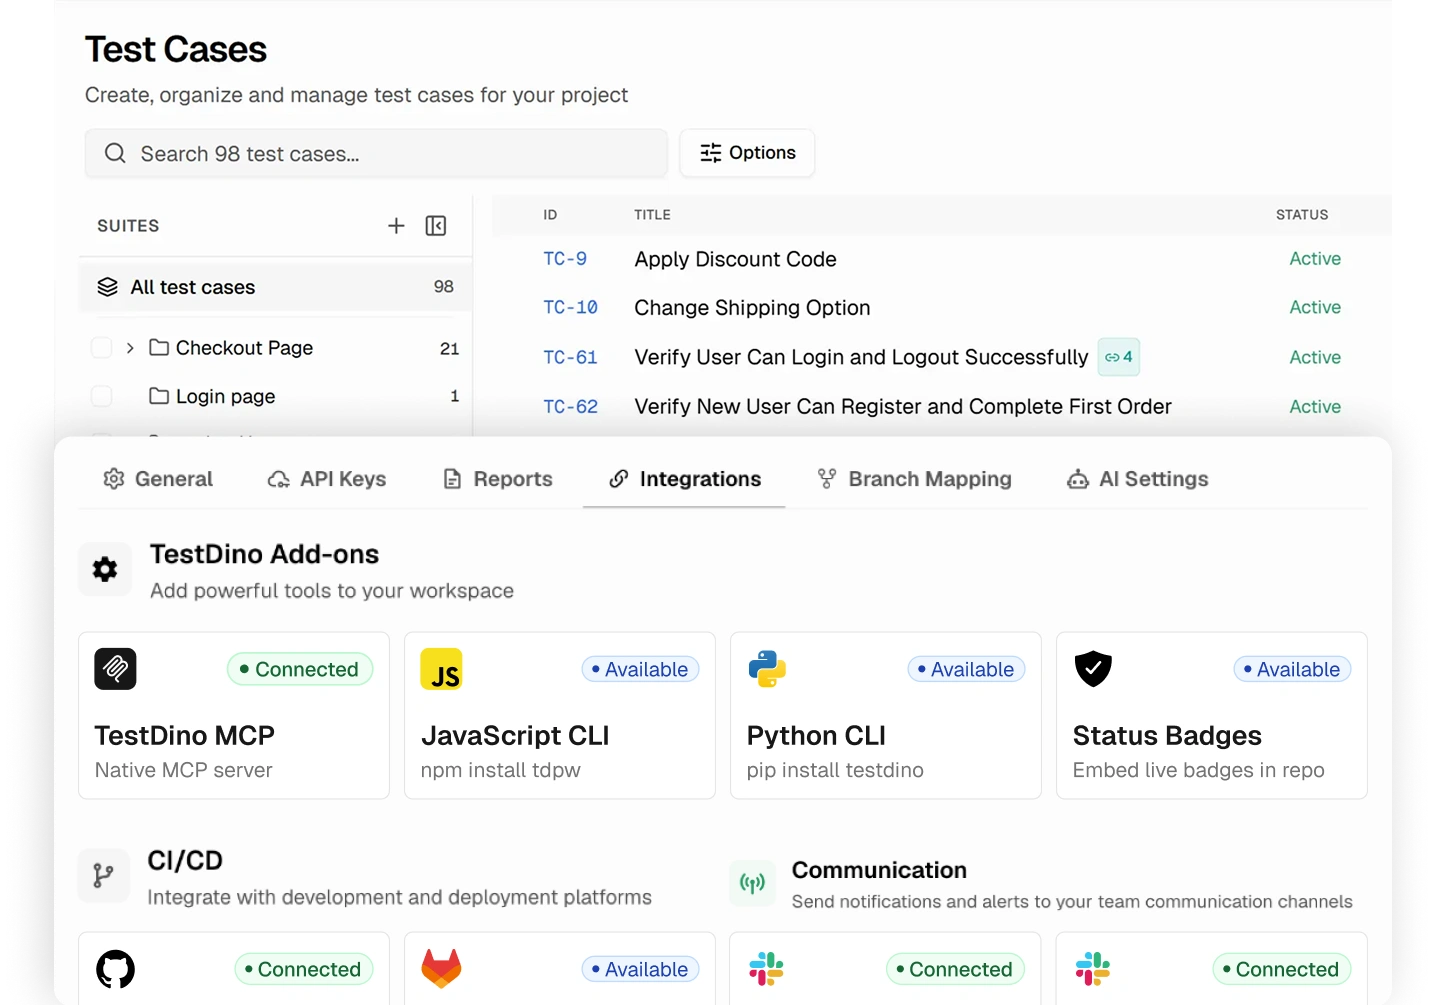
Reporting is just where TestDino starts. The platform also comes with built-in test management designed for how engineering works in 2026. Test cases live alongside their run history, manual runs and exploratory sessions roll up under date-bound releases, and the entire test record is queryable by Claude Code, Cursor, or any MCP-compatible agent, so your AI coding tools aren't debugging blind.
Playwright HTML Report vs TestDino starts with a fundamental gap: a static file you host yourself vs a managed platform. Here is where TestDino helps, and where Playwright HTML Report falls short.
Managed dashboard, no hosting required
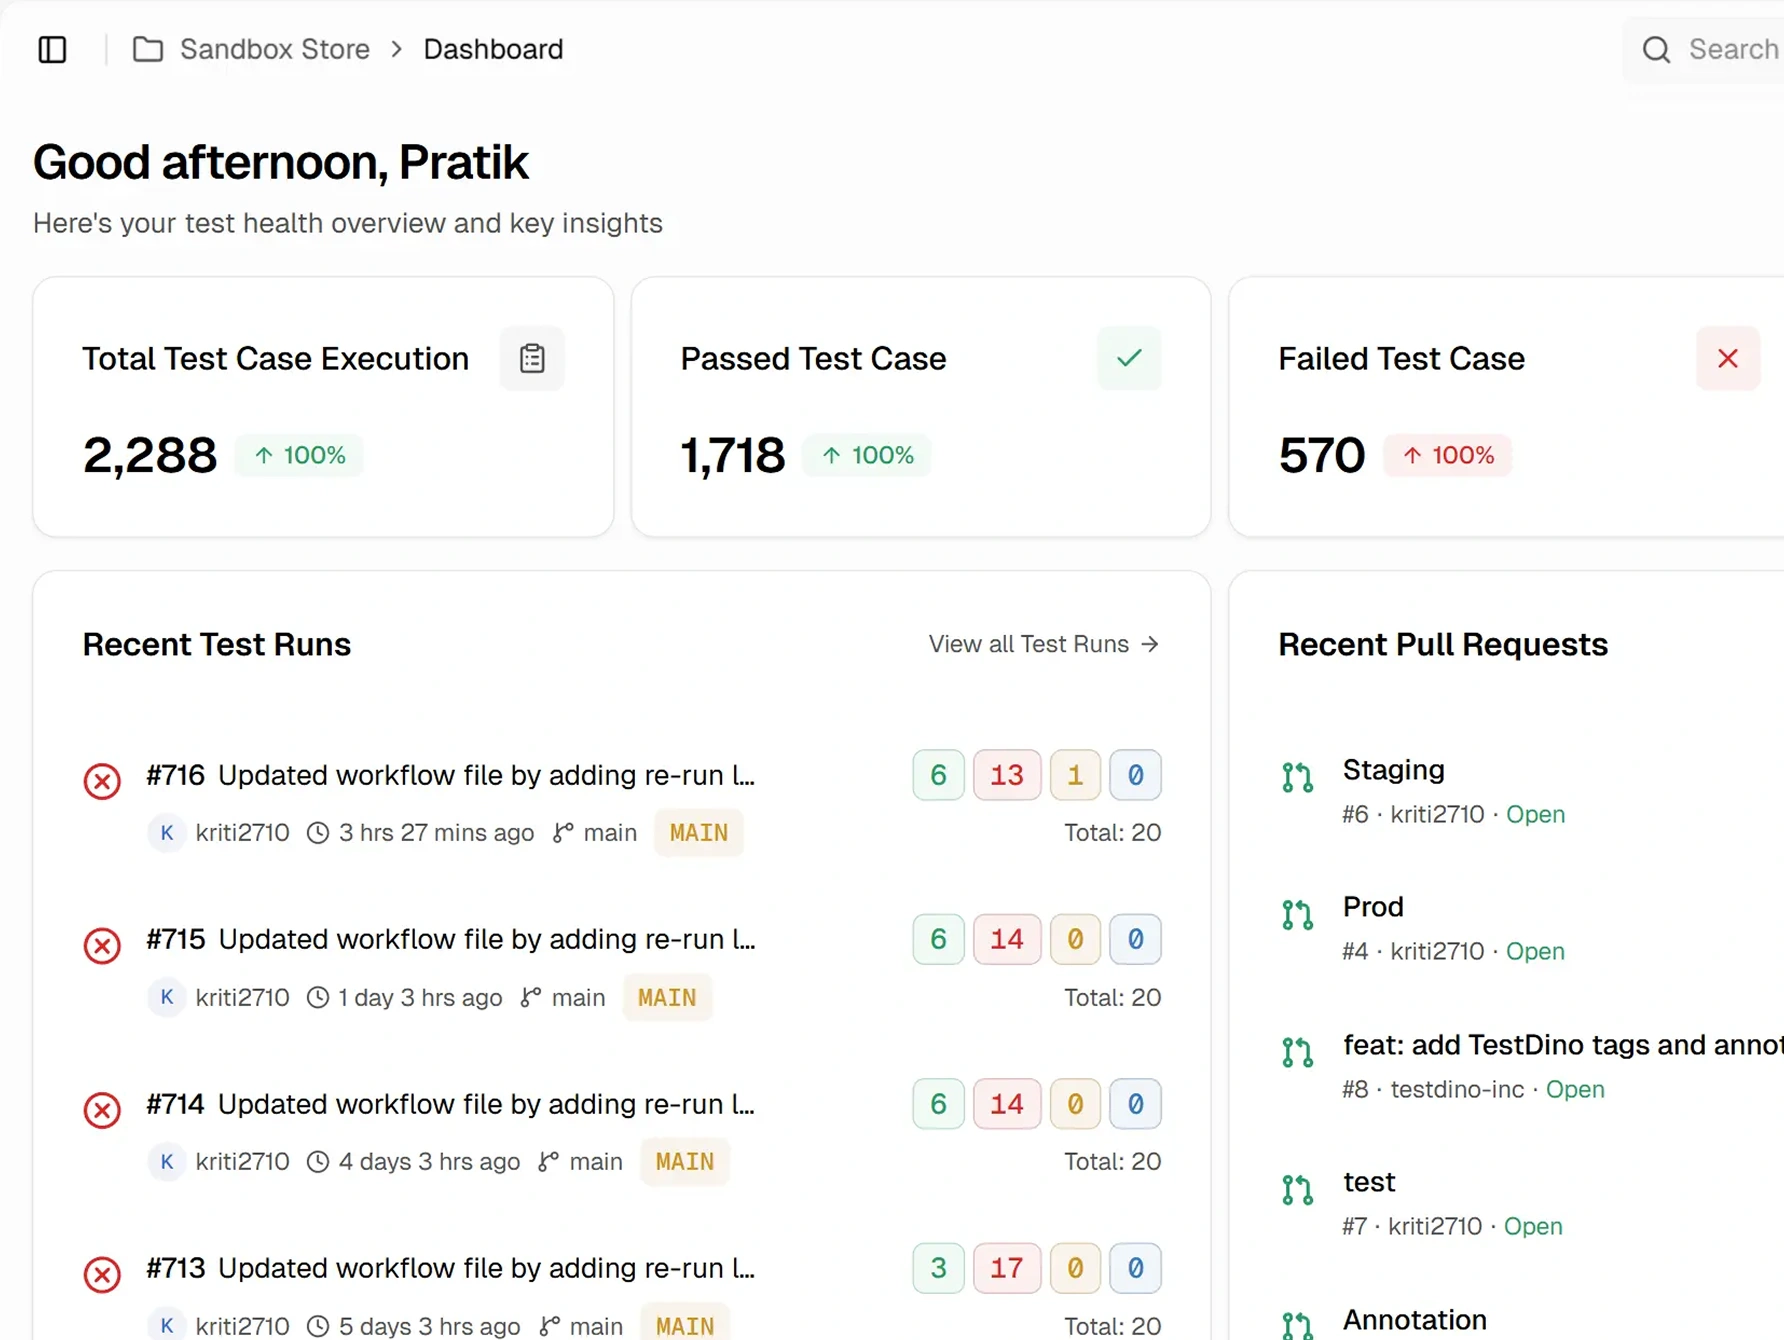
Setup takes one npm package and one environment variable. Test runs flow into a persistent dashboard that the team can access by URL, with history, analytics, and PR context retained across runs. No artifact server or GitHub Pages required.
Inline trace viewer, screenshots, and video
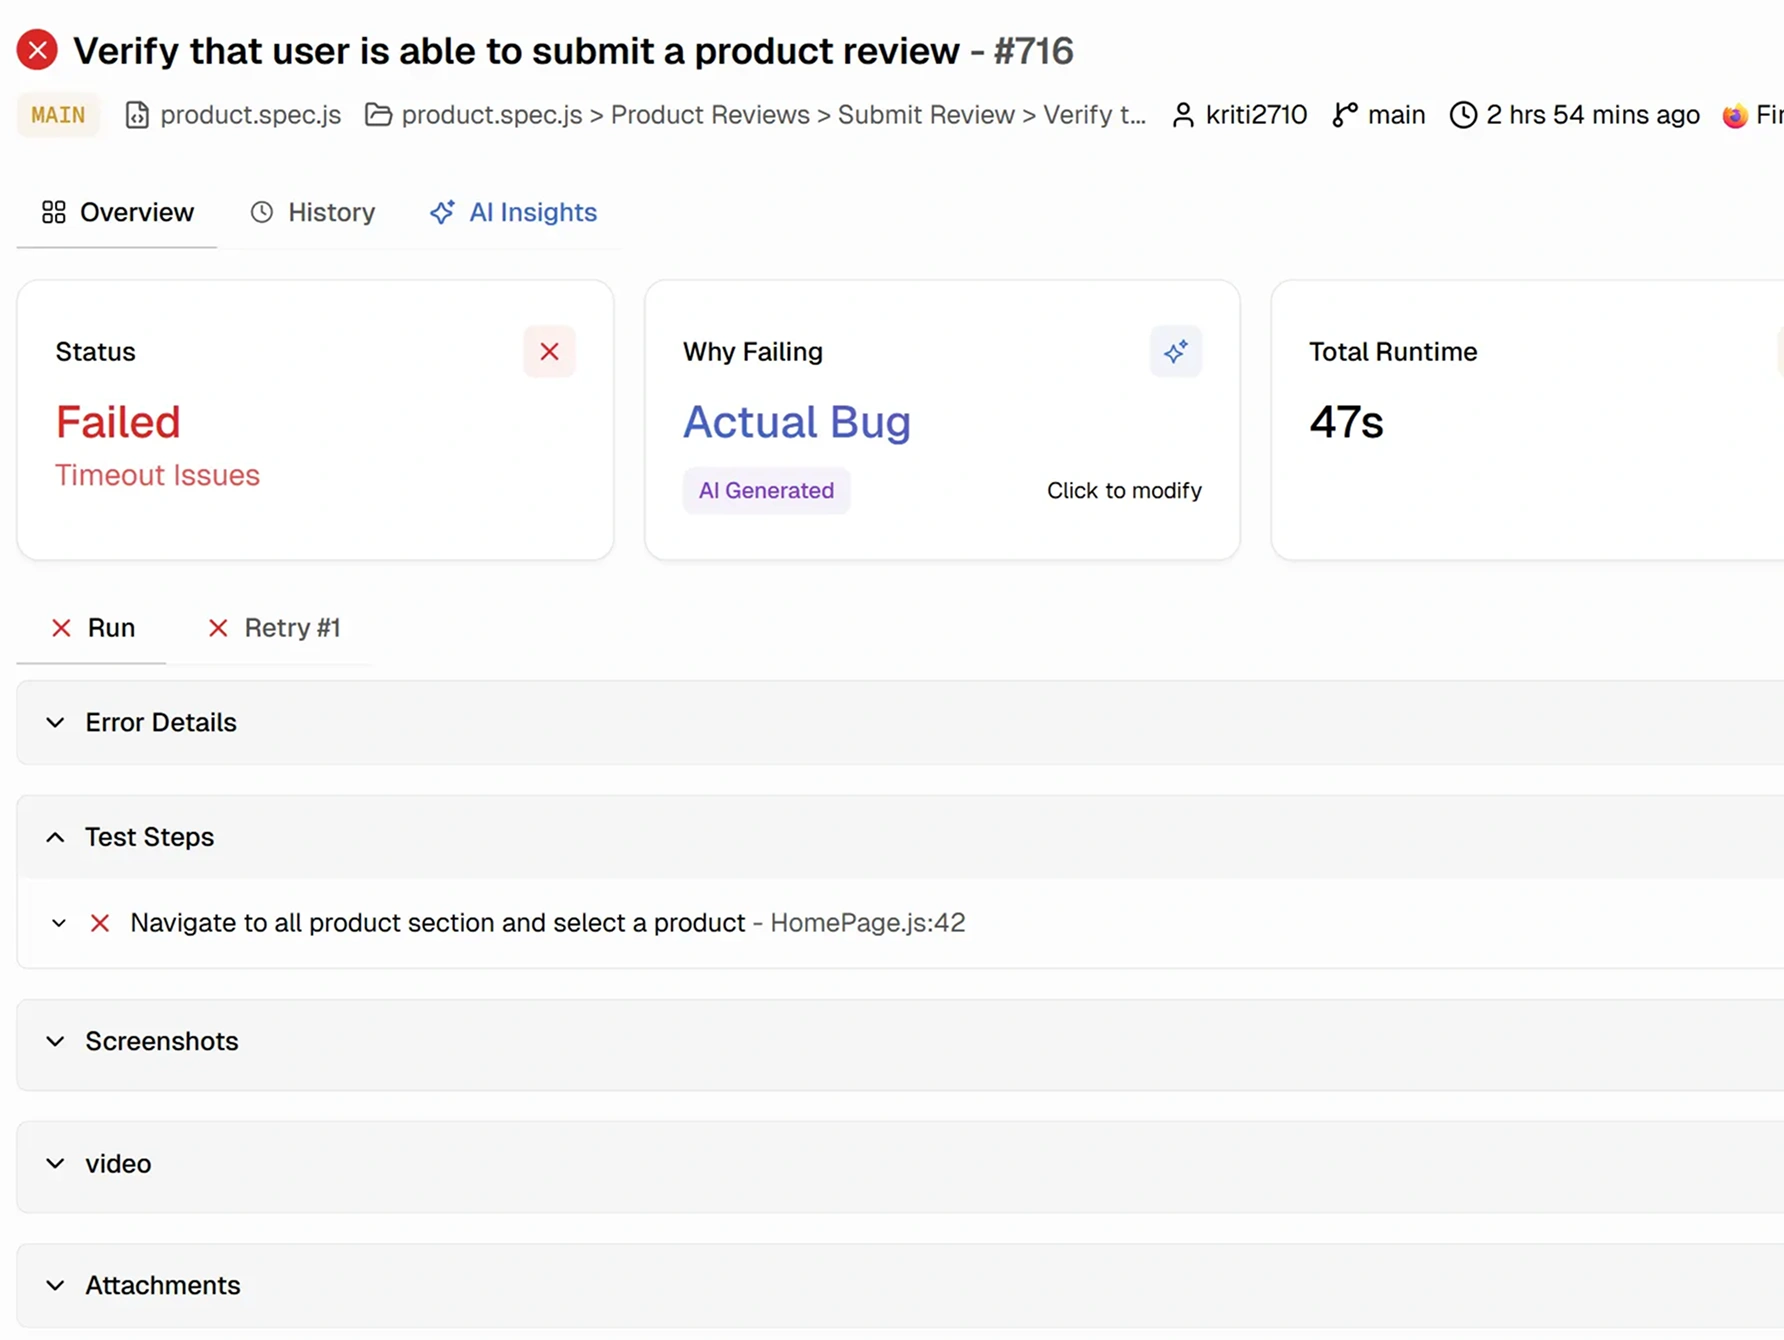
Every failed test opens with an embedded trace viewer showing DOM snapshots, network calls, and console logs, plus video playback and error groups by message, stack trace, and location. Failure context lives where the failure happens, not in downloaded trace .zip files.
MCP-native test access
The TestDino MCP Server gives Cursor, Claude Code, and Claude Desktop a direct line into Playwright runs. Coding agents debug failures with debug_testcase, list runs by branch or commit, and update manual cases from the IDE.
Analytics that persist across runs
The Analytics view tracks Test Run Volume, Flakiness, New Failures, and Retry Trends across the entire history, with Slowest Tests, Most Flaky Tests, and Speed Improvement metrics surfacing automatically without manually preserving a history folder.

Static HTML, no persistent dashboard
Playwright generates a self-contained HTML folder after each run. To view it, the folder needs to be downloaded or hosted somewhere accessible to the team, typically a CI artifact server. There is no central URL the team always visits, and old reports are overwritten unless manually archived.
No cross-run analytics or history
Each report is a point-in-time snapshot. Trend graphs, pass/fail rates over time, and performance regression tracking do not exist. Flaky detection exists only within a single run, when a test fails then passes on retry, but there is no cross-run flakiness tracking.
No AI failure intelligence
There is no automatic failure classification, no AI-generated summaries posted to GitHub commits or Slack, and no confidence scores. Every Playwright failure that lands in the HTML report still needs a developer to read the stack trace and decide what kind of problem it is.
No agent ecosystem or CI optimization
Playwright HTML Report has no MCP Server, so AI coding agents in Cursor, Claude Code, or Claude Desktop cannot query failures or pull trace context through agent workflows. There is also no selective rerun of only failed tests or merge-blocking quality gates.
| ||
|---|---|---|
| Pricing (starts at) | $39/month (billed annually) | Free (Open Source) |
| Best for | Playwright test intelligence & management | Static HTML reporting |
| Playwright integration | Native (trace viewer, error grouping, MCP) | Via reporters |
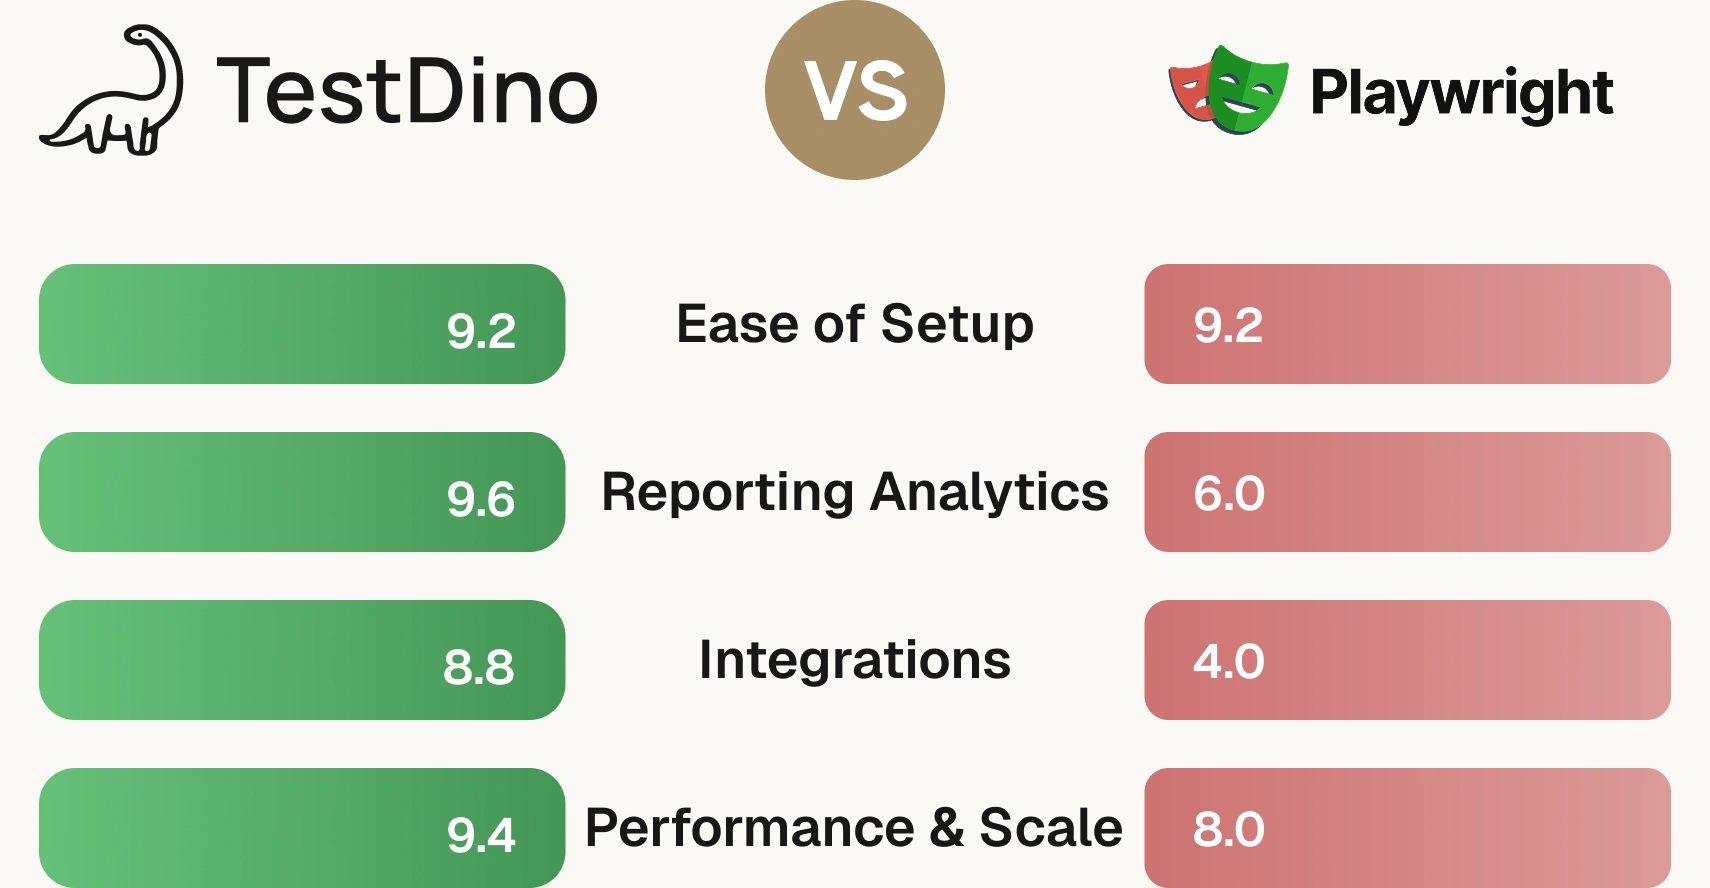
| Ease of use |  |  |
| One-step CI setup | ||
DASHBOARDS & REPORTING | ||
| Unified Playwright dashboard | Static HTML per run | |
| Multi-tab test run detail | Summary, History, AI Insights & more | Basic HTML views |
| Pull request insights | ||
| Test ExplorerBrowse tests as a hierarchy, a flat list, or by tag. | Flat list or basic tree | |
| Real-time streaming | Per-shard/worker | |
| Scheduled PDF reports | Daily/Weekly/Monthly | |
TEST ANALYTICS | ||
| Analytics: trends & patterns | Test runs, test cases & more | Trend graphs only |
| Code coverage, per-file | Istanbul, run-level | |
| Environment analytics | Pass-rate/flaky by env | environment.properties file |
DEBUGGING & EVIDENCE | ||
| Built-in Playwright trace viewer | ||
| Screenshots & video replay | Embedded | As attachments |
| Console logs (per test) | Node + browser | Via attachment |
| Visual diff comparison | ||
| Smart error grouping | Message/stack/location | Categories.json rules |
| Flaky detection | Via retry flags | |
| Playwright Tags and AnnotationsAttach priority, owner, links, and metrics to tests. | Basic tags | |
CI/CD OPTIMIZATION | ||
| Rerun only failed tests | ||
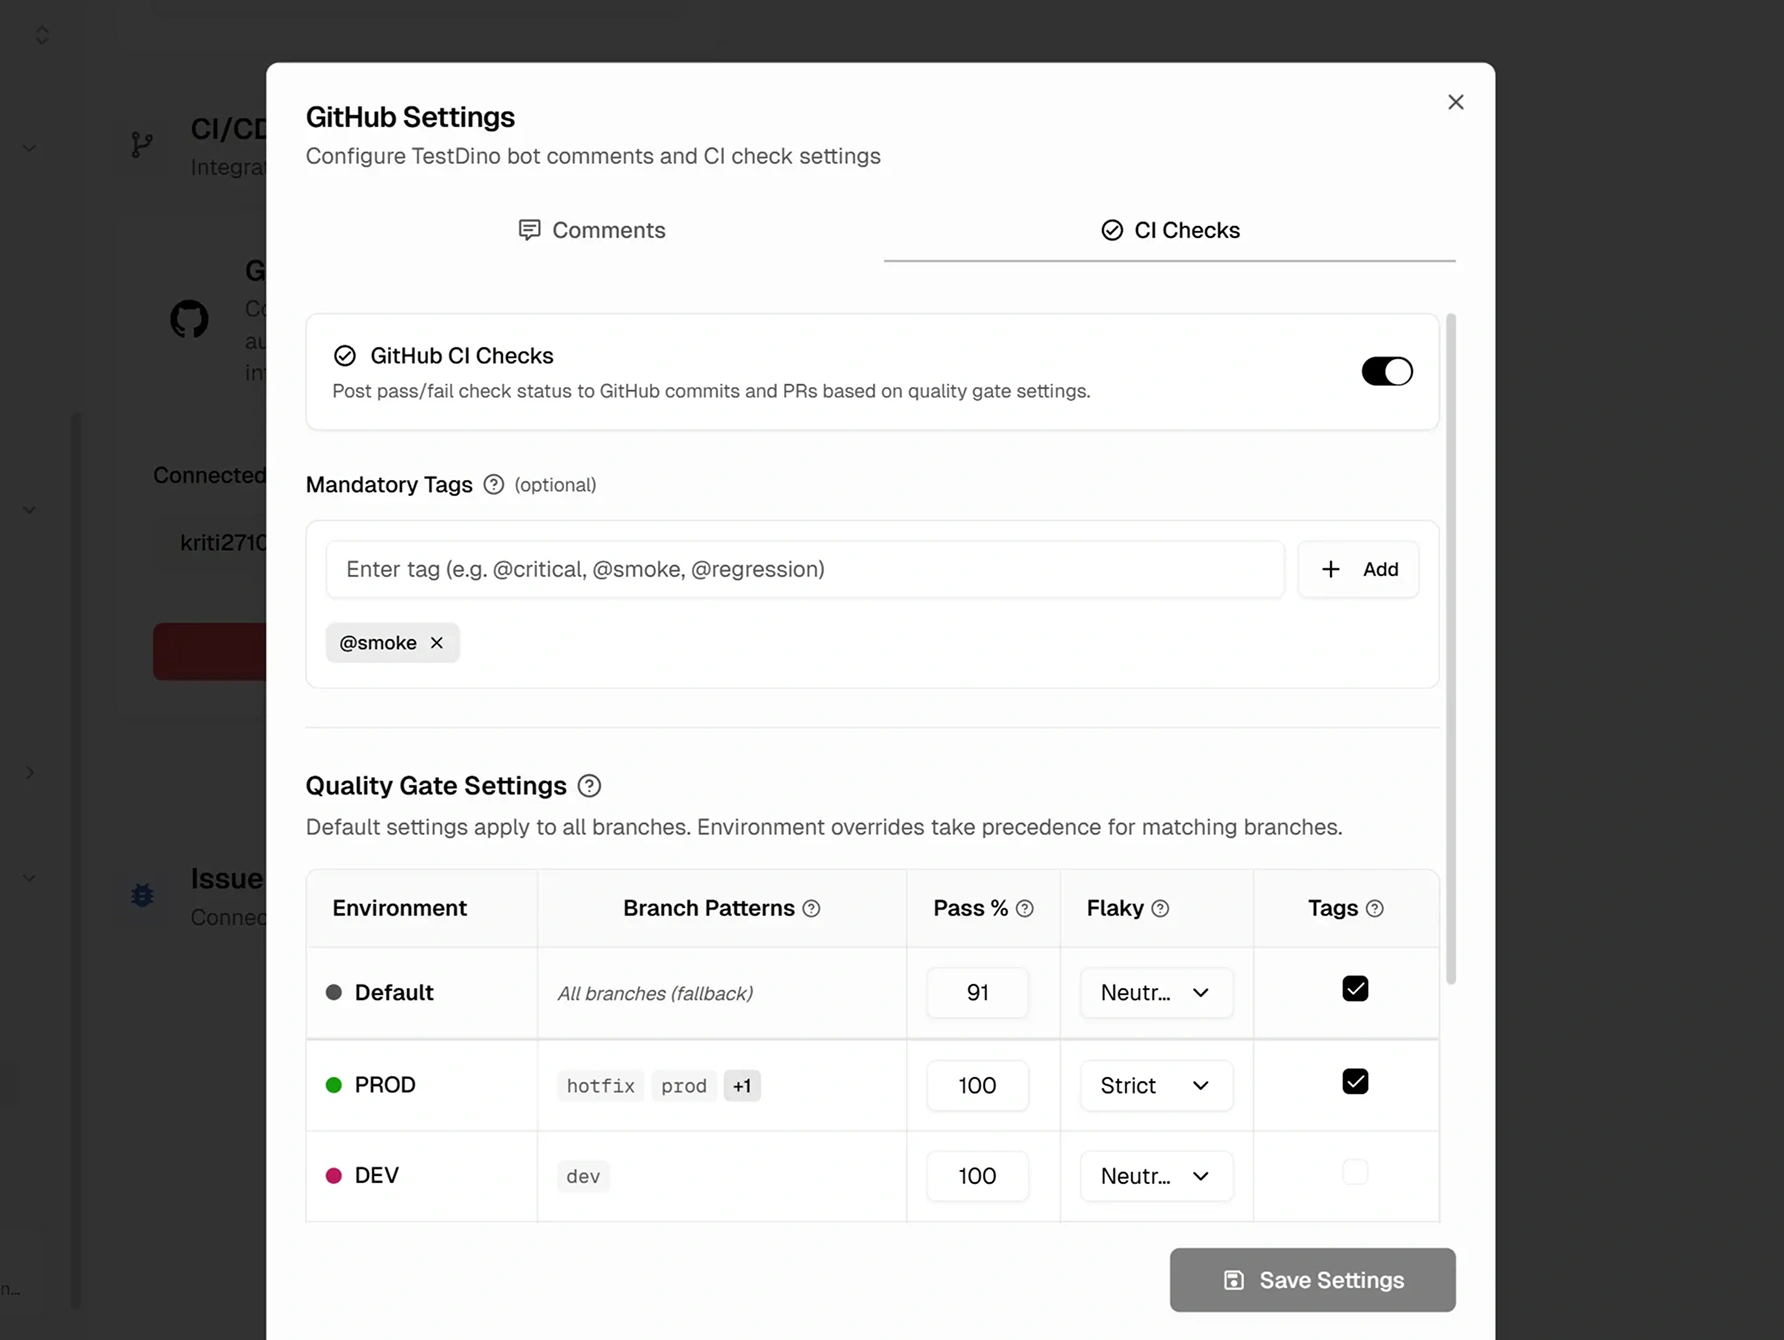
| GitHub CI Checks quality gates | Per-env + mandatory tags | |
| Branch → environment mapping | Exact/regex | |
| Smart rerun history | ||
| Sharded / parallel run support | Per-shard live view | Manual merge required |
| Native CI breadth | GitHub, GitLab, Azure DevOps, TeamCity, Bitbucket, CircleCI, Jenkins | Framework agnostic |
| Self-managed GitLab | ||
TEST MANAGEMENT | ||
| Test case management (suites, ownership) | ||
| Bulk test creation (PRDs/Jira/stories) | via MCP | |
| Release tracking (releases/cycles/sprints) | ||
| Exploratory/manual sessions | ||
| Import/export test cases | JSON/CSV/ZIP | |
AI & AUTOMATION | ||
| Local MCP (IDE agents) | Cursor/Claude Code/Copilot | |
| Remote MCP (web AI) | ||
| AI test run summary on GitHub PRs | ||
| AI test suite audit (audit score + report) | ||
| AI failure classification | ||
INTEGRATIONS & COLLABORATION | ||
| Bug tracking breadth | Jira, Linear, Asana, monday | Jira (link via annotations) |
| Slack notifications (run summaries) | App + webhooks | |
PLATFORM & SECURITY | ||
| Public API & CLIs | REST API + CLI | CLI only |
| Project-level AI controls | Per-feature toggles | |
| Compliance & certifications | ISO 27001, SOC 2 Type II, GDPR | N/A (OSS) |
PLANS & PRICING | ||
| Plan tiers | Free · Pro · Team · Enterprise | Free (OSS) |
| Free executions | 5,000/mo | Unlimited (self-hosted) |
| Support | Chat + Slack Connect + Priority email | Community (GitHub, Slack) |
| Start for Free | Visit Playwright | |
Feature-by-feature breakdown showing how each tool handles the areas that matter most to testing teams.
Playwright generates a static HTML folder per run with a summary page showing passed, failed, flaky, and skipped counts. There is no persistent managed dashboard, no PR view tied to commits and files changed, and no scheduled PDF exports. Each report is an independent snapshot.
Failed tests show error messages with stack traces. Screenshots, videos, and trace files attach to the bottom of the test. Clicking a trace file opens the Playwright Trace Viewer, a powerful tool, but it opens as a separate application, not inline. There is no error grouping across tests.
There is no AI in Playwright's HTML Reporter. Flaky tests are detected within a single run when a test fails and passes on retry, but there is no failure categorization, no pattern analysis, and no cross-run flakiness detection.
debug_testcase, and rank flaky tests through list_testcase from the IDE.There is no MCP Server in Playwright HTML Report. The static HTML output is meant for human consumption rather than programmatic agent access.
Playwright's shard merging via the blob reporter is excellent, but selective rerun of failed tests from previous runs, GitHub status checks that block merges, and branch-regex environment mapping aren't built into the HTML report workflow.
Test management isn't part of Playwright's HTML Report. There is no built-in integration for Jira or Slack.
Purpose-built capabilities that help Playwright teams ship faster and debug smarter.
Where each platform leads, and where it falls short.
Playwright's built-in HTML Reporter is a free, zero-dependency report that ships with every Playwright installation.
Free and Built-In
Ships with @playwright/test. No extra packages or accounts needed.
Powerful Trace Viewer
Full DOM snapshots, network waterfall, and console logs. Excellent for debugging.
Flexible Configuration
Supports multiple reporters, custom attachments, and environment overrides.
TestDino is a Playwright-native AI test intelligence platform that brings inline trace viewing, AI classification, and failure analytics into one focused reporter.
AI-Powered Failure Classification
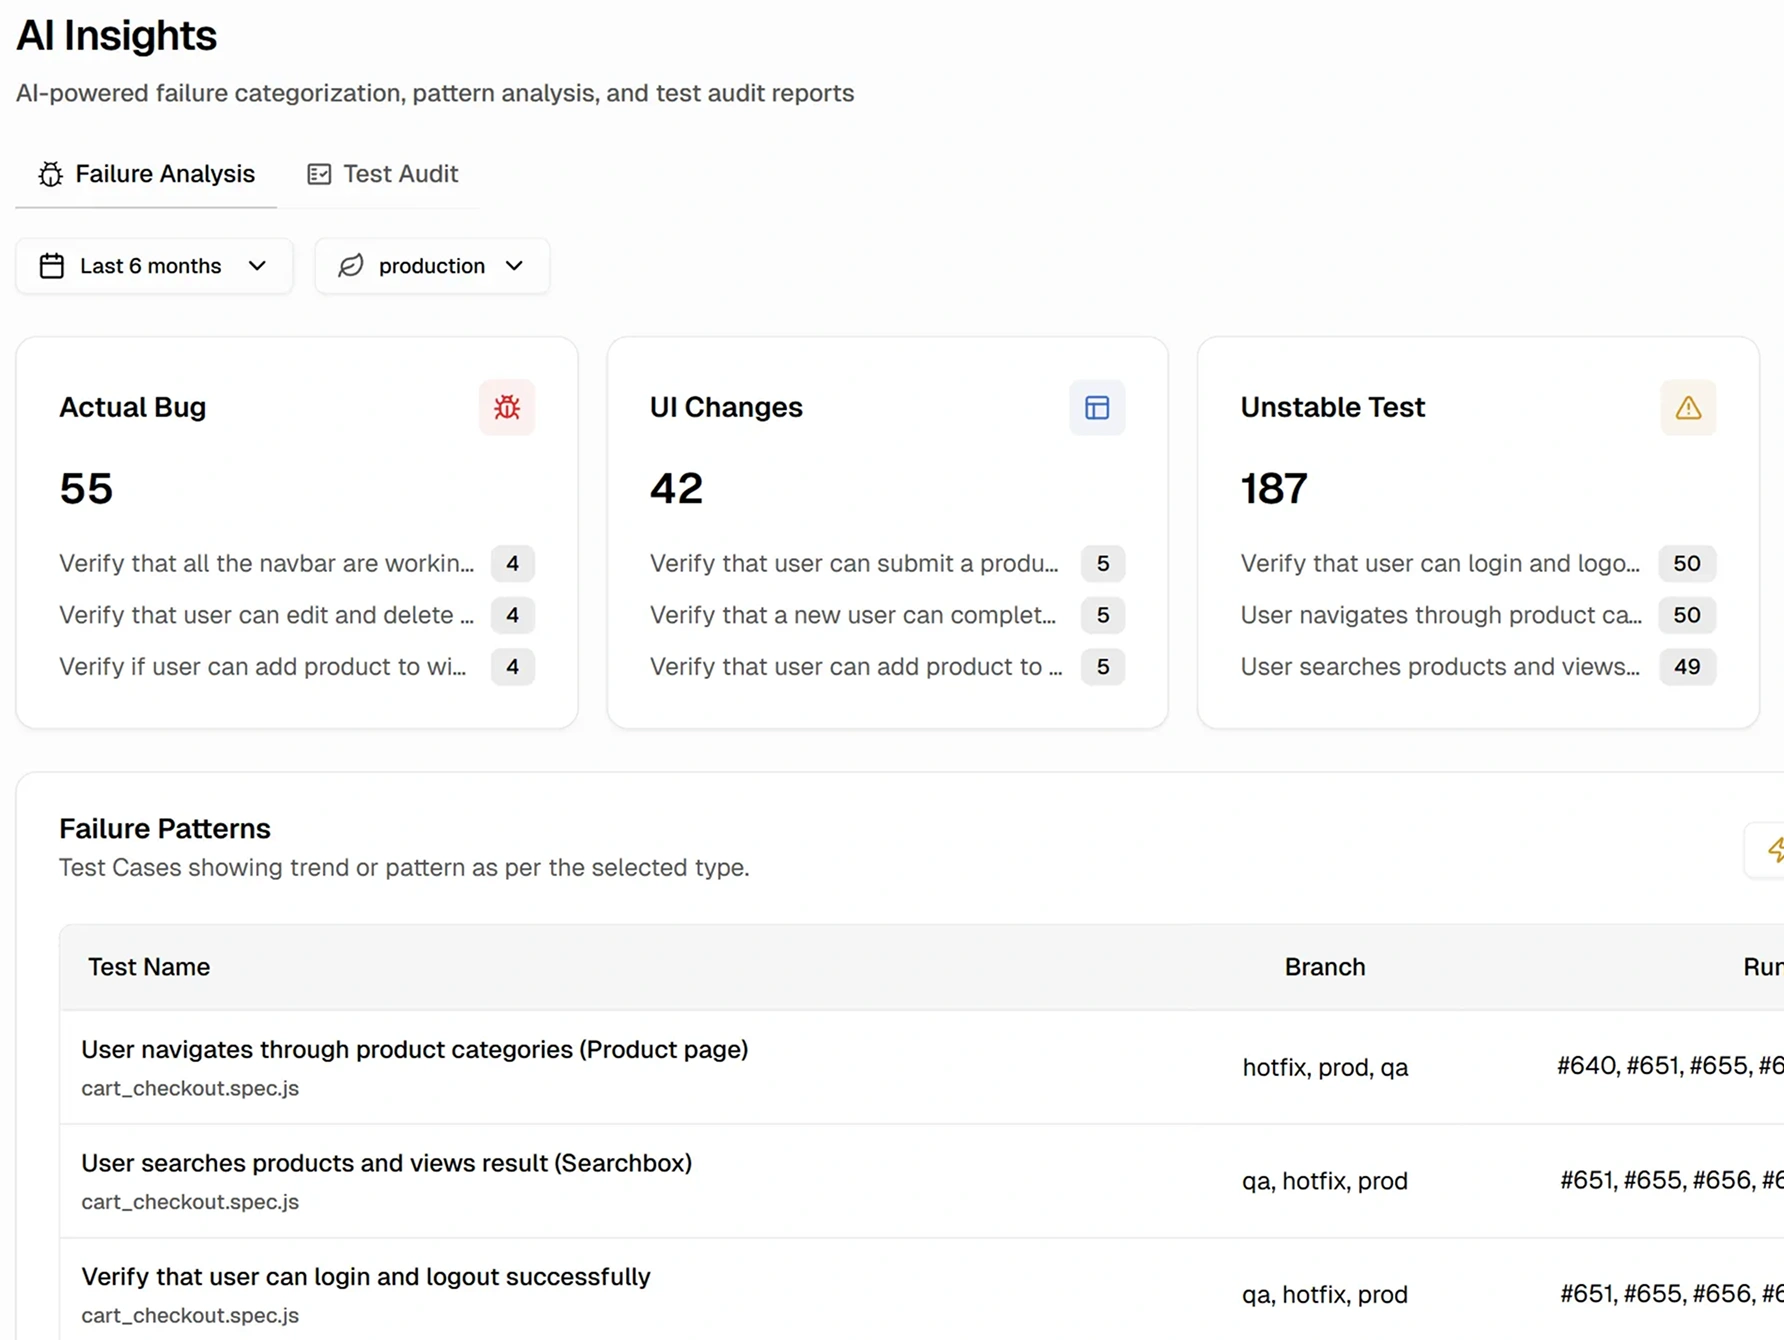
Every failure is tagged as Bug, UI Change, Unstable, or Miscellaneous. Triage starts at the top of a prioritized list, not the middle of a log.
Inline Playwright Debugging
Trace viewer, screenshots, video, and console logs all open inline on the failed test. No artifact attachments, no local trace viewer launches.
Cross-Run Flakiness Detection
Retry analysis plus pattern detection across run history. Flakes get caught even when CI retries aren't enabled.
TestDino MCP Server
It lets AI coding agents query Playwright test runs, debug failures with full retry and artifact context, detect flaky tests, and manage manual test cases and suites, all from the editor.
Verified reviews from QA and engineering teams running Playwright in production.
Analyzing failed test runs in CI used to take a lot of time. TestDino gives me a centralized dashboard for Playwright results with screenshots, logs, and failure trends. The automatic grouping and categorization of failures means I triage from patterns instead of reading each CI log.
Lead Software Engineer
I monitor everything my tests do, from the full list of tests to detailed error screenshots. The GitHub integration is smooth, so commit hashes, CI runs, and HTML reports open straight from the dashboard. I use TestDino almost every day, and it has improved the quality of our automation code.
Lead QA Automation Engineer
TestDino shows us which tests are slowest, most flaky, and fail most often, which helps us prioritize improvements. We inherited an existing project, and it gave us the insights to take ownership of the suite and improve its reliability.
Senior QA Engineer
The interface is clean and easy to navigate, so getting started with test creation is straightforward. I like having both visual workflows and code-based options, and the dashboard makes it easy to review results and understand failures quickly.
QA Specialist
Support has been excellent, and the setup was straightforward. The interface is intuitive and gives a clear overview, and the pricing is competitive. The team is active, consistently shipping new features and improvements.
CTO & Co-Founder
TestDino is easy to use and delivers valuable analytics out of the box. The dashboard is clean and intuitive, and the initial setup was not difficult at all. I would rate it a nine for recommending it to colleagues.
Senior Quality Assurance Manager
Enterprise-grade security so your team can focus on shipping instead of worrying about data.
Secure authentication, role-based access control, and data encryption safeguard your test data in transit and at rest.
Persistent analytics with historical tracking deliver reliable insights about test performance, coverage, and release readiness.
Automated backups and retention policies maintain a complete history of test data. Project-scoped access prevents unauthorized changes.
Playwright HTML Report is free and built-in, with the team responsible for hosting and artifact management. TestDino offers flat monthly pricing with a managed dashboard, AI, and MCP included.
No cost. Ships with Playwright. The HTML reporter is free to use. Teams handle their own hosting, history preservation, CI integration, and any team collaboration setup.
Built-in to Playwright
Static HTML reports per run
Interactive filtering (status, tags, projects)
Trace viewer (opens separately)
Screenshots, video, traces as attachments
Hosting required for team access
History preservation requires CI configuration
For dev teams shipping to production. Flat pricing with managed dashboard, AI, and MCP included.
25,000 test executions per month
Up to 3 users
90-day data retention
AI failure classification with confidence scores
MCP Server with test case writes
Embedded trace viewer and debugging features
PR view and CI/CD optimization
Integrations with Jira, Linear, Asana, Slack
Stop wasting time on
static HTML files
No. Playwright's HTML Reporter generates a self-contained HTML folder per test run. Each run produces a new report, and old reports are overwritten unless manually archived. To share results, teams upload the folder as a CI artifact. TestDino replaces this with a managed dashboard where every run is stored, searchable, and accessible through a permanent link.
Side-by-side comparisons of features, pricing, and integrations to help you pick the right testing tool.