Develocity helps engineering teams improve build performance and CI reliability with build scans, test analytics, caching, and pipeline insights. It's a strong choice for organizations using Gradle, Maven, or Bazel to optimize developer productivity.
But the platform has limitations. Develocity focuses on build analytics rather than complete test management. It doesn't offer centralized test case management, AI-powered failure analysis, Playwright trace viewing, or structured QA workflows.
There's also an AI workflow gap. Develocity has no MCP server for AI assistants, while the TestDino MCP Server lets AI tools access test runs, investigate failures, and identify flaky tests directly from your workspace.
Teams using Playwright in CI often need more than build insights: they need AI-powered test management, failure analysis, and flaky test detection. Here are the 6 best Develocity alternatives to consider in 2026, starting with TestDino.
Best Develocity Alternatives: How to Choose the Right Tool
We evaluated each tool based on test case management depth, automated test reporting, AI failure analysis, flaky test detection, Playwright support, CI/CD integration, and pricing transparency. We also looked at reporting depth and collaboration features to help CTOs, engineering managers, QA leads, and DevOps managers make smarter decisions about test automation.
How to Compare Develocity Alternatives
Here is a quick comparison of top alternatives to Develocity to help you identify your preferred test management tool:
 TestDino |  Develocity |  BuildPulse |  CircleCI |  Trunk | |
|---|---|---|---|---|---|
| Pricing (starts at)Lowest paid plan, per the listed billing terms. | $39/month (billed annually) | Custom quote | $99/month | $15/month | Free up to 5 committers |
| Best for | Playwright test intelligence & management | Build performance & CI optimization | Flaky test detection & CI insights | CI/CD automation & pipeline management | Developer productivity & CI optimization |
| Playwright integration | Native (trace viewer, error grouping, MCP) | Via CI/build | Via reporter | Native via Playwright Orb/CLI | Official reporter |
| One-step CI setup | One reporter line, streams live | Plugin config | Reporter + API key | Config through orb | CLI + configuration |
Dashboards & Reporting | |||||
| Unified Playwright dashboard | |||||
| Multi-tab test run detail | Summary, History, AI Insights & more | Build Scan pages | Test history & failure | Job & workflow | CI run details |
| Pull request insightsSee test results and history for each pull request. | |||||
| Test ExplorerBrowse tests as a hierarchy, a flat list, or by tag. | |||||
| Real-time streaming | Per-shard/worker | ||||
| Scheduled PDF reportsGet report PDFs emailed on a set schedule. | Daily/Weekly/Monthly | ||||
Test Analytics | |||||
| Analytics: trends & patterns | |||||
| Code coverage, per-file | Istanbul, run-level | Coverage integration | Via third-party | ||
| Environment analytics | Pass-rate/flaky by env | Environment-level insights | |||
Debugging & Evidence | |||||
| Built-in Playwright trace viewer | |||||
| Screenshots & video replay | Embedded | Attachments only | Links to CI artifacts | Via job artifacts | Via CI artifacts |
| Console logs (per test) | Node + browser | Test & build logs | Test failure logs | CI logs | |
| Visual diff comparison | |||||
| Smart error grouping | Message/stack/location | Failure grouping in Build Scans | Failure categorization | Similar failure grouping | |
| Flaky detectionSpot tests that pass and fail inconsistently, with a stability score. | Basic insights | ||||
| Playwright tags & annotations | Priority/owner/links/metrics | Reporter-based metadata | Limited via reporter | ||
CI/CD Optimization | |||||
| GitHub CI Checks quality gates | Per-env + mandatory tags | GitHub integration | |||
| Branch → environment mappingMatch each Git branch to the environment it runs against. | Exact/regex | Via pipeline parameters | Via branch rules | ||
| Sharded / parallel run support | Per-shard live view | Supports merged results | |||
| Native CI breadth | GitHub, GitLab, Azure DevOps, TeamCity, Bitbucket, CircleCI, Jenkins | Major CI providers | GitHub Actions, GitLab CI, CircleCI, Jenkins | GitHub Actions, GitLab CI, Bitbucket, Azure DevOps | GitHub Actions, GitLab CI, Jenkins, Bitbucket, Azure Pipelines |
| Self-managed GitLab | |||||
Test Management | |||||
| Test case management (suites, ownership) | |||||
| Bulk test creationGenerate many test cases at once from PRDs, Jira, or user stories. | via MCP | ||||
| Release trackingGroup test results by release, cycle, or sprint. | |||||
| Exploratory / manual sessions | |||||
| Import / export test cases | JSON/CSV/ZIP | ||||
AI & Automation | |||||
| Local MCPLet AI coding assistants in your editor act on test data directly. | Cursor/Claude Code/Copilot | ||||
| Remote MCPLet web-based AI tools query your test data. | |||||
| AI test run summary on GitHub PRs | AI code review only | ||||
| AI test suite auditAI scores your test suite and gives a downloadable report. | |||||
| AI failure classification | AI-assisted code analysis | ||||
Integrations & Collaboration | |||||
| Bug tracking breadth | Jira, Linear, Asana, monday | Jira, GitHub & IDE | GitHub Issues, Jira | Jira, GitHub, GitLab, Slack | GitHub, GitLab, Jira |
| Slack notifications | App + webhooks | Slack Orb & webhooks | |||
Platform & Security | |||||
| Public API & CLIs | REST + @testdino/playwright | REST API | REST API | REST API + CLI | CLI & API |
| Project-level AI controls | Per-feature toggles | Limited AI settings | |||
| Compliance & certifications | ISO 27001, SOC 2 Type II, GDPR | SOC 2, ISO 27001, GDPR | SOC 2, GDPR | SOC 2 Type II, GDPR, ISO 27001 | SOC 2 Type II, GDPR |
Plans & Pricing | |||||
| Plan tiers | Free · Pro $39 · Team $79 · Enterprise | Free · Enterprise (Custom) | Free Trial · Startup $99 · Enterprise | Cloud $39/user · Server · Enterprise | Free · Pro · Enterprise (Custom) |
| Free executions | 5,000/mo | Free tier (limited) | 14-day free trial | Free plan | Free plan |
| Support | Chat + Slack Connect + Priority email | Community, Email, Enterprise | Email, Priority (Enterprise) | Community, Email, Premium | Email, Slack (Enterprise) |
| Try for free | Learn more | Learn more | Learn more | Learn more | |
Best Develocity Competitors for Modern Test Reporting
Here are the 6 best alternatives to Develocity for teams that want more from their test management platform:
1. TestDino
Best for:
Playwright-first teams that need test management and automated test reporting in one platform, without per-user pricing eating into their budget.
Platform Type:
Test management, reporting, dashboards, and CI observability platform for Playwright.
Integrations with:
GitHub Actions, GitLab CI, Azure DevOps, TeamCity, Jira, Linear, Asana, monday, Slack.
Key Features:
 Test case management with suites up to 6 levels deep, ownership, and custom fields
- AI failure classification into 4 categories (Actual Bug, UI Change, Unstable Test, Miscellaneous)
- Built-in Playwright trace viewer with DOM snapshots and network logs
- Error grouping by message and stack trace
- GitHub CI Checks as merge quality gates
- MCP Server for AI agent queries from your IDE
- Flaky test detection with root cause classification
- AI summaries posted to GitHub commits and GitLab MRs
- Real-time results streaming via WebSocket
- Code coverage per file breakdown

Pros
- Combines test management and automated test reporting on the same platform
- No per-user pricing, flat monthly rate per workspace
- Playwright-native with under 10-minute setup
- AI failure classification, trace viewer, and error grouping built in
- Broad CI/CD support: GitHub Actions, GitLab CI, Azure DevOps, TeamCity
- 1-click bug filing into Jira, Linear, Asana, or monday

Cons
- Purpose-built for Playwright (multi-framework support on the roadmap)
First-Hand Experience
Teams using Develocity are familiar with build analytics: build scans, caching, and test distribution insights. While this works well for build performance, teams often need additional tools for test case management, failure analysis, and debugging evidence.
TestDino brings test management and automated test reporting together in a single platform. Manual test cases are organized into suites up to six levels deep with ownership, custom fields, and version history. Playwright results are available from the first CI run, complete with dashboards, analytics, and AI failure classification, without reporter configuration or adapter maintenance. The Test Explorer displays manual and automated tests side by side, sortable by flaky rate, tags, and coverage status.
Debugging That Saves You from Re-running Locally
Every failed test includes screenshots, video recordings, browser console logs, and an interactive trace you can step through action by action as soon as the CI run finishes. AI Insights classifies failures as Actual Bug, UI Change, Unstable Test, or Miscellaneous, making it easier to identify what needs attention.
When a defect needs reporting, you create an issue in Jira, Linear, Asana, or monday with a single click, pre-filled with error details, stack trace, failure history, and direct links to the test run and CI job.
CI/CD Speed and Merge Safety
Only failed tests are re-executed instead of running the entire suite again, reducing CI time and speeding up feedback. This works across sharded executions and multiple CI runners.
GitHub CI Checks add quality gates directly to pull requests, letting teams enforce minimum pass rates, require critical tags, and apply different rules for each environment. AI-generated summaries are posted to GitHub commits and GitLab merge requests with pass, fail, and flaky test counts.
Flaky Test Detection That Tells You Why
Instead of simply marking tests as flaky, failures are grouped by root cause: timing-related issues, environment dependencies, network instability, and intermittent assertions. Every test receives a stability percentage, and flaky rates can be compared across environments to identify infrastructure problems.
Real-Time Streaming and Scheduled Reports
Test results stream to the dashboard as soon as each test finishes, so teams monitor progress without waiting for the full suite to complete. Automated PDF reports provide daily, weekly, or monthly summaries of test health, while Slack notifications deliver run summaries filtered by environment and branch.
MCP Server for AI-Assisted Test Management
An MCP Server connects AI assistants such as Cursor, Claude Code, and GitHub Copilot directly to your test workspace. Using natural language, teams list test runs, retrieve debugging context, perform root cause analysis, create and manage manual test cases, organize test suites, track releases, and execute manual test runs, all without switching between tools.
Pricing & Value
Pricing is workspace-based, not per user. Pricing may change, so check the pricing page for the latest details.
Final Verdict
For teams using Playwright, TestDino offers a broader solution than Develocity. While Develocity focuses on build analytics and CI performance, TestDino combines test management, AI failure classification, trace viewing, flaky test detection, and CI/CD quality gates in one platform.
Instead of relying on multiple tools to manage testing and investigate failures, teams get everything in a single workspace. Starting at $39/month billed annually per workspace, it delivers both test management and actionable test intelligence at a predictable price.
2. BuildPulse
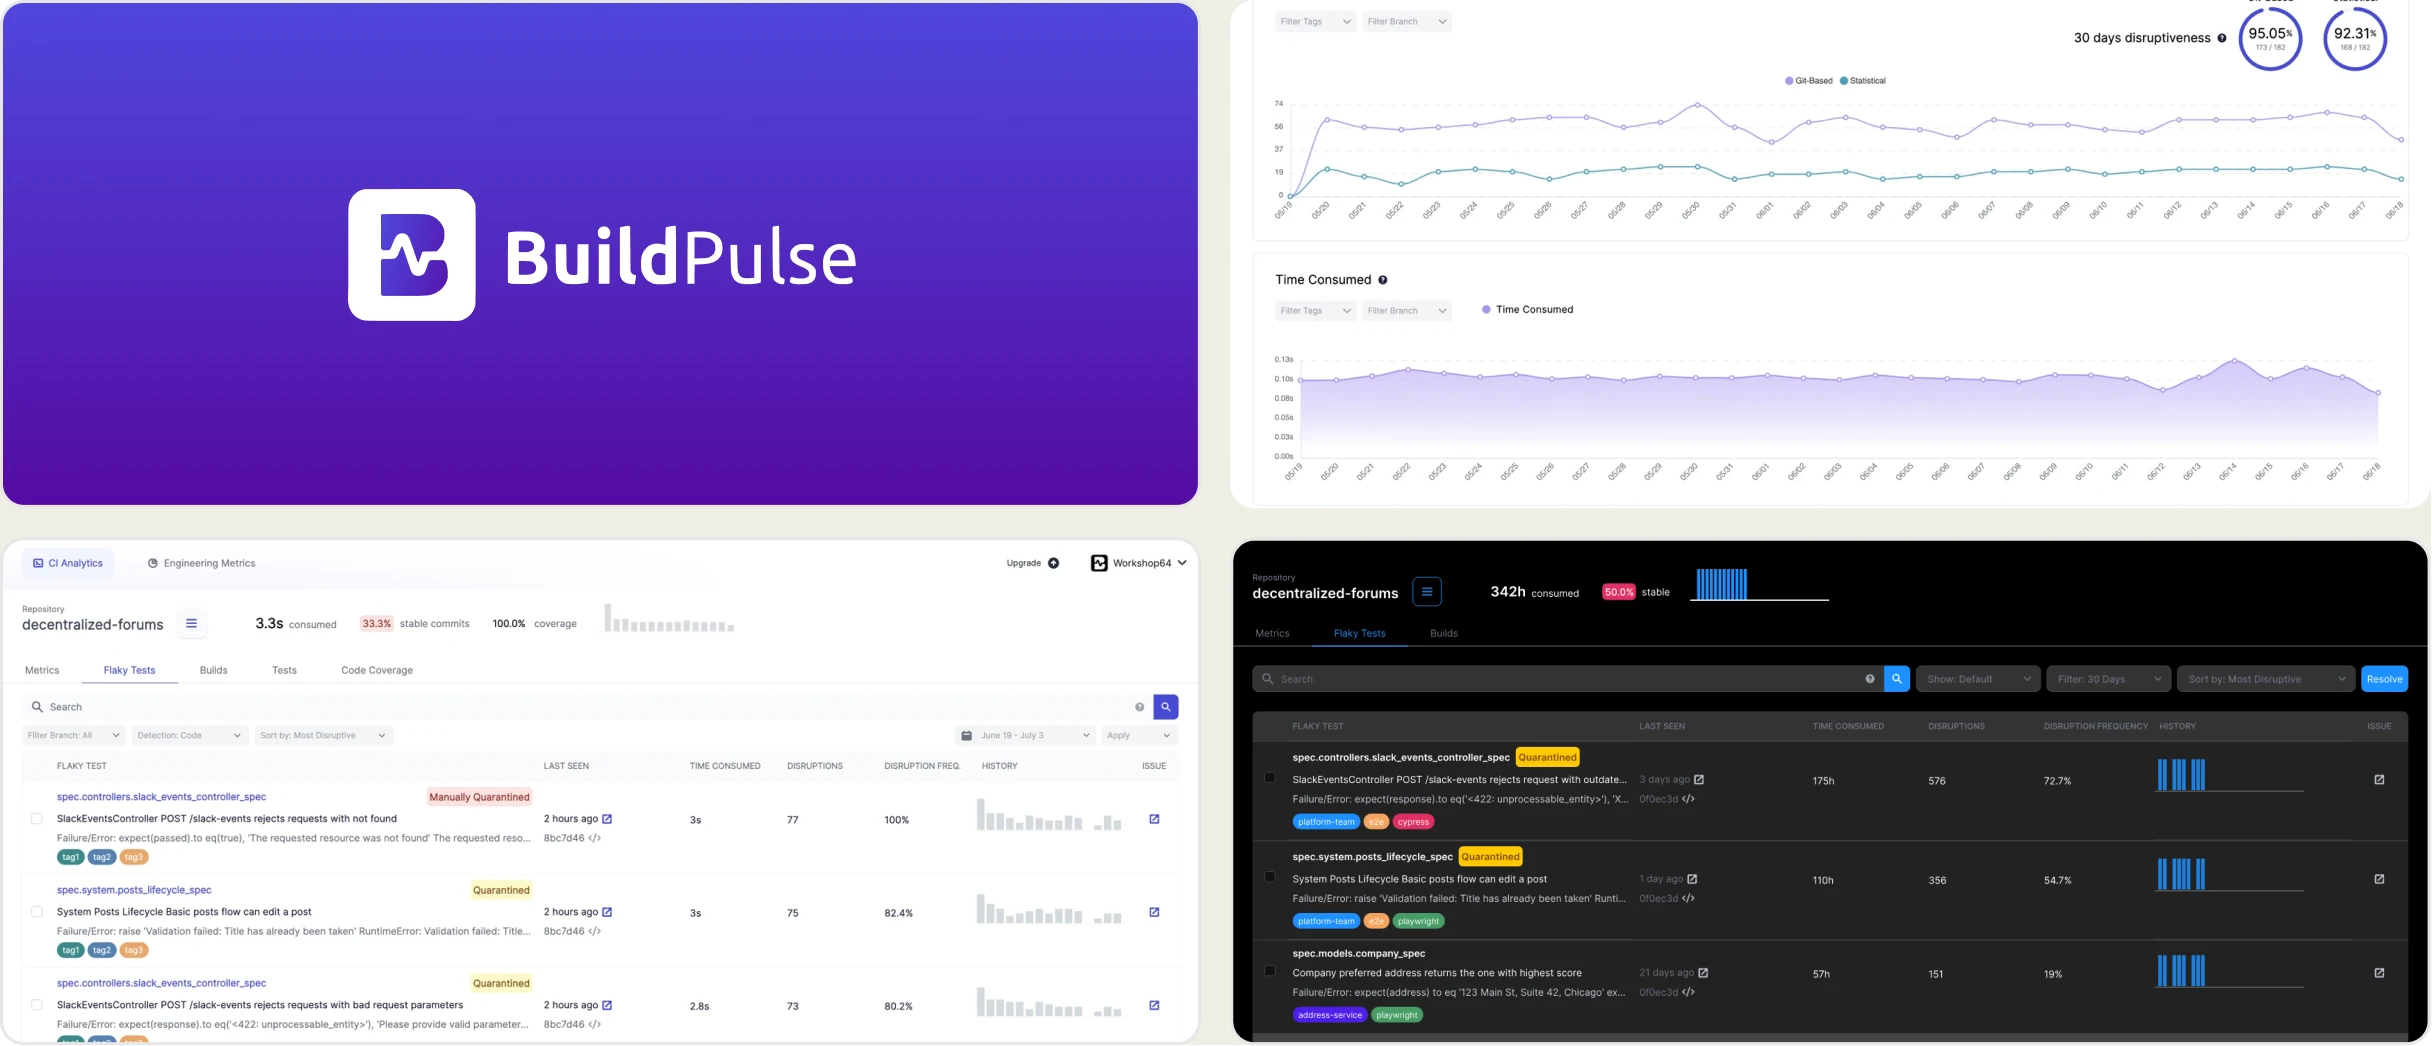
Best for:
Engineering teams that want to detect flaky tests and reduce wasted CI time.
Platform Type:
CI observability and flaky test detection platform.
Integrations with:
GitHub Actions, CircleCI, Buildkite, Jenkins, GitLab CI, Travis CI.
Key Features:
- Flaky test detection
- CI test reporting and dashboards
- Historical test execution insights
- GitHub pull request integration
- Supports Playwright and other test frameworks
- Easy CI integration
Pros
- Easy to set up with existing CI pipelines
- Helps identify flaky tests quickly
- Clear dashboards for test results
- Works with multiple CI platforms
Cons
- No built-in test case management
- No Playwright trace viewer or debugging workspace
- No AI-powered failure classification
- No MCP server for AI-assisted workflows
First-Hand Experience
BuildPulse integrates quickly with existing CI pipelines and starts identifying flaky tests with minimal configuration. The dashboards make it easy to track failure trends and understand which tests are reducing pipeline reliability.
When deeper investigation is needed, teams still rely on separate tools for Playwright traces, AI-powered failure analysis, manual test management, and debugging evidence. As automation grows, BuildPulse works best as a flaky test analytics platform rather than a complete test intelligence solution.
Pricing & Value
BuildPulse offers a Startup plan starting at $99/month, along with Enterprise pricing for larger organizations. It delivers good value for teams primarily focused on flaky test detection and CI reliability, but organizations that also need test management and advanced debugging may require additional tools.
Final Verdict
BuildPulse is a strong choice for teams looking to improve CI reliability through flaky test detection and historical test analytics. If your workflow also requires test management, AI-powered failure classification, Playwright debugging, and CI/CD quality gates, a platform like TestDino provides a more complete solution in a single workspace.
3. CircleCI
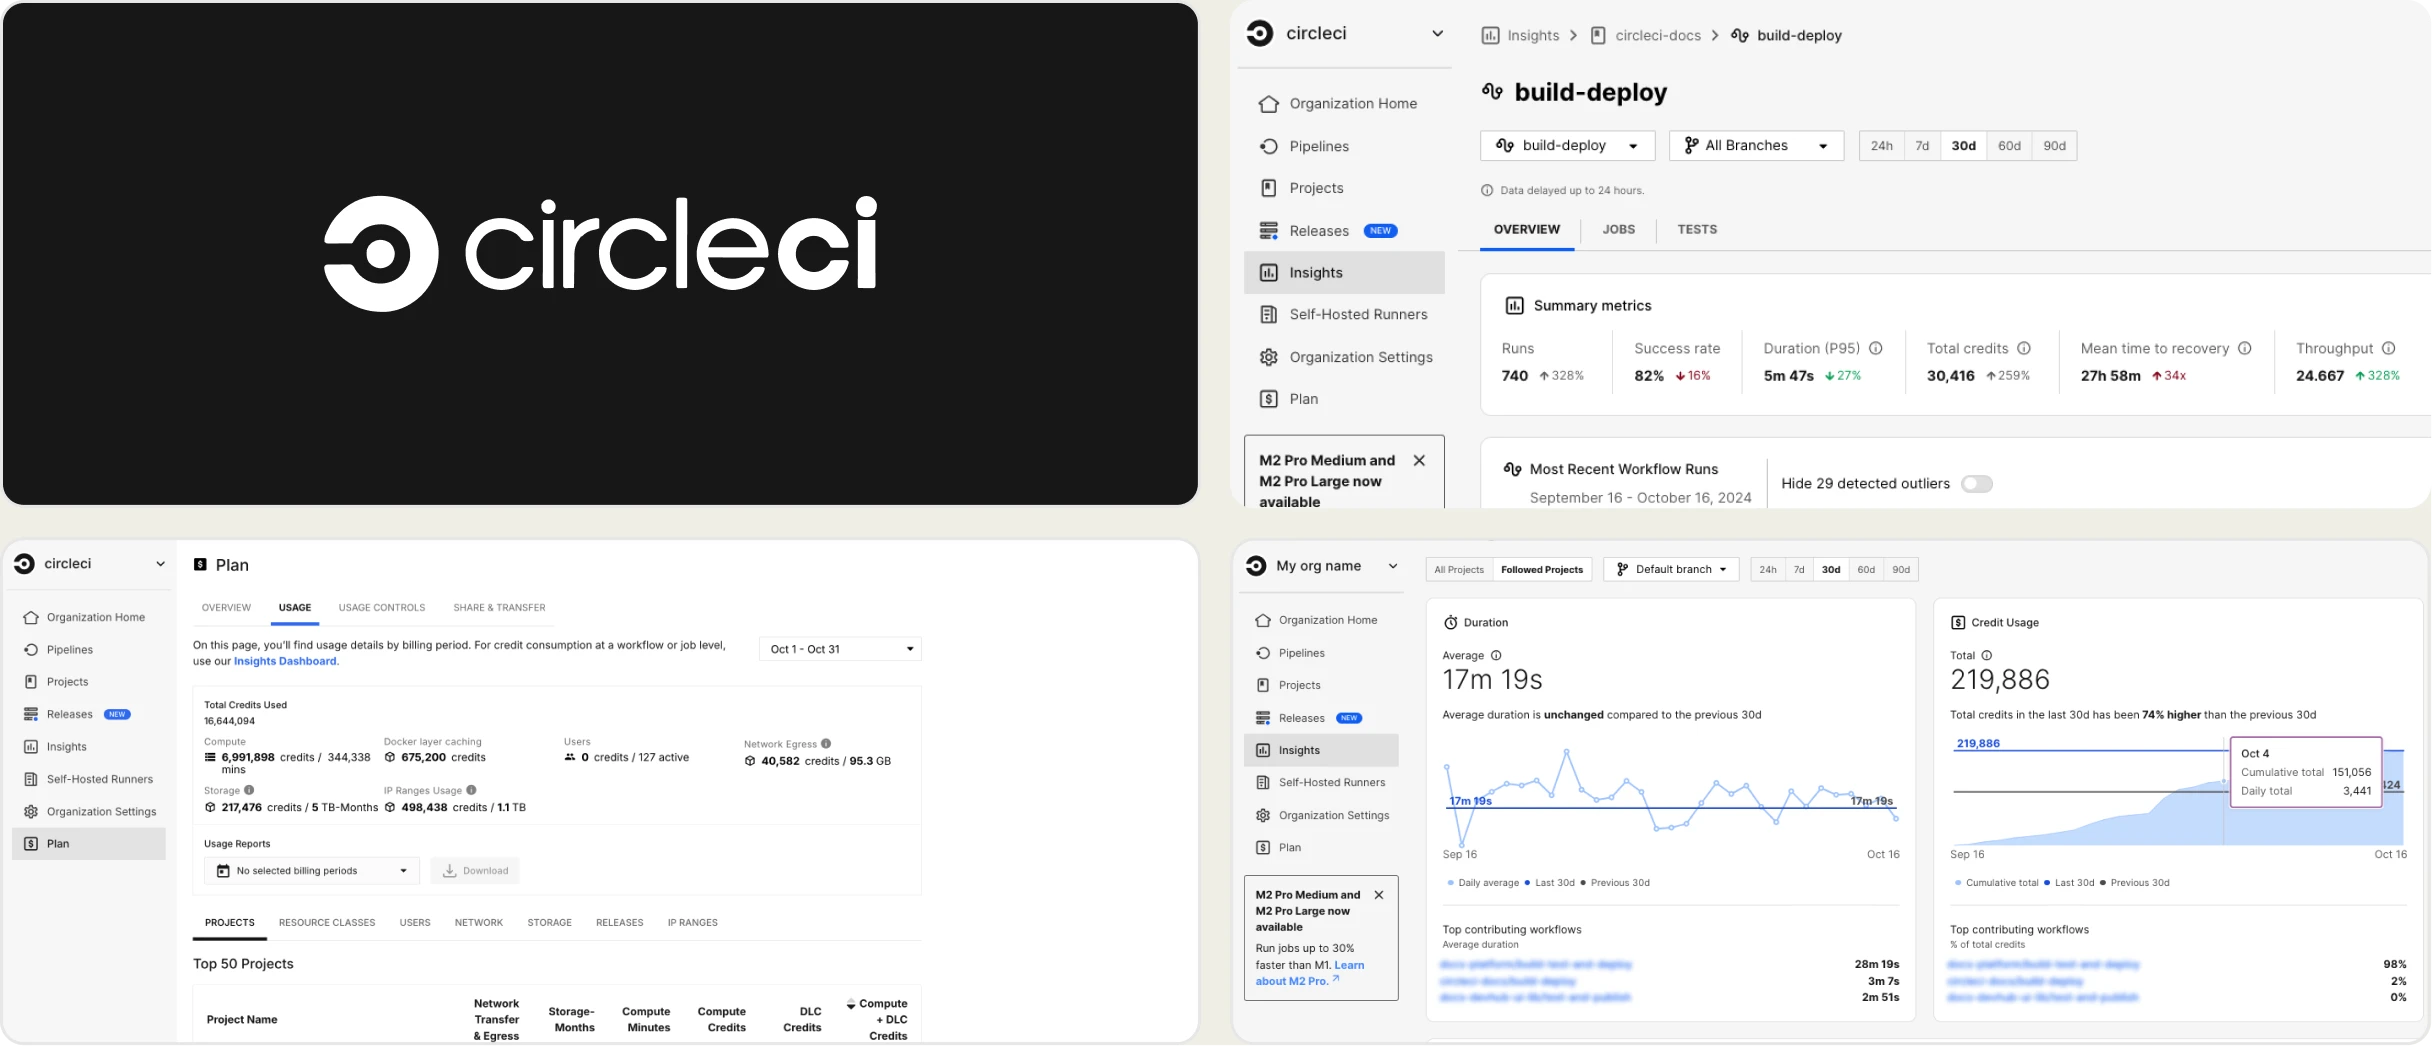
Best for:
Development teams that want a reliable CI/CD platform to automate builds, testing, and deployments.
Platform Type:
CI/CD platform.
Integrations with:
GitHub, GitLab, Bitbucket, Slack, AWS, Azure, Docker, Kubernetes.
Key Features:
- CI/CD pipeline automation
- Parallel test execution
- Test insights and reporting
- GitHub and GitLab integration
- Pipeline caching to improve build speed
- Supports Playwright and other testing frameworks
Pros
- Easy to automate build and test workflows
- Fast pipeline execution with parallel jobs
- Supports many development tools and integrations
- Clear pipeline monitoring and reporting
Cons
- No built-in test case management
- No Playwright trace viewer
- No AI-powered failure classification
- Limited flaky test analysis compared to dedicated tools
First-Hand Experience
CircleCI is easy to set up and provides a reliable way to automate builds, tests, and deployments. Features like parallel execution and caching help reduce build times, while the dashboard makes it simple to monitor pipeline status and test results.
When a Playwright test fails, debugging usually requires switching between CI logs and external reporting tools. There is no built-in trace viewer, AI-powered failure classification, or centralized test management, so teams often combine CircleCI with a dedicated test reporting platform.
Pricing & Value
CircleCI offers a Free plan, with paid plans starting at $15/month (Performance plan). It provides good value for teams looking for a scalable CI/CD solution, although organizations that need advanced test reporting and debugging will likely require additional tools.
Final Verdict
CircleCI is a solid choice for teams looking to automate CI/CD pipelines and speed up software delivery. If your team also needs AI-powered failure analysis, Playwright debugging, flaky test detection, and test management in one platform, a solution like TestDino provides a more complete testing workflow.
4. Trunk
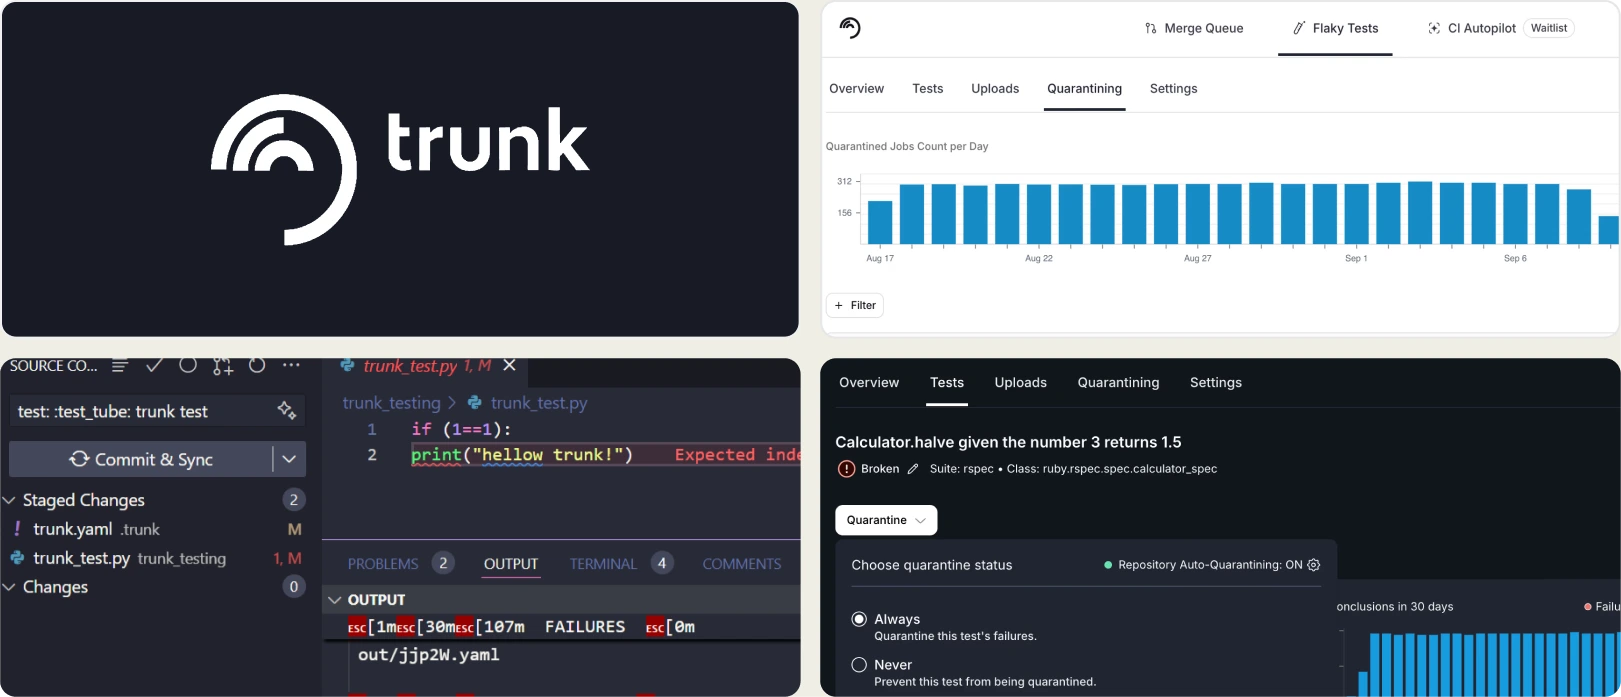
Best for:
Teams that need reliable CI pipelines with automated flaky test management at scale.
Platform Type:
CI reliability platform with flaky test detection.
Integrations with:
GitHub, Jira, Linear, Slack.
Key Features:
- Flaky test detection
- CI insights and reporting
- Parallel test execution support
- Jira and Linear ticket auto-creation
- Supports Playwright and other testing frameworks
Pros
- Automatically quarantines flaky tests to keep CI stable
- Supports any language or testing framework
- Creates Jira/Linear tickets for flaky tests automatically
Cons
- Lacks test reporting dashboards and run history views
- No Playwright-specific debugging or trace support
- Pricing is not transparent; requires contacting sales
First-Hand Experience
Trunk integrates smoothly with existing CI pipelines and focuses on improving developer productivity by reducing flaky tests and optimizing merge workflows. The dashboards provide useful insights into test stability and CI performance, making it easier to identify recurring issues.
Debugging still depends on CI logs and external tools, as there is no built-in Playwright trace viewer, AI-powered failure classification, or centralized test management. Teams using Playwright often pair Trunk with a dedicated test reporting platform for deeper test analysis.
Pricing & Value
Trunk offers a Free plan, with custom pricing for Pro and Enterprise plans. It provides good value for teams focused on CI optimization and developer productivity, but organizations looking for complete test management and advanced debugging will likely need an additional platform.
Final Verdict
Trunk is a good option for teams that want to improve CI performance and reduce flaky tests without changing their existing workflows. If you also need test management, AI-powered failure analysis, Playwright debugging, and CI/CD quality gates in one place, TestDino offers a more complete solution.
5. Datadog Test Optimization
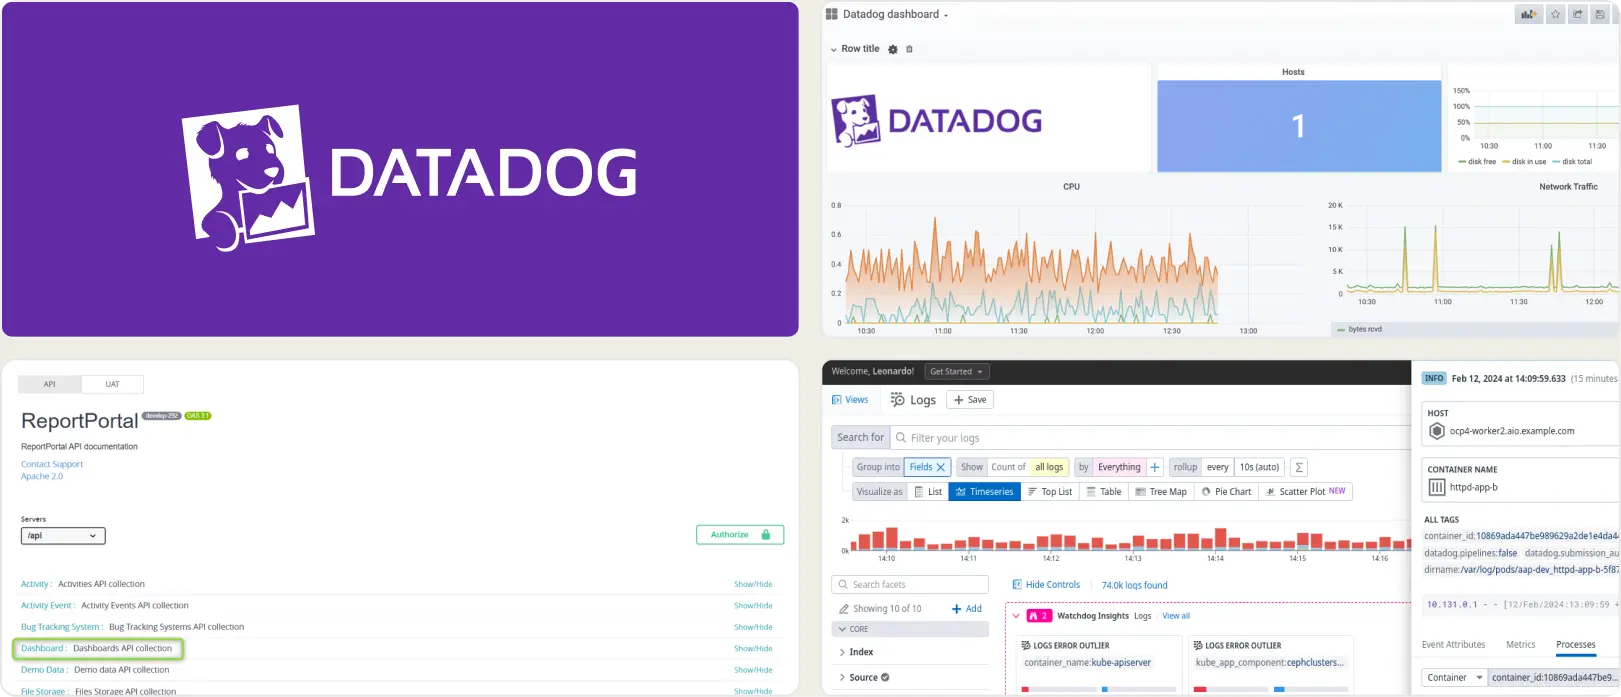
Best for:
Teams using Datadog for observability who want test visibility alongside their existing monitoring.
Platform Type:
CI observability tool with built-in test insights.
Integrations with:
CI/CD, Slack, Jira, PagerDuty.
Key Features:
- View test runs directly inside CI pipeline dashboards
- Detect and track flaky tests automatically
- Build custom dashboards with alert rules
- Trace test execution with flame graphs
- Monitor CI pipeline performance metrics
Pros
- Integrates well if Datadog is already in your stack
- Reliable and mature flaky test detection
- Strong visibility at the CI pipeline level
Cons
- Designed for system monitoring, not dedicated test reporting
- Interface can feel complex for QA teams
- Costs scale with data ingestion and retention usage
First-Hand Experience
Datadog Test Optimization works best when your team already relies on Datadog for infrastructure monitoring. QA engineers may find navigating system monitoring interfaces to reach test insights cumbersome. Teams focused purely on test reporting will need a dedicated tool to fill the gap.
Pricing & Value
Starts at $20/month per committer with usage-based pricing. Costs scale unpredictably with test artifacts and log volume. Test spans are retained for 3 months.
Final Verdict
A solid choice for teams already in the Datadog ecosystem. QA-led teams wanting focused test management will find purpose-built tools more efficient.
6. Buildkite Test Engine
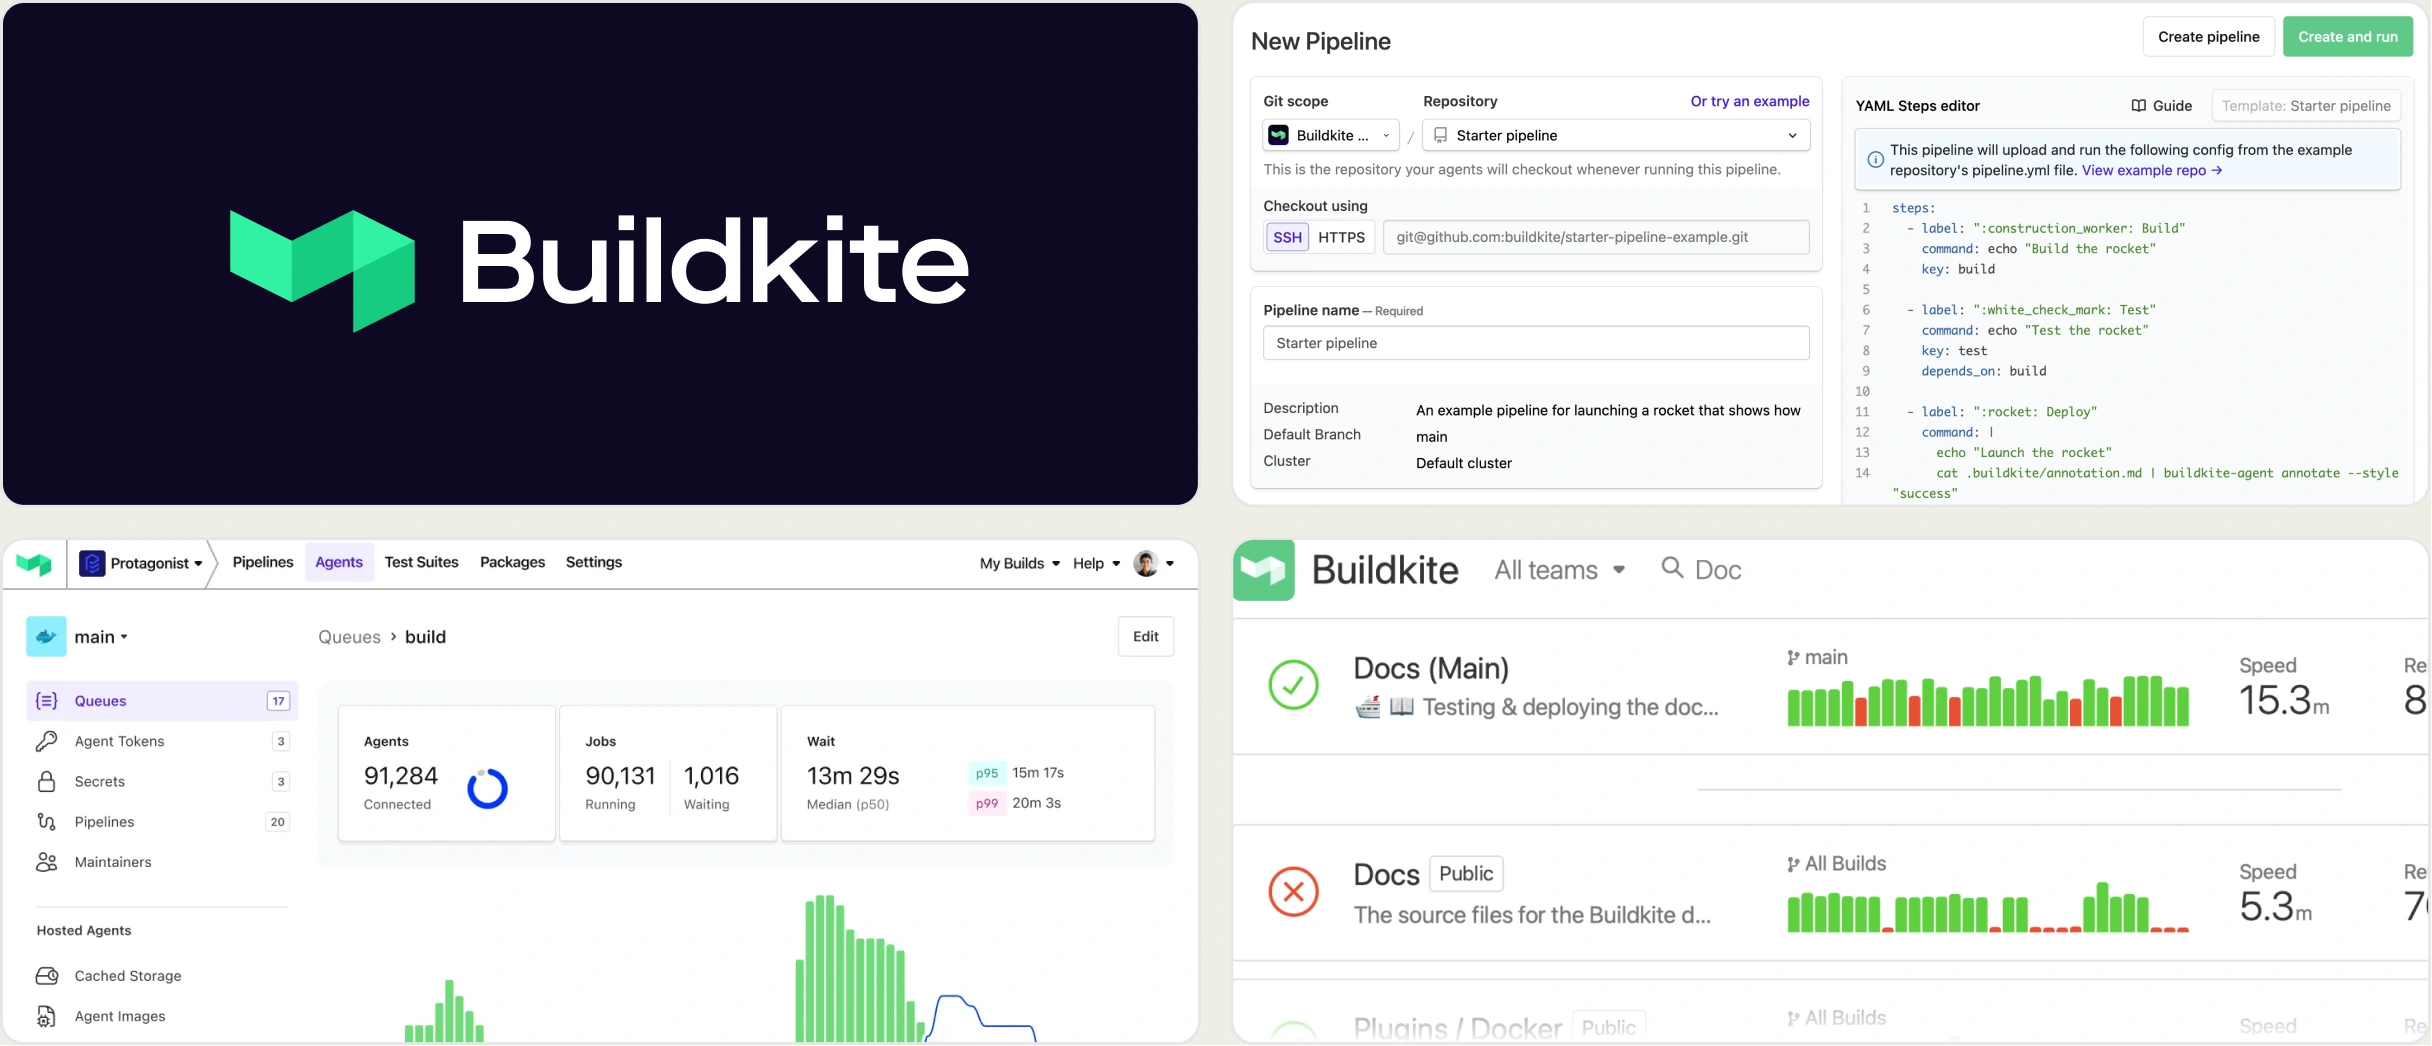
Best for:
Buildkite users looking to track test suite performance and control flaky tests natively.
Platform Type:
Native test analytics and reporting module built into the Buildkite platform.
Integrations with:
Buildkite Pipelines, GitHub Actions, Jenkins, CircleCI, Slack.
Key Features:
- Test result collection across all test types
- Flaky test detection with auto-quarantine
- Suite performance and slow-test insights
- Per-test execution history and duration trends
- Broad framework support including Playwright and JUnit
Pros
- Strong flaky test detection and quarantine
- Works with any CI pipeline, not Buildkite-only
- Free tier available with unlimited executions on Pro
Cons
- Suite analytics focus, not Playwright-specific reporting
- No trace viewer or test case management
- Best suited for existing Buildkite users
First-Hand Experience
Buildkite Test Engine collects test results from any CI pipeline and delivers suite-level analytics including flaky test detection, auto-quarantine, slow-test insights, and per-test history. Playwright is supported alongside many other frameworks.
Debugging is data-driven through history and timing trends rather than a trace viewer, so it suits teams focused on suite reliability over deep Playwright-specific reporting.
Pricing & Value
Free tier includes 50,000 executions/month. Pro is $30/user/month with unlimited executions and 250 managed tests. Enterprise is custom.
Final Verdict
A solid fit for Buildkite teams wanting flaky test management and suite analytics. Playwright-first teams needing trace viewing and test case management should consider a dedicated platform.
What to Look for in a Develocity Alternative
Develocity is a powerful platform for build performance and CI observability, but it isn't designed as a complete test management or test intelligence solution. As teams adopt Playwright and larger CI pipelines, they often need capabilities beyond build analytics. When comparing the best Develocity alternatives, focus on these criteria.
Build Analytics vs. End-to-End Test Management
Develocity helps teams understand build performance, caching, and CI efficiency, but it doesn't provide built-in test case management or structured QA workflows. If your team manages both manual and automated testing, look for a platform that combines test management with automated test reporting in one place instead of relying on multiple tools.
AI-Powered Failure Analysis
Build metrics show which jobs failed, but they don't always explain why tests failed. AI-powered failure classification, smart error grouping, and root cause analysis help teams identify real bugs, flaky tests, and environment issues faster. This reduces manual investigation and speeds up debugging.
Playwright Debugging and Test Evidence
Modern testing platforms should provide debugging evidence immediately after a CI run. Built-in Playwright trace viewing, screenshots, video recordings, and console logs make it easier to investigate failures without rerunning tests locally. If a tool only provides build logs, debugging becomes slower and more manual.
Flaky Test Detection and Test Stability
Finding flaky tests is only part of the process. The best Develocity alternatives also help explain why tests are flaky by tracking historical execution data, identifying failure patterns, and measuring test stability over time. These insights help teams improve both test reliability and CI performance.
CI/CD Optimization
A good platform should do more than display build and test results. GitHub quality gates, branch-based policies, automated summaries, and shard-aware live results improve merge confidence. Look for tools that act on CI results instead of only reporting them.
Transparent Pricing
Develocity primarily uses custom enterprise pricing, making it harder for smaller teams to estimate costs upfront. Alternatives with public pricing or predictable plans make it easier to compare tools, budget accurately, and scale without lengthy sales discussions. Before choosing a platform, evaluate the total cost alongside the features your team actually needs.
Wrapping Up
Every tool on this list addresses a different part of the software delivery process. Develocity excels at build performance optimization and CI observability, BuildPulse focuses on flaky test detection, CircleCI simplifies CI/CD automation, Trunk improves developer productivity, and Buildkite Test Engine adds suite-level analytics.
The right choice depends on whether your priority is build analytics, CI optimization, or test intelligence.
If your team needs more than build insights, TestDino offers a complete testing platform for Playwright workflows. It combines test management, AI-powered failure classification, flaky test detection, trace viewing, and CI/CD quality gates in a single workspace, starting at $39/month billed annually per workspace.
Trade build metrics for test intelligence
See why each CI failure happenedTrack flaky tests by root causeFAQs
Yes. You can connect your existing CI pipelines to TestDino and start sending Playwright test results from your first CI run. Along with automated test reporting, TestDino also provides built-in test management, AI-powered failure analysis, and Playwright debugging in a single platform.