Bug Cost and Escape Rate Report
Bugs caught during requirements cost 100x less to fix than bugs found in production. Yet most teams don’t track where their defects escape. This report breaks down the cost of software bugs by SDLC phase, defect escape rate benchmarks from Capers Jones and DORA 2024, and five concrete actions to improve defect removal efficiency and reduce quality costs.

Bugs are expensive. Not a little expensive. Catastrophically expensive.
The Consortium for Information & Software Quality (CISQ) puts the cost of software bugs in the US alone at $2.41 trillion per year. That's bigger than the GDP of most countries.
But here's what makes that number even worse. Most of those bugs were fixable. Early. Cheaply. Before they ever reached a customer.
The problem isn't that bugs exist. Every codebase has them. The problem is that teams catch them too late, when the cost to fix them has already multiplied 10x, 30x, or even 100x.
This report breaks down two metrics that every engineering manager and QA lead should track: the cost of software bugs by SDLC phase, and the defect escape rate. Together, they tell you how much quality failures actually cost your team, and how many bugs are slipping through to production.
If you run a team that ships software, these are numbers worth knowing.
What is the cost of software bugs, and why does it keep growing?
The cost of software bugs is the total financial impact of software defects. It includes the direct cost of finding and fixing bugs, the indirect cost of downtime, lost customers, and wasted engineering time, and the opportunity cost of not building new features because your team is stuck firefighting.
Think of it like a leaky pipe in a building. A small drip during construction takes five minutes to patch. The same leak discovered after tenants move in? Now you're ripping open walls, relocating people, and filing insurance claims. The leak didn't change. The timing did.
That's exactly how software bugs work. A bug caught during a code review costs minutes. The same bug in production can cost millions.
The $2.41 trillion breakdown
The CISQ 2022 report, authored by Herb Krasner and co-sponsored by Synopsys, breaks down US software quality costs into three categories:
| Cost category | Estimated annual cost (US) |
|---|---|
| Operational software failures (including cybercrime) | ~$1.56 trillion |
| Accumulated technical debt | ~$1.52 trillion |
| Unsuccessful IT projects (cancelled or over-budget) | Included in total |
| Total cost of poor software quality | $2.41 trillion |
A few things stand out here:
Technical debt alone accounts for $1.52 trillion. That's the money organizations spend on maintaining and patching old code instead of building new things.
Cybercrime losses tied to software vulnerabilities jumped 64% from 2020 to 2021 (CISQ 2022).
Open-source software supply chain failures grew by 650% between 2020 and 2021 (Security Magazine, 2022).

Tip: If you're building a business case for better testing or test reporting, that $2.41 trillion figure is the headline. But the real argument for your CFO is how much of that cost shows up in your own engineering budget: wasted sprints, emergency hotfixes, and delayed features.
How much does it cost to fix a bug at each SDLC phase?
This is the most frequently cited stat in software quality, and also the most frequently misquoted.
The original data comes from IBM's Systems Sciences Institute. Here's what they actually found:
| SDLC phase | Relative cost to fix | Example (if requirements fix = $100) |
|---|---|---|
| Requirements | 1x | $100 |
| Design | 3-5x | $300-$500 |
| Implementation/Coding | 6x | $600 |
| Testing/QA | 15x | $1,500 |
| Production/Maintenance | 100x | $10,000 |
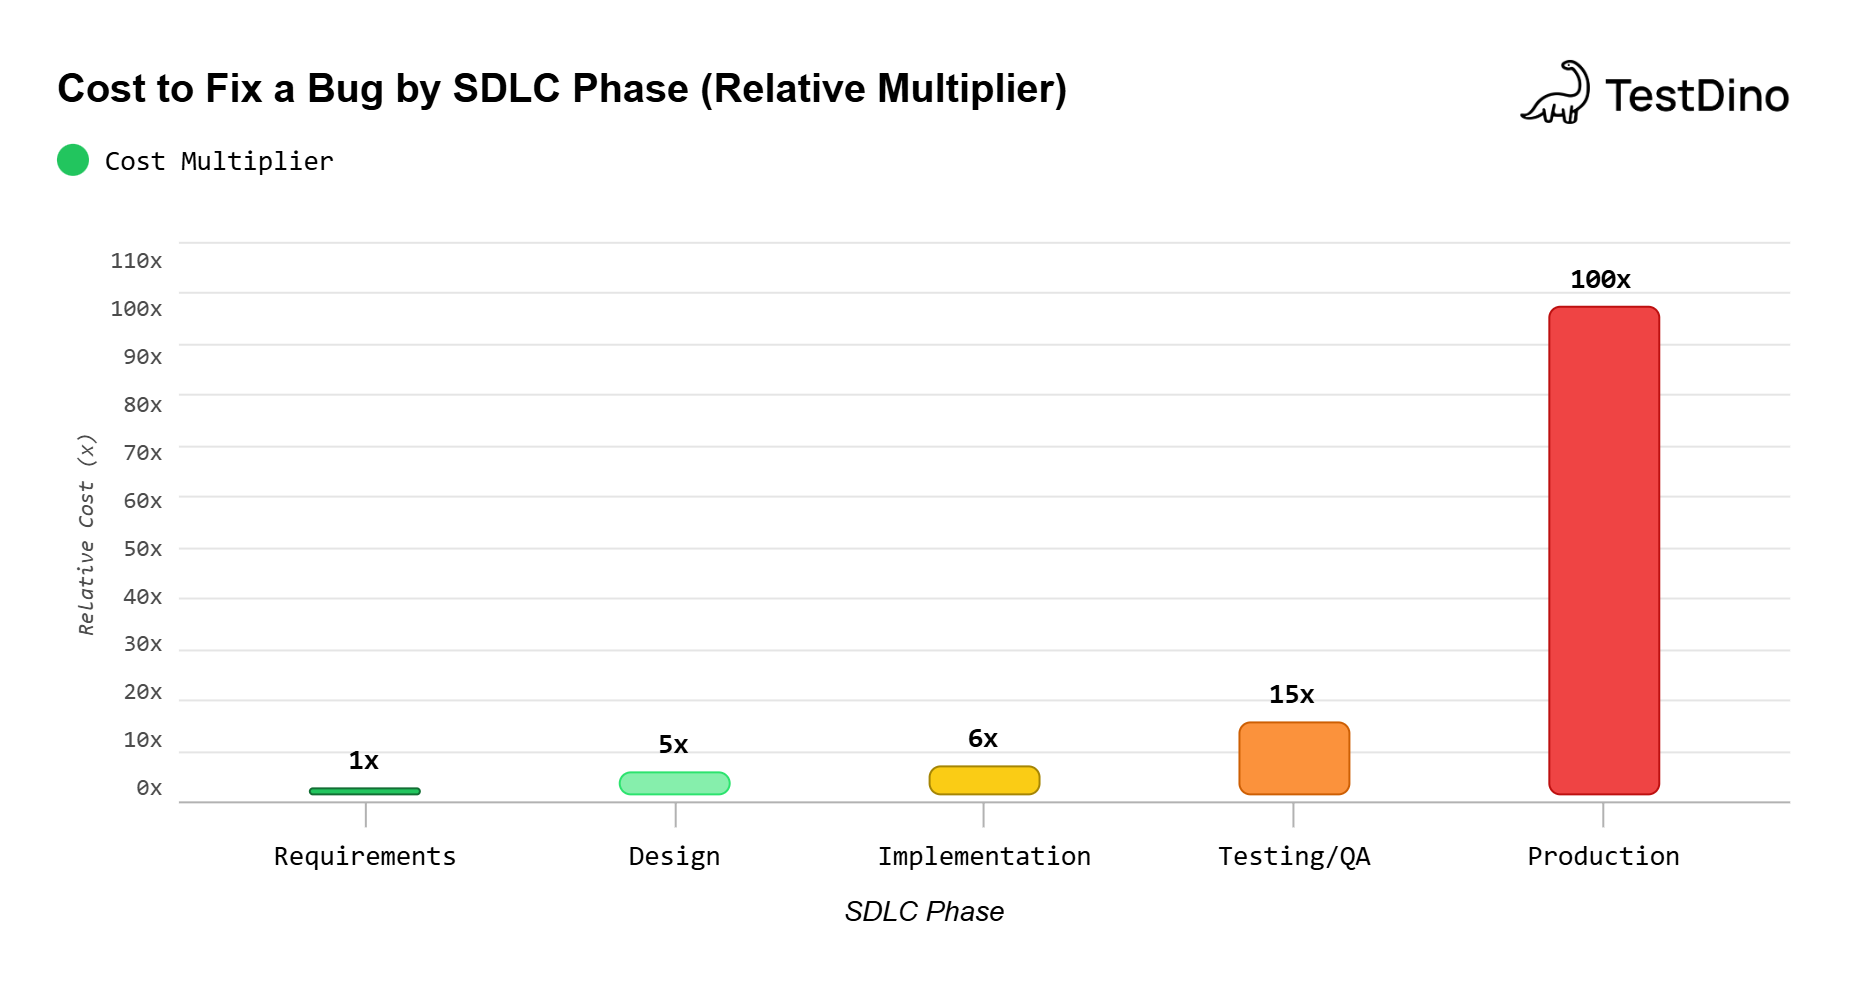
Note: You'll see the "100x" number quoted everywhere. Some people attribute it to a 1970s study. Others say it's outdated. The truth is nuanced. The exact multiplier depends on the type of software, the team size, and the severity of the bug. But the direction of the curve, that bugs get exponentially more expensive to fix the later they're found, has been confirmed repeatedly in modern research.
Why does the cost multiply?
Because fixing a late-stage bug isn't just about fixing code. It's about:
- Context switching: The developer who wrote the code may not remember it. They need to reread, re-understand, and re-contextualize.
- Blast radius: A production bug may affect real users, real data, and real transactions. That means customer support, incident response, and sometimes legal involvement.
- Retesting: A fix in production needs to go through the full cycle again: code, review, test, stage, deploy.
- Opportunity cost: Every hour spent on a production hotfix is an hour not spent on the next feature or improvement.
The CrowdStrike incident in July 2024 is the most dramatic recent example.
- A single faulty software update, one that could have been caught with a broader test or staged rollout, crashed 8.5 million Windows systems worldwide.
- Fortune 500 companies alone lost an estimated $5.4 billion in direct financial impact (Parametrix, 2024).
- Delta Air Lines reported $380 million in revenue losses from that single incident (International Banker, 2024).
One bug. Billions lost!
Tip: The cost multiplier chart above is the strongest visual argument for shift-left testing. If your team invests $1 in catching bugs during design, you're avoiding $100 in production costs. When your CFO asks, "Why do we need more test infrastructure?", this table is your answer.
Defect escape rate
Why this metric matters for managers
Defect escape rate tells you something that pass/fail counts never will: how much you can trust your tests.
A test suite can show 95% pass rate and still have a terrible escape rate. Why? Because the tests might be passing trivially. They might not cover the right paths. They might be flaky and give you false confidence.
Escape rate cuts through all of that. It measures output, not activity.
Defect escape rate benchmarks: what's average, what's good, and what's great?
Here's how industry benchmarks stack up, compiled from Capers Jones's research (Software Development Patterns and Antipatterns, 2021), DORA 2024 data, and KPI benchmarking sources:
| Performance level | Defect escape rate | Defect removal efficiency (DRE) | Context |
|---|---|---|---|
| Low-performing | 15-25%+ | Below 85% | Common in teams without structured QA |
| Average | 10-15% | 85-90% | The US industry average per Capers Jones |
| Good | 5-10% | 90-95% | Teams with solid automated testing |
| High-performing | 2-5% | 95-98% | Teams using static analysis + testing + code reviews |
| Elite | Below 2% | 99%+ | Requires inspections + static analysis + formal testing |
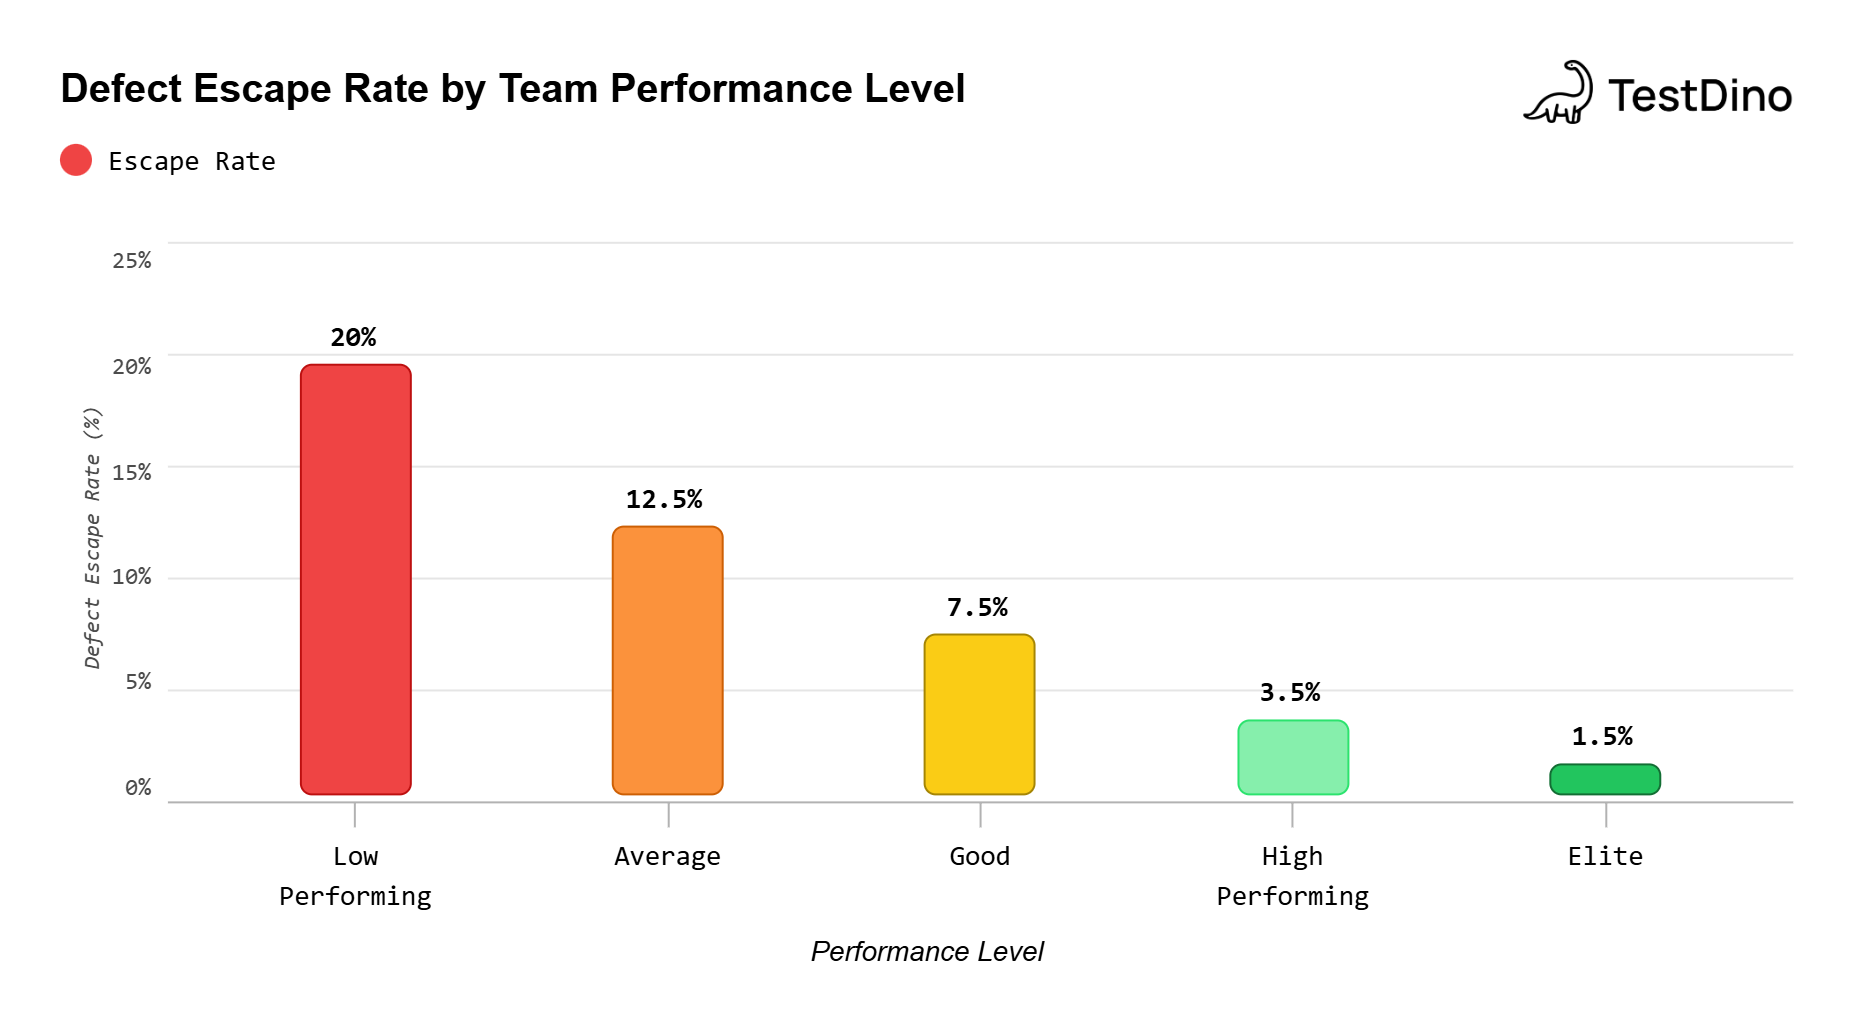
Key insight: Most forms of testing alone are less than 50% efficient at finding bugs (Capers Jones, 2021). To achieve a DRE above 95%, you need a combination of pre-test inspections, static analysis, and automated testing. No single technique gets you there on its own.
Defect removal efficiency (DRE)
Here's how to measure it in practice:
-
Track all bugs found during development (code reviews, CI tests, QA testing, staging).
-
After release, track all user-reported bugs for 90 days.
-
Calculate: Internal bugs / (Internal bugs + User-reported bugs) = DRE.
DRE by the defect removal method
Not all quality practices contribute equally. Here's what the research shows:
| Removal method | Typical DRE | Notes |
|---|---|---|
| Unit testing | 25-35% | Catches code-level bugs only |
| Integration testing | 30-40% | Catches interaction bugs between modules |
| System/E2E testing | 35-45% | Catches user-facing workflow bugs |
| Code inspections | Up to 85% | Most effective single method |
| Static analysis | ~55-65% | Good for catching patterns and security issues |
| Combined (inspections + static + testing) | 97%+ | The only path to elite DRE |
Note: About 7% of bug fixes introduce new bugs. Capers Jones calls these "bad-fix injections." So your actual defect removal is slightly lower than your raw fix count suggests.
What DORA metrics tell us about escape rates and team performance
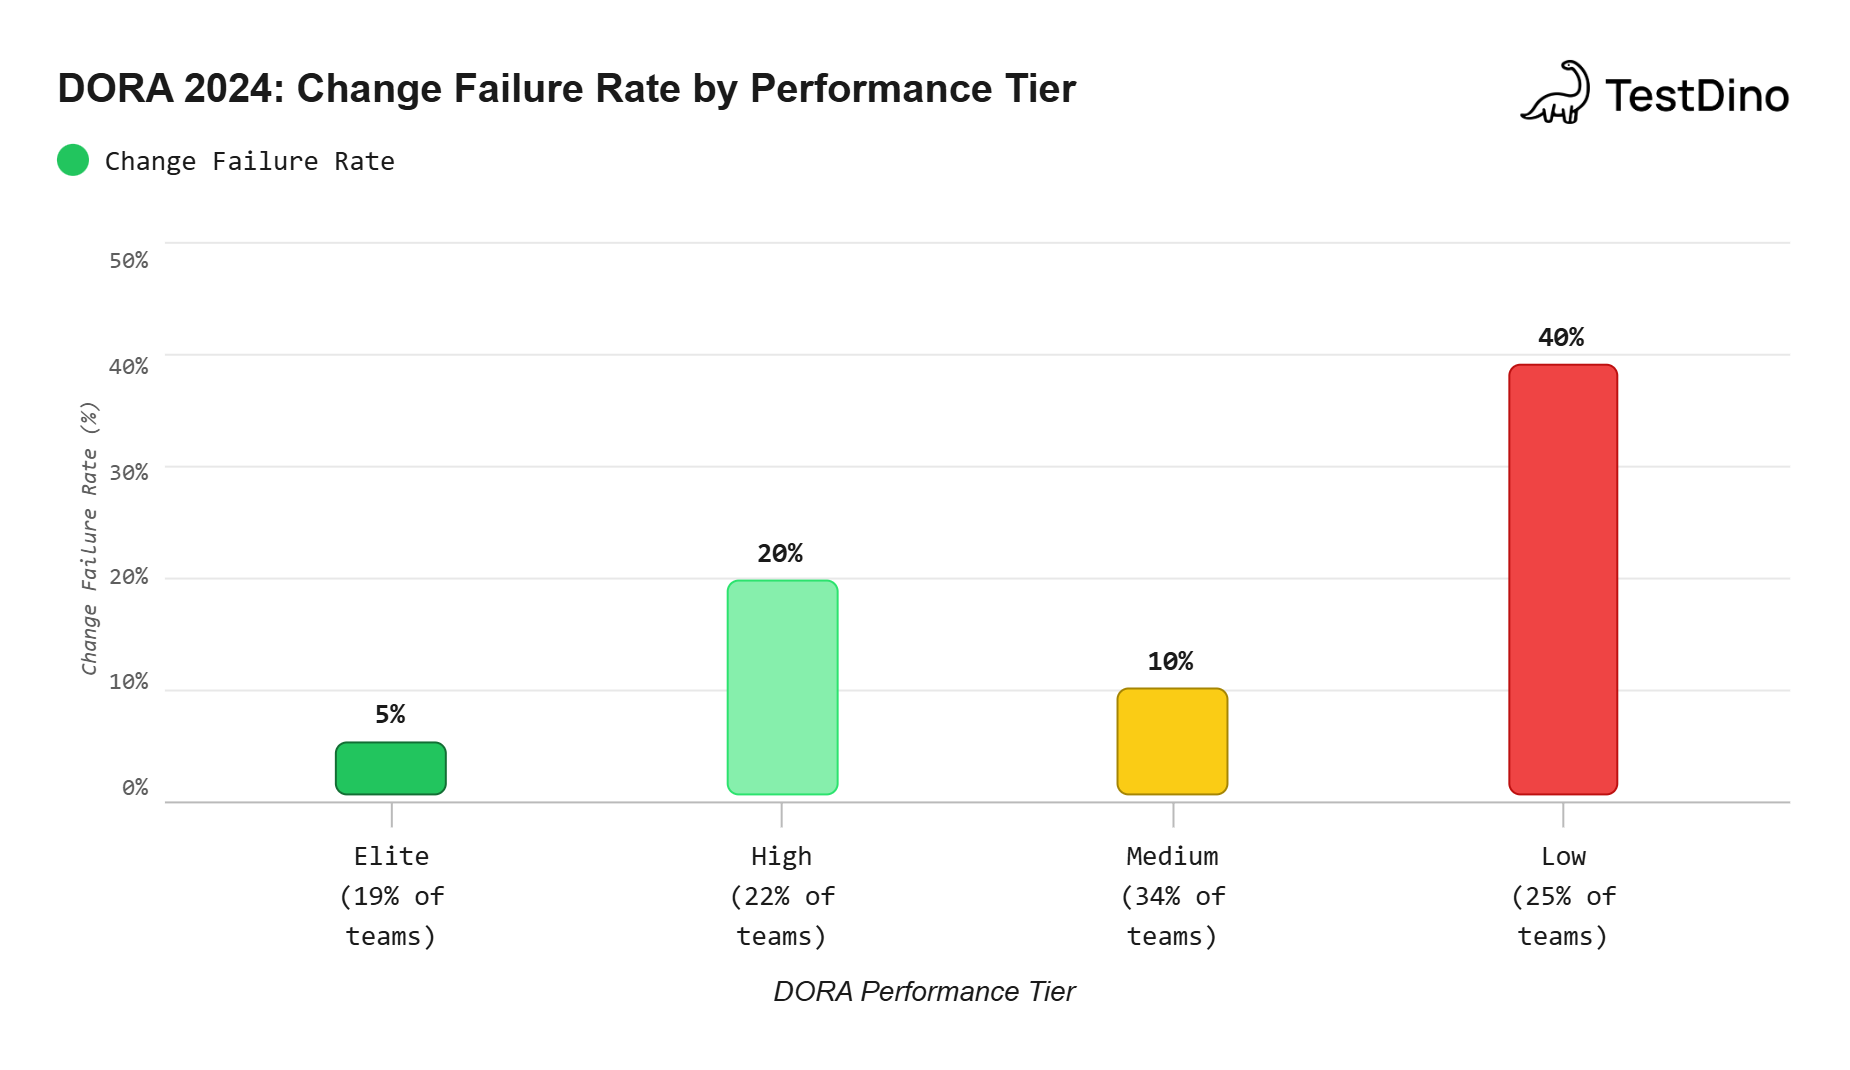
The 2024 Accelerate State of DevOps report from Google's DORA team surveyed over 39,000 professionals worldwide. One of their four core metrics, change failure rate, is essentially a defect escape rate for deployments.
Here's how performance tiers break down (DORA 2024):
| Performance tier | Change failure rate | Deployment frequency | Recovery time | % of teams (2024) |
|---|---|---|---|---|
| Elite | ~5% | On demand (multiple/day) | Under 1 hour | 19% |
| High | ~20% | Daily to weekly | Under 1 day | 22% |
| Medium | ~10% | Weekly to monthly | Under 1 day | 34% |
| Low | ~40% | Monthly to every 6 months | 1 week to 1 month | 25% |
A few standout findings:
-
Elite performers deploy 182x more often than low performers while maintaining 8x lower failure rates (Octopus Deploy, 2024).
-
Only 19% of teams reached elite performance in 2024.
-
AI tools boosted individual developer productivity but correlated with a 7.2% decrease in stability metrics (GetDX, 2024).
Tip: Don't just chase elite status. DORA's tagline is "get better at getting better." Track your change failure rate month-over-month. Even moving from 20% to 10% means half as many bugs reaching users, and a measurable reduction in incident costs.
Where do bugs actually come from?
Not all bugs start in code. Capers Jones's research across thousands of projects shows this breakdown of defect origins:
| Defect source | % of total defects |
|---|---|
| Requirements errors | ~20-25% |
| Design errors | ~25-30% |
| Code errors | ~30-35% |
| Documentation errors | ~5-10% |
| Bad-fix injections (fixes that create new bugs) | ~7% |
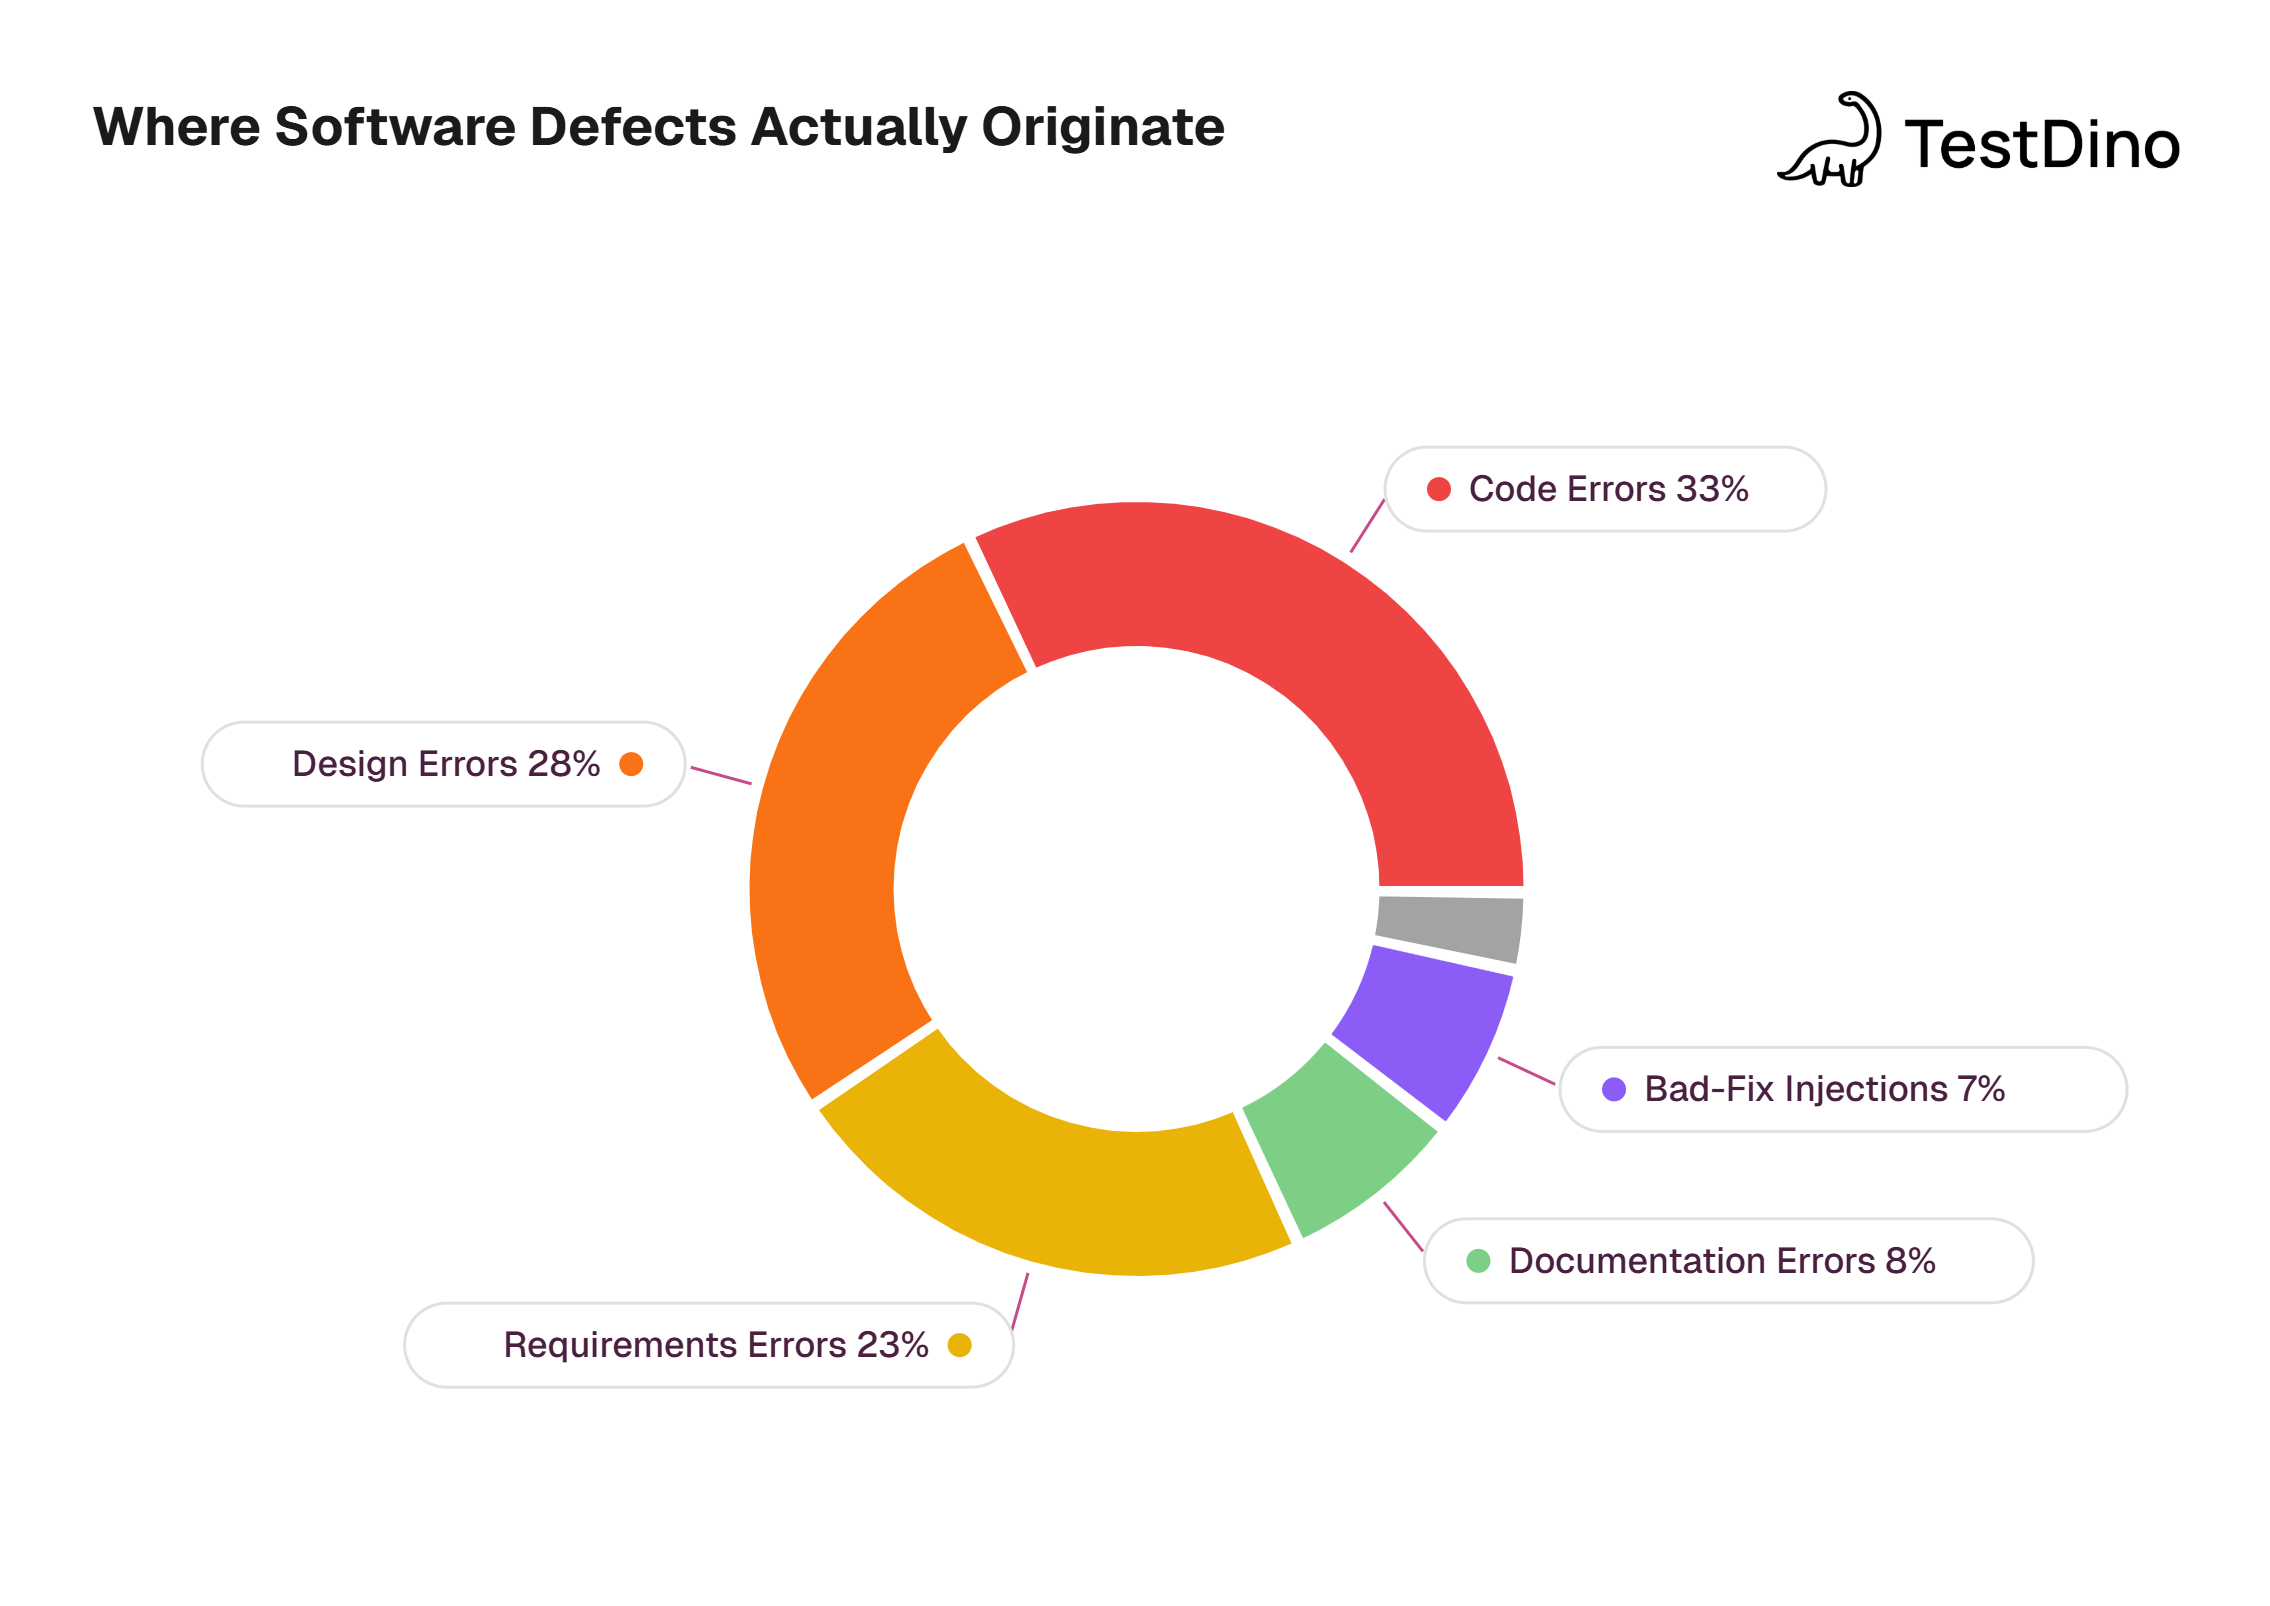
This is important because most teams focus their quality efforts almost entirely on code defects. But code bugs are roughly a third of the picture. Requirements and design bugs, which are the cheapest to fix, make up nearly half of all defects.
Key insight: If your team only runs automated tests, you're covering about 30-35% of your defect sources. Code reviews, requirements reviews, and design reviews catch the rest.
The real cost of a production bug: a real-world example
Numbers are powerful. Real examples are more powerful.
CrowdStrike, July 2024:
-
A single faulty update to CrowdStrike's Falcon security software crashed 8.5 million Windows systems.
-
Fortune 500 companies lost an estimated $5.4 billion in direct losses (Parametrix, 2024).
-
The healthcare sector alone lost $1.94 billion. Banking lost $1.15 billion.
-
Delta Air Lines reported $380 million in losses and over 7,000 cancelled flights (International Banker, 2024).
-
Cyber insurance covered only 10-20% of actual losses.
-
CrowdStrike's own stock dropped over 20%, wiping out $15 billion in shareholder value (CIO, 2024).
That's the cost of a single defect that escaped testing and validation. One bug. Not a complex exploit or a coordinated attack. A configuration error in a content update that wasn't caught before it reached 8.5 million endpoints.
How to measure your own defect escape rate
If you're not tracking escape rate today, here's how to start:
Step 1: Define "escaped"
A defect is "escaped" when someone outside your development and QA process finds it. That includes:
-
Users reporting bugs
-
Production monitoring catching errors
-
Support tickets caused by software issues
-
Incidents triggered by failed deployments
Step 2: Set up tracking
You need two counts:
Internal defects: Bugs caught during code review, CI testing, staging QA, or pre-release testing.
External defects: Bugs found in production within a fixed window (90 days is the standard per Capers Jones; some teams use 30 days).
Step 3: Calculate monthly
Monthly Escape Rate = External defects / (Internal + External) × 100
Step 4: Set a target
Based on the benchmarks above:
-
Starting target: Get below 10% escape rate (above 90% DRE).
-
Intermediate target: Get below 5% escape rate (above 95% DRE).
-
Stretch target: Get below 2% escape rate (above 98% DRE). This requires static analysis + code inspections + automated testing.
How TestDino helps with escape rate tracking
TestDino's AI failure classification automatically categorizes every Playwright test failure as Bug, UI Change, Flaky, or Misc. That separation is the foundation of escape rate tracking.
Here's how:
-
Bug classifications in TestDino show you real defects caught before production. These count toward your "internal defects" number.
-
Flaky test detection strips out the noise. Without separating flaky failures from real bugs, your escape rate calculation is garbage, because you're counting false signals as "caught bugs."
-
Real-time streaming means you see test results as they happen in CI, not hours later. Faster detection = fewer bugs that slip through.
-
Annotations let you tag tests by priority, feature, or owner. That means you can calculate escape rate per feature area, not just overall.
-
CI optimization with rerun-failed ensures that intermittent failures are retested before being marked as passed, reducing the risk of a flaky "pass" hiding a real bug.
-
Code coverage tracking shows which code paths have no tests, making them your highest-risk areas for defect escapes.
Tip: Start tracking escape rate alongside your existing test analytics. The combination of pass/fail data + escape rate gives you a complete picture: not just "are tests running" but "are tests actually catching bugs."
Five ways to reduce bug costs and escape rate
Based on the research and benchmarks covered in this report, here are five concrete actions:
-
Shift quality checks earlier in the SDLC. The IBM cost multiplier data shows that a bug caught in requirements costs 100x less than the same bug in production. Invest in requirements reviews and design reviews. They're cheap and catch 20-25% of defects that originate before anyone writes a line of code.
-
Combine multiple defect removal methods. Testing alone has a ceiling of about 50% DRE. To break through, add static analysis (55-65% DRE) and code inspections (up to 85% DRE). The combination, per Capers Jones, is the only path to 97%+ DRE.
-
Separate flaky tests from real failures. If your test suite has a high false-positive rate, your team ignores test results. That's how bugs escape. Use tools like TestDino's flaky test detection to separate signal from noise.
-
Track escape rate monthly, not annually. Annual escape rate is a lagging indicator. Monthly tracking lets you catch trends early. If the escape rate spikes after a new feature is introduced, you immediately know the test coverage for that area needs work.
-
Use AI to classify and prioritize failures. Manual triage of test failures is slow and inconsistent. AI-powered classification, such as TestDino's AI insights, automatically categorizes failures so your team can focus on real bugs first.
FAQs

Jashn Jain
Developer Advocate