Performance Testing Using Playwright
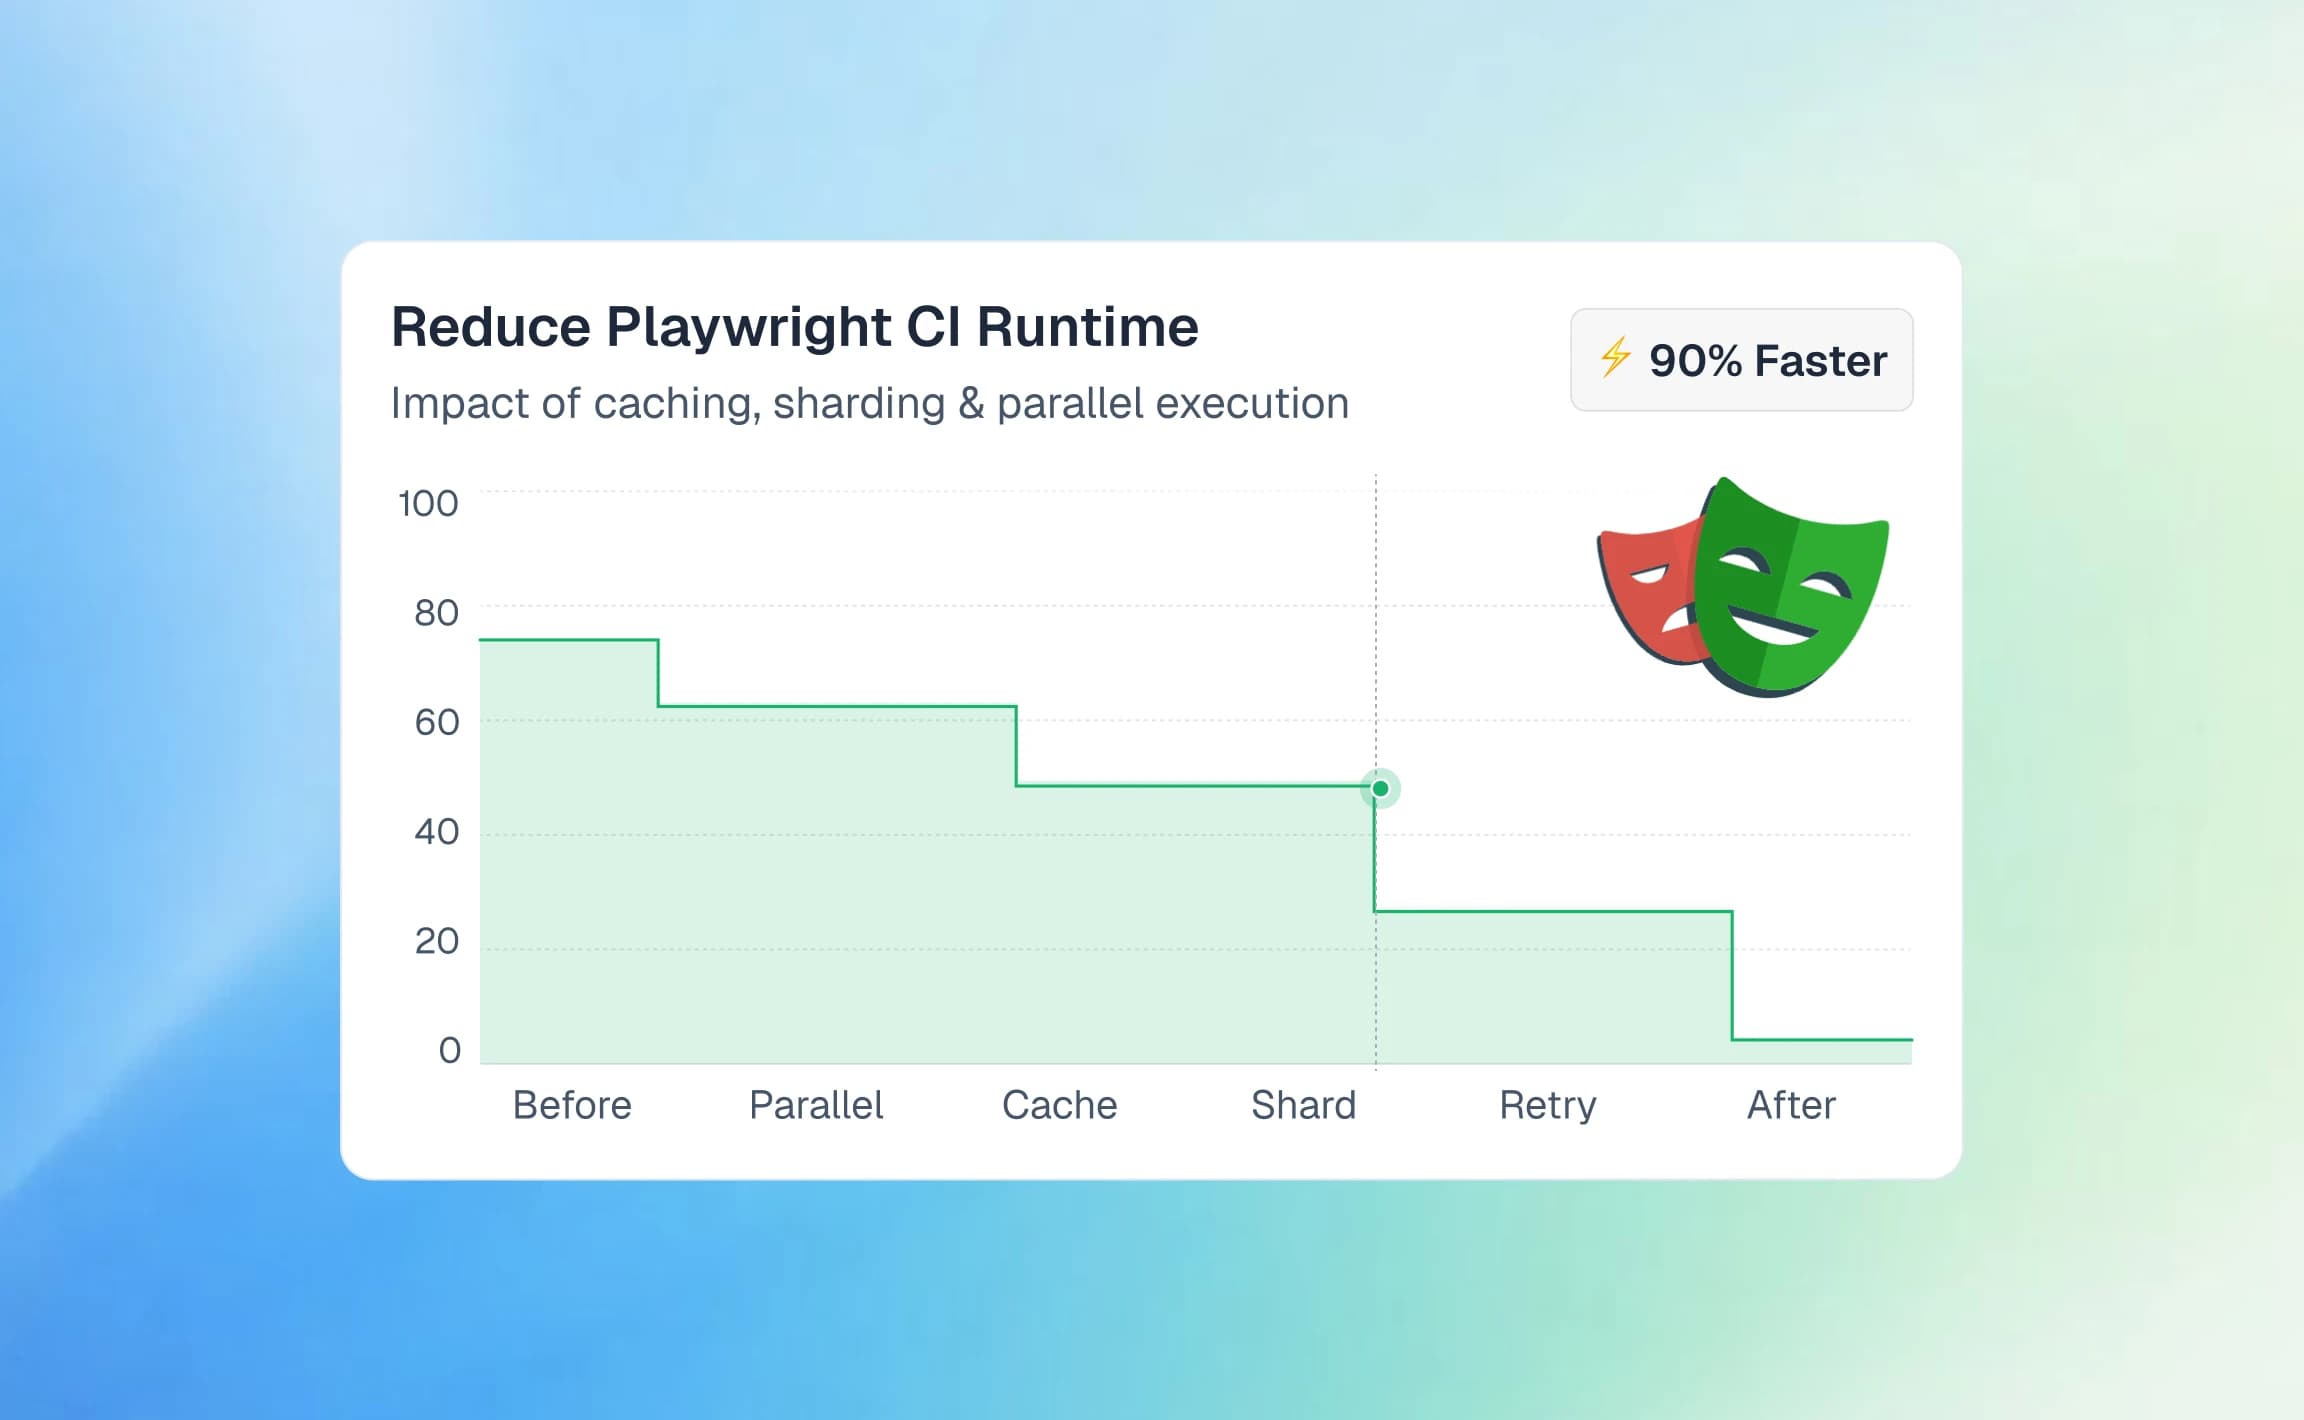
Catch slow pages before users do. This guide covers Playwright performance testing with Core Web Vitals, Lighthouse, tracing, and CI/CD gates.

Teams ship code multiple times a day now. Google uses Core Web Vitals as a ranking signal.
Users leave a page if it takes more than three seconds to load. Performance is no longer optional.
The problem is that most teams catch performance issues after deployment. A slow API, a heavy image, or a render-blocking script sneaks into production and tanks the user experience before anyone notices. In our experience, setting up automated browser performance testing is the single most effective way to catch these regressions early.
If you are wondering how to measure performance in Playwright, this guide has you covered. We will show you exactly how to do performance testing using Playwright so you can measure page load times, track Core Web Vitals, and fail builds automatically when performance drops below your thresholds. You will need Node.js 18+ and Playwright 1.40+ to run all the examples in this Playwright speed testing guide.
What is performance testing using Playwright?
Performance testing checks how fast your application responds to user actions. It covers page load speed, API response times, rendering performance, and resource download behavior.
Playwright is an open-source test automation framework built by Microsoft. It controls Chromium, Firefox, and WebKit browsers through a single API. While Playwright is primarily an end-to-end testing tool, it gives you deep access to browser internals that make it excellent for capturing performance data during real user flows.
Performance testing using Playwright means collecting browser-level timing data (like navigation timings, Core Web Vitals, and resource load durations) during automated test runs to detect speed regressions before they reach production. It is a highly effective approach to frontend performance monitoring.
Performance testing using Playwright means collecting browser-level timing data (navigation timings, Core Web Vitals, resource load durations) during automated test runs to detect speed regressions before they reach production.
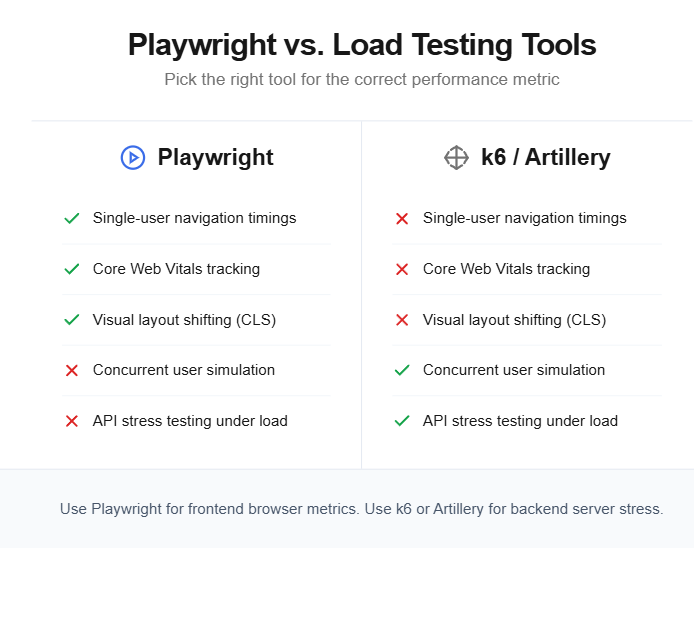
There is an important distinction to make here. Playwright is not a load testing tool like k6, JMeter, or Artillery. Those tools simulate thousands of concurrent users hitting your server.
Playwright runs a single real browser instance and measures how that browser experiences your application. Think of it as a performance gatekeeper, not a load generator.
Here is what Playwright can measure:
- Navigation timings like Time to First Byte (TTFB), DOMContentLoaded, and full page load
- Core Web Vitals like Largest Contentful Paint (LCP), Cumulative Layout Shift (CLS), and Interaction to Next Paint (INP)
- Resource timings for individual CSS, JS, image, and API requests
- Network activity through HAR file recording
- Custom user flow durations using performance.mark() and performance.measure()
The real value is that you can embed these checks directly into your existing Playwright test automation suite. No separate tool, no separate pipeline. You write a functional test and add performance assertions on top of it.
How Playwright captures performance metrics
Playwright gives you three main channels for collecting performance data. Each one serves a different purpose and depth level.
Navigation Timing API
The browser records timestamps for every phase of a page load. Playwright lets you pull these out using page.evaluate() to access the Navigation Timing API. If you want to measure Playwright page load time, this is the simplest way to start.
import { test, expect } from '@playwright/test';
test('measure page load timings', async ({ page }) => {
  await page.goto('https://your-app.com');
  await page.waitForLoadState('load');
  const timings = await page.evaluate(() => {
    const nav = performance.getEntriesByType('navigation')[0];
    return {
      ttfb: nav.responseStart - nav.requestStart,
      domContentLoaded: nav.domContentLoadedEventEnd,
      fullLoad: nav.loadEventEnd,
      domInteractive: nav.domInteractive,
    };
  });
  console.log('TTFB:', timings.ttfb, 'ms');
  console.log('DOM Content Loaded:', timings.domContentLoaded, 'ms');
  console.log('Full Load:', timings.fullLoad, 'ms');
  expect(timings.ttfb).toBeLessThan(800);
  expect(timings.fullLoad).toBeLessThan(3000);
});
The performance.getEntriesByType('navigation') call returns a PerformanceNavigationTiming object. This is a W3C standard API, not something Playwright-specific. Playwright just gives you a way to execute this inside a real browser context.

Tip: Use page.waitForLoadState('networkidle') instead of 'load' if your app makes async API calls after the initial page load. This waits until no network requests have been made for 500ms.
Resource Timing API
If you want to know which specific file is slowing things down, the Resource Timing API breaks it down per asset.
import { test } from '@playwright/test';
test('find slow resources', async ({ page }) => {
  await page.goto('https://your-app.com');
  await page.waitForLoadState('load');
  const slowResources = await page.evaluate(() => {
    return performance
      .getEntriesByType('resource')
      .filter((r) => r.duration > 500)
      .map((r) => ({
        name: r.name.split('/').pop(),
        duration: Math.round(r.duration),
        type: r.initiatorType,
      }));
  });
  console.table(slowResources);
});
This tells you exactly which CSS file, JS bundle, or image took more than 500ms to download.
Chrome DevTools Protocol (CDP)
For Chromium-based browsers, Playwright supports direct CDP access. This opens up CPU profiling, JavaScript execution metrics, and long-task detection.
import { test } from '@playwright/test';
test('collect CDP performance metrics', async ({ page }) => {
  const client = await page.context().newCDPSession(page);
  await client.send('Performance.enable');
  await page.goto('https://your-app.com');
  await page.waitForLoadState('load');
  const { metrics } = await client.send('Performance.getMetrics');
  const jsHeapSize = metrics.find((m) => m.name === 'JSHeapUsedSize');
  const domNodes = metrics.find((m) => m.name === 'Nodes');
  const layoutCount = metrics.find((m) => m.name === 'LayoutCount');
  console.log('JS Heap:', Math.round(jsHeapSize.value / 1024 / 1024), 'MB');
  console.log('DOM Nodes:', domNodes.value);
  console.log('Layout Count:', layoutCount.value);
});
Note: CDP sessions only work with Chromium. If you run tests against Firefox or WebKit, stick with the Navigation and Resource Timing APIs. Those are cross-browser standards.
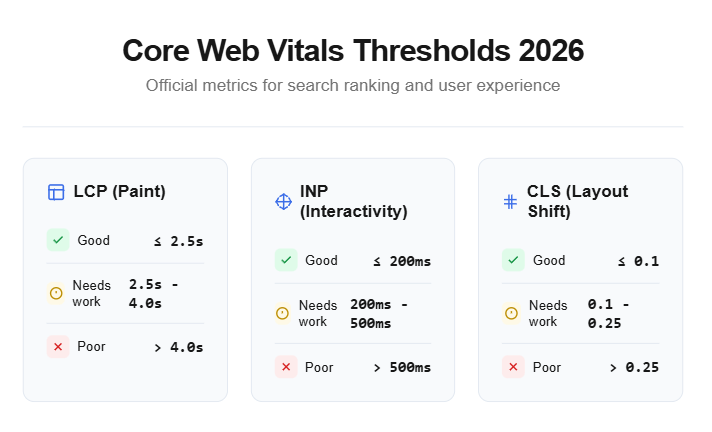
Measuring Core Web Vitals with Playwright
Measuring Playwright Core Web Vitals gives you the three metrics that directly affect your search ranking. Here are the official thresholds from web.dev:
Unlike navigation timings, Core Web Vitals are event streams. You cannot just call getEntriesByType() and read them.
You need to inject a PerformanceObserver before the page starts loading, collect the values as they arrive, and then read them after your test actions. Alternatively, you can inject the official web-vitals npm library via addInitScript, but the vanilla PerformanceObserver approach shown below works without external dependencies.
Here is how to set that up:
import { test, expect } from '@playwright/test';
test('measure Core Web Vitals', async ({ page }) => {
  // Inject observer before navigation
  await page.addInitScript(() => {
    window.__vitals = { LCP: 0, CLS: 0 };
    new PerformanceObserver((list) => {
      for (const entry of list.getEntries()) {
        window.__vitals.LCP = entry.startTime;
} }).observe({ type: 'largest-contentful-paint', buffered: true });
new PerformanceObserver((list) => {
for (const entry of list.getEntries()) {
if (!entry.hadRecentInput) {
window.__vitals.CLS += entry.value;
}
}
}).observe({ type: 'layout-shift', buffered: true });
});
await page.goto('https://your-app.com');
await page.waitForLoadState('networkidle');
// Wait a bit for late layout shifts
await page.waitForTimeout(2000);
const vitals = await page.evaluate(() => window.__vitals);
console.log('LCP:', vitals.LCP, 'ms');
console.log('CLS:', vitals.CLS);
expect(vitals.LCP).toBeLessThan(2500);
expect(vitals.CLS).toBeLessThan(0.1);
});addInitScript() runs your JavaScript before any page script executes. This guarantees you catch every layout shift and every contentful paint event from the very first frame.
The hadRecentInput check on layout shifts filters out shifts caused by user interactions (like clicking a button that expands a section). Google ignores those when calculating CLS. Your test should do the same.
Measuring custom user flow performance
Sometimes you care about the performance of a specific user action, not just the page load. Playwright lets you use the performance.mark() and performance.measure() APIs to time any flow.
import { test, expect } from '@playwright/test';
test('measure search flow duration', async ({ page }) => {
await page.goto('https://your-app.com');
await page.evaluate(() => performance.mark('search-start'));
await page.fill('#search-input', 'playwright performance');
await page.click('#search-button');
await page.waitForSelector('.search-results');
await page.evaluate(() => {
performance.mark('search-end');
performance.measure('search-flow', 'search-start', 'search-end');
});
const duration = await page.evaluate(
() => performance.getEntriesByName('search-flow')[0].duration
);
console.log('Search flow took:', duration, 'ms');
expect(duration).toBeLessThan(1500);
});This approach works well for measuring checkout flows, form submissions, filter interactions, or any multi-step user journey. You can use these same patterns when debugging slow tests to figure out which part of a flow takes the most time.
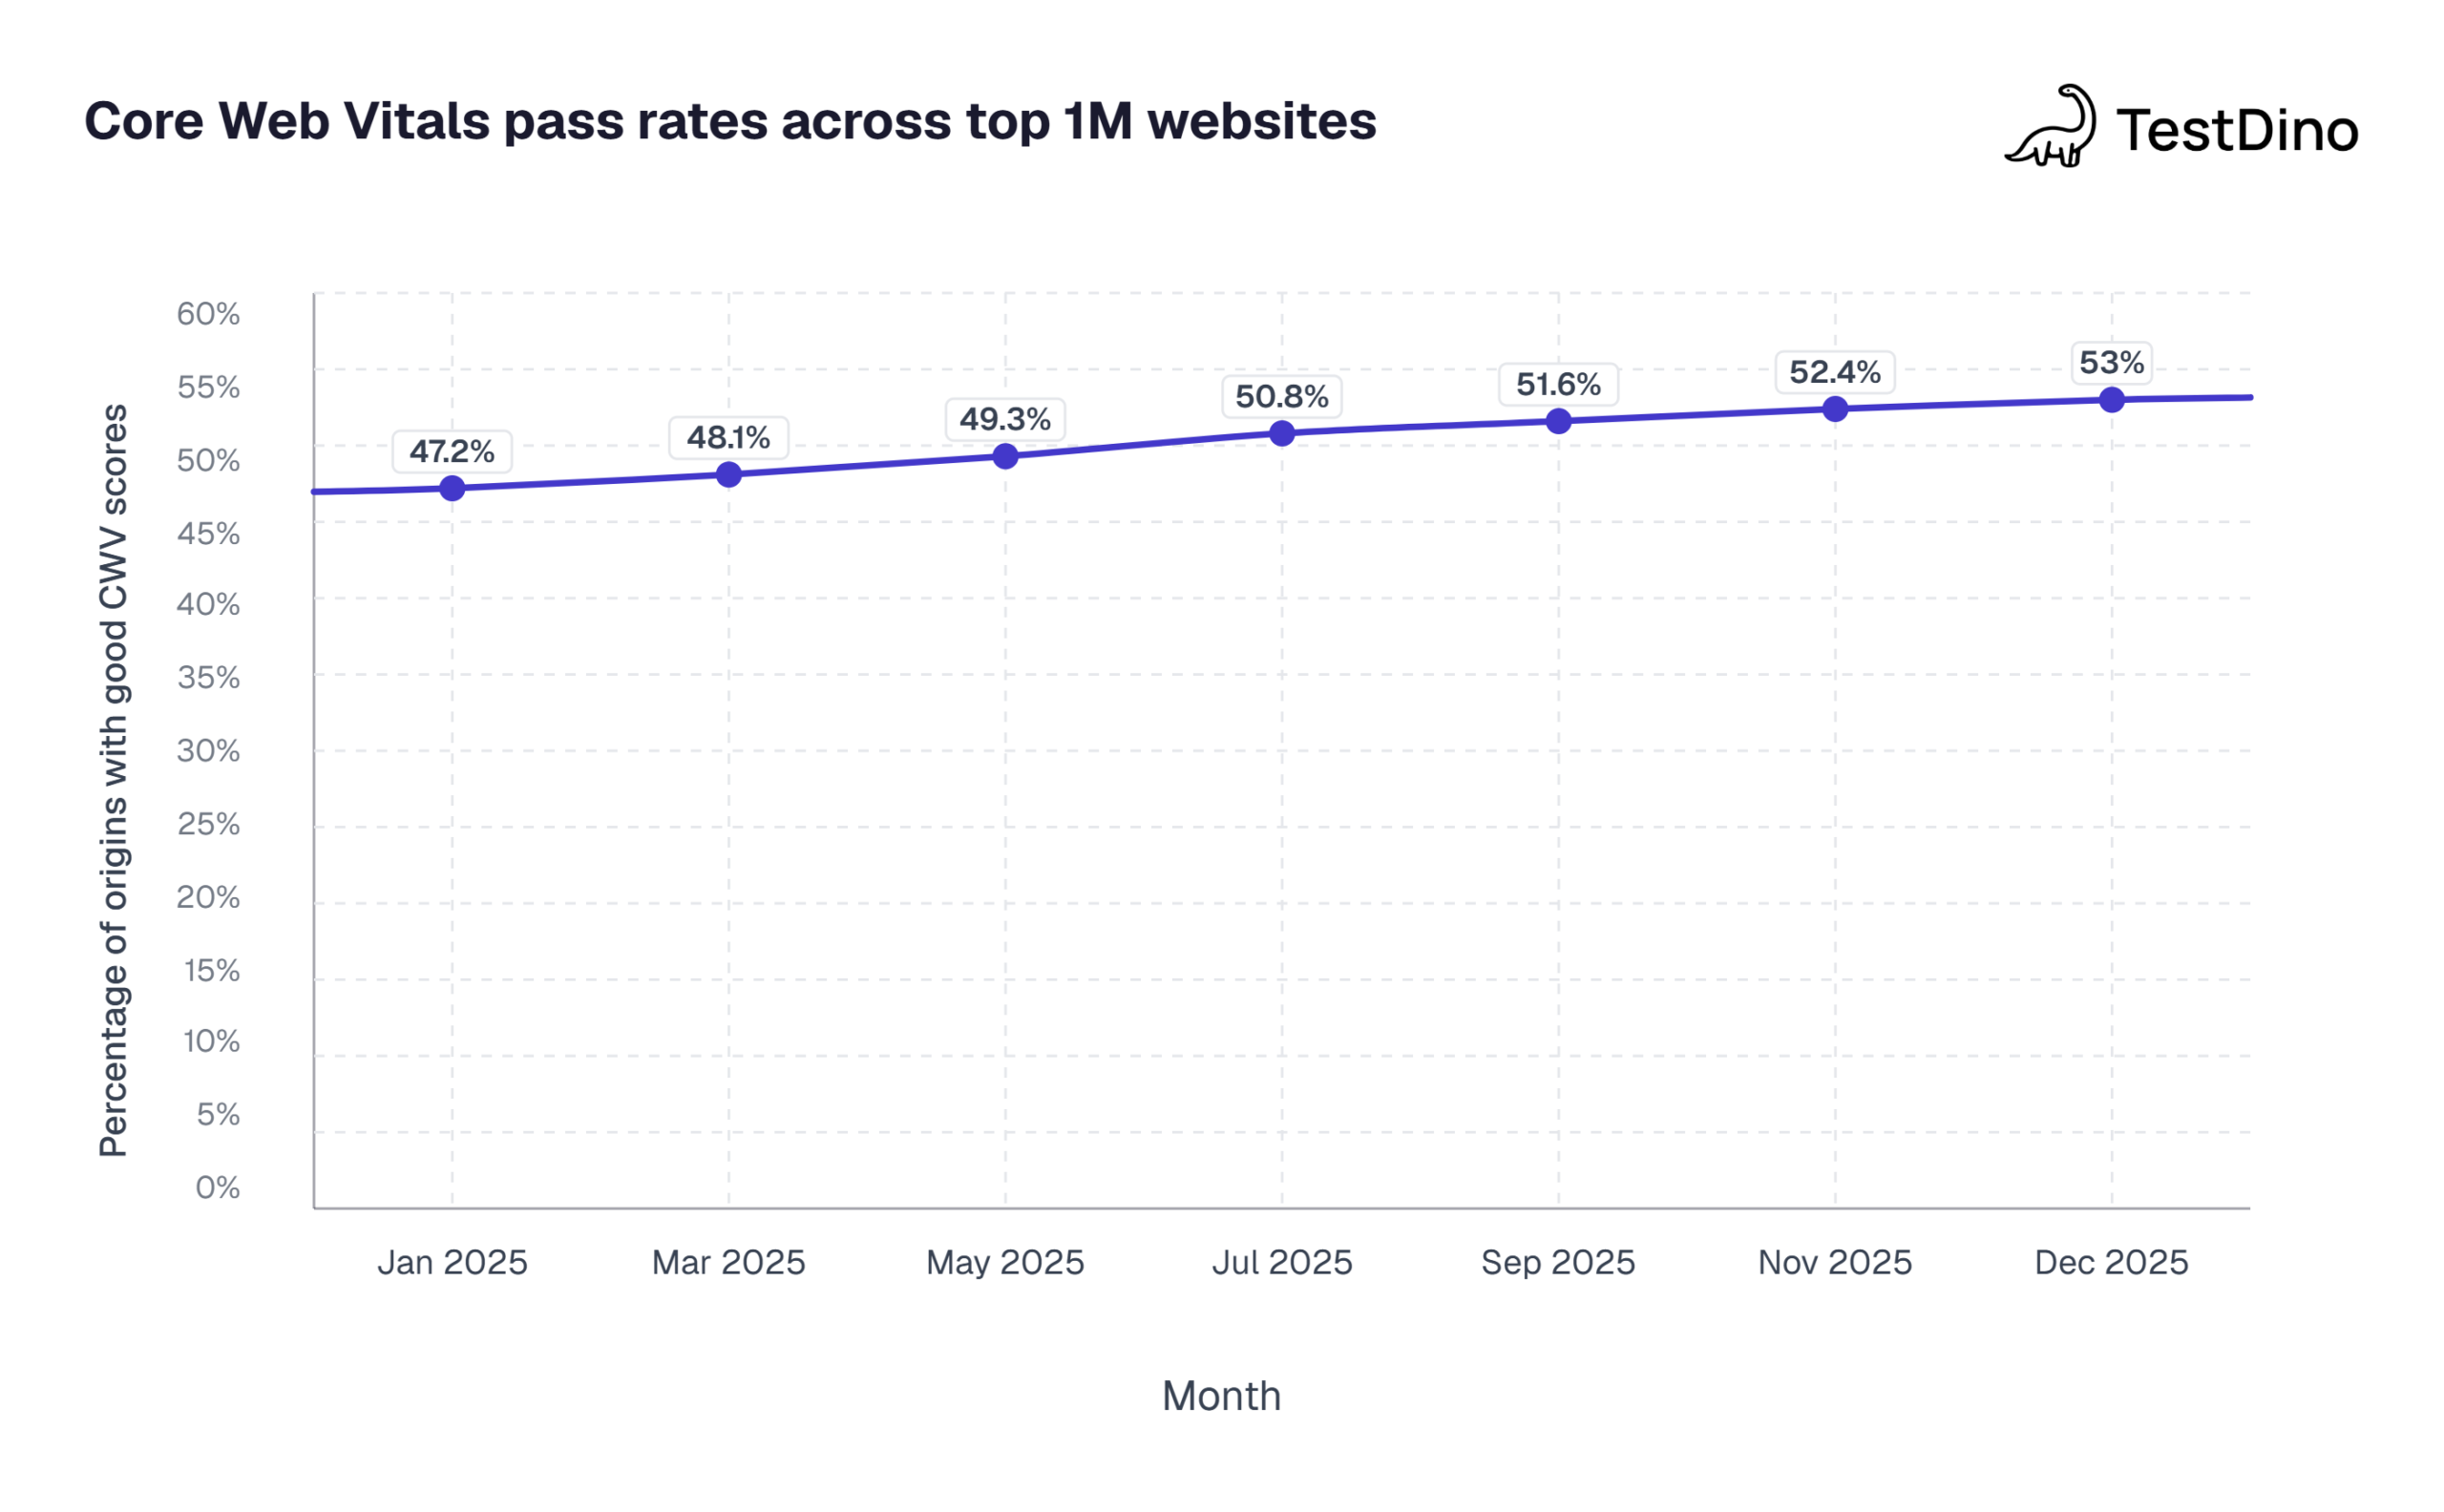
Source: Chrome User Experience Report (CrUX) BigQuery public dataset, Almanac 2025
When we analyze this CrUX trend across our client projects, the takeaway is clear: mobile performance is stagnating while desktop improves. This is exactly why automating these checks is so critical for modern development teams.
Running Lighthouse audits inside Playwright
If you are expanding your performance testing using Playwright, you should consider Lighthouse. The Navigation Timing and Core Web Vitals approaches give you raw numbers.
Lighthouse goes further by scoring your page across Performance, Accessibility, Best Practices, and SEO categories. You can run Lighthouse audits programmatically inside your Playwright tests using the official Playwright Chrome DevTools protocol (CDP) API.
The approach works like this:
- Launch Chromium with a remote debugging port
- Use Playwright to navigate to the page you want to audit (including login, navigation, or any prerequisite steps)
- Connect Lighthouse to the same debugging port
- Run the audit and assert on the scores
import { chromium } from '@playwright/test';
import lighthouse from 'lighthouse';
async function runLighthouseAudit() {
const browser = await chromium.launch({
args: ['--remote-debugging-port=9222'],
});
const page = await browser.newPage();
// Do any setup: login, navigate, etc.
await page.goto('https://your-app.com/dashboard');
await page.waitForLoadState('networkidle');
// Run Lighthouse on the current page
const result = await lighthouse('https://your-app.com/dashboard', {
port: 9222,
output: 'json',
onlyCategories: ['performance'],
});
const perfScore = result.lhr.categories.performance.score * 100;
const lcp = result.lhr.audits['largest-contentful-paint'].numericValue;
const tbt = result.lhr.audits['total-blocking-time'].numericValue;
console.log('Performance Score:', perfScore);
console.log('LCP:', lcp, 'ms');
console.log('Total Blocking Time:', tbt, 'ms');
await browser.close();
if (perfScore < 80) {
throw new Error(`Performance score ${perfScore} is below threshold of 80`);
}
}
runLighthouseAudit();Tip: Lighthouse audits are CPU-intensive. Do not run them inside a load test or on every single test. Run them as a separate CI job or tag them with a specific annotation so you can trigger them selectively. Check the Playwright best practices guide for structuring your test suite efficiently.
There is also the playwright-lighthouse npm package that wraps this flow into a simpler API. It is useful if you want to avoid managing the debugging port yourself.
npm install playwright-lighthouseThe key advantage of running Lighthouse through Playwright is context. A standard Lighthouse run hits a cold, unauthenticated page.
With Playwright, you can log in first, navigate to a deep page, fill out a form, or reach any specific state and then audit it. That is much closer to what real users experience.
Network throttling and device emulation
A robust setup for performance testing using Playwright must account for different network conditions. Your app might feel fast on a MacBook connected to fiber internet.
But a user on a 3G connection in a rural area will have a very different experience. Playwright lets you simulate slow networks and constrained devices using the Chrome DevTools Protocol.
Simulating slow network conditions
import { test, expect } from '@playwright/test';
test('measure load time on slow 3G', async ({ page }) => {
const client = await page.context().newCDPSession(page);
await client.send('Network.enable');
await client.send('Network.emulateNetworkConditions', {
offline: false,
downloadThroughput: (750 * 1024) / 8, // 750 Kbps
uploadThroughput: (250 * 1024) / 8, // 250 Kbps
latency: 400, // 400ms RTT
});
const startTime = Date.now();
await page.goto('https://your-app.com');
await page.waitForLoadState('load');
const loadTime = Date.now() - startTime;
console.log('Load time on Slow 3G:', loadTime, 'ms');
expect(loadTime).toBeLessThan(8000);
});The downloadThroughput value is in bytes per second. To convert from Kbps, multiply by 1024 and divide by 8. The latency value adds a round-trip delay in milliseconds to every network request.
Common network presets
Here are the standard network conditions you can test against:
| Profile | Download (Kbps) | Upload (Kbps) | Latency (ms) |
|---|---|---|---|
| Slow 3G | 750 | 250 | 400 |
| Fast 3G | 1500 | 750 | 150 |
| 4G / LTE | 4000 | 3000 | 50 |
| WiFi (average) | 30000 | 15000 | 10 |
Device emulation
Playwright has built-in device profiles. You can combine network throttling with viewport and user-agent emulation to simulate a complete mobile experience.
import { test, devices, expect } from '@playwright/test';
const iPhone = devices['iPhone 14'];
test.use({ ...iPhone });
test('measure mobile performance', async ({ page }) => {
const client = await page.context().newCDPSession(page);
await client.send('Emulation.setCPUThrottlingRate', { rate: 4 }); // 4x slowdown
await page.goto('https://your-app.com');
await page.waitForLoadState('load');
const timings = await page.evaluate(() => {
const nav = performance.getEntriesByType('navigation')[0];
return {
ttfb: nav.responseStart - nav.requestStart,
fullLoad: nav.loadEventEnd,
};
});
console.log('Mobile TTFB:', timings.ttfb, 'ms');
console.log('Mobile Full Load:', timings.fullLoad, 'ms');
expect(timings.fullLoad).toBeLessThan(5000);
});CPU throttling with setCPUThrottlingRate simulates a slower processor. A rate of 4 means the CPU runs at 1/4 of its normal speed. This is useful for browser testing across different performance tiers.
Recording and analyzing HAR files
Another powerful technique for performance testing using Playwright is HAR file analysis. A HAR (HTTP Archive) file captures every network request and response during a page load.
It is like a detailed receipt for all the data your browser downloads. HAR files are extremely useful for finding oversized API responses, redundant requests, and slow endpoints.
Recording a HAR file
import { test } from '@playwright/test';
test('record HAR file for analysis', async ({ browser }) => {
const context = await browser.newContext({
recordHar: {
path: 'test-results/network-trace.har',
mode: 'minimal',
},
});
const page = await context.newPage();
await page.goto('https://your-app.com');
await page.waitForLoadState('networkidle');
// Perform user actions you want to capture
await page.click('nav >> text=Products');
await page.waitForLoadState('networkidle');
await context.close(); // HAR file is written on context close
});You can also record HAR files directly from the command line without writing any test code:
npx playwright codegen --save-har=network-trace.har https://your-app.comReplaying HAR for consistent tests
Once you have a HAR file, you can use it to mock network responses. This is helpful when you want to isolate frontend performance from backend variability.
import { test, expect } from '@playwright/test';
test('measure frontend perf with mocked API', async ({ page }) => {
await page.routeFromHAR('test-results/network-trace.har', {
url: '**/api/**',
update: false,
});
const startTime = Date.now();
await page.goto('https://your-app.com');
await page.waitForLoadState('load');
const loadTime = Date.now() - startTime;
console.log('Frontend-only load time:', loadTime, 'ms');
});When API responses are mocked, you see exactly how fast your frontend renders. If the load time is still slow with instant API responses, the bottleneck is in your frontend code. This technique pairs well with the Playwright trace viewer for visual debugging.
Using tracing for performance debugging
Playwright's built-in tracing captures screenshots, DOM snapshots, and network requests in a timeline view. It works like a flight recorder for your test.
import { test } from '@playwright/test';
test('trace performance bottleneck', async ({ page, context }) => {
await context.tracing.start({
screenshots: true,
snapshots: true,
});
await page.goto('https://your-app.com');
await page.waitForLoadState('load');
await page.click('#load-dashboard');
await page.waitForSelector('.dashboard-loaded');
await context.tracing.stop({ path: 'test-results/perf-trace.zip' });
});Open the trace with:
npx playwright show-trace test-results/perf-trace.zipThe trace viewer shows you a timeline of every action, every network request, and every DOM change. You can pinpoint exactly when a slow request started, how long it took, and what happened in the UI during that wait. For a detailed walkthrough, check the Playwright debugging guide.
Adding performance gates in CI/CD
When doing performance testing using Playwright, running tests locally is a good start. But the real impact comes when you enforce performance budgets in your CI/CD pipeline. If a pull request makes the page slower, the build should fail.
Setting up performance assertions
Create a dedicated test file for performance gates:
import { test, expect } from '@playwright/test';
const PERF_BUDGETS = {
ttfb: 800,
fullLoad: 3000,
lcp: 2500,
cls: 0.1,
};
test.describe('performance gates', () => {
test('homepage meets performance budget', async ({ page }) => {
await page.addInitScript(() => {
window.__vitals = { LCP: 0, CLS: 0 };
new PerformanceObserver((list) => {
for (const entry of list.getEntries()) {
window.__vitals.LCP = entry.startTime;
}
    }).observe({ type: 'largest-contentful-paint', buffered: true });
    new PerformanceObserver((list) => {
      for (const entry of list.getEntries()) {
        if (!entry.hadRecentInput) {
          window.__vitals.CLS += entry.value;
        }
      }
    }).observe({ type: 'layout-shift', buffered: true });
  });
  await page.goto('https://your-app.com');
  await page.waitForLoadState('networkidle');
await page.waitForTimeout(2000);
    const navTimings = await page.evaluate(() => {
      const nav = performance.getEntriesByType('navigation')[0];
      return {
        ttfb: nav.responseStart - nav.requestStart,
        fullLoad: nav.loadEventEnd,
      };
    });
    const vitals = await page.evaluate(() => window.__vitals);
    expect(navTimings.ttfb).toBeLessThan(PERF_BUDGETS.ttfb);
    expect(navTimings.fullLoad).toBeLessThan(PERF_BUDGETS.fullLoad);
    expect(vitals.LCP).toBeLessThan(PERF_BUDGETS.lcp);
    expect(vitals.CLS).toBeLessThan(PERF_BUDGETS.cls);
  });
});
Running in GitHub Actions
Add a performance test step to your Playwright in GitHub Actions workflow:
name: Performance Tests
on:
  pull_request:
    branches: [main]
jobs:
  perf-test:
    runs-on: ubuntu-latest
    steps:
      - uses: actions/checkout@v4
      - uses: actions/setup-node@v4
        with:
          node-version: 20
      - name: Install dependencies
        run: npm ci
      - name: Install Playwright browsers
        run: npx playwright install --with-deps chromium
      - name: Run performance tests
        run: npx playwright test perf-gates.spec.ts --project=chromium
      - name: Upload trace on failure
        if: failure()
        uses: actions/upload-artifact@v4
        with:
          name: perf-traces
          path: test-results/
Note: Run performance tests only against Chromium in CI. Core Web Vitals are Chrome-specific metrics, and CDP features like CPU throttling only work in Chromium. Use a dedicated CI runner with consistent hardware to reduce measurement noise.
Tracking performance over time
Single-run performance numbers can be noisy. A CI runner might be under heavy load during one run and idle during another. To get reliable data:
- Run performance tests 3 to 5 times and use the median value
- Track results over time to spot trends rather than individual failures
- Use test reporting tools that visualize performance trends across builds
- Set up test automation analytics dashboards to monitor regression patterns
This is where tools like TestDino become useful. Instead of just pass/fail results, you get historical trend data across test runs. You can see whether your LCP has been creeping up over the last 20 builds and catch a slow regression before it crosses the threshold.
Common mistakes and best practices
Performance testing using Playwright is straightforward to set up, but there are common pitfalls that produce unreliable or misleading results.
Mistakes to avoid
- Running on inconsistent environments: Local machines have variable CPU, memory, and network conditions. Always run performance tests on dedicated CI hardware with fixed specs.
- Not warming up the page: The first page load after a browser launch is always slower (cold cache, no DNS cache, no connection reuse). Run a warm-up navigation before your actual measurement.
- Ignoring flaky measurements: Performance numbers fluctuate. A single test failure does not necessarily mean your app got slower. Use averages across multiple runs. Read about flaky tests and how to handle intermittent failures.
- Testing with dev tools open: Browser DevTools consume CPU and affect rendering timings. Always run performance tests in headless mode.
- Confusing Playwright with load testing: Playwright measures single-user browser performance. It does not simulate concurrent users or test server capacity. For load testing, use tools like k6 or Artillery.
Best practices checklist
When implementing Playwright performance testing across your organization, follow this Playwright automation checklist alongside these performance-specific tips:
- Use headless mode for all performance tests. Headed mode introduces rendering overhead
- Set a fixed viewport size (e.g., 1280x720) so layout calculations are consistent
- Disable animations in your test config to reduce timing variability
- Mock external services that are not under your control (analytics, third-party scripts)
- Separate performance tests from functional tests using Playwright fixtures or test tags
- Run against a staging environment that mirrors production hardware and data volume
- Assert on specific metrics (TTFB < 800ms) not vague ones ("page should be fast")
- Store results in a time-series format so you can spot trends over weeks and months
Tip: If your test suite runs too slowly because of performance tests, use Playwright's --grep flag to run only performance tests on a schedule (e.g., nightly) instead of on every commit. See how to optimize Playwright workers for faster execution.
Playwright vs. dedicated performance testing tools
Understanding when to use Playwright for performance testing and when to reach for specialized tools is critical.
| Capability | Playwright | Lighthouse | k6 | Artillery |
|---|---|---|---|---|
| Single-user page timings | ||||
| Core Web Vitals | Manual setup | Built-in | Plugin | |
| Concurrent user simulation | ||||
| API load testing | Basic | |||
| Real browser rendering | With plugin | |||
| CI/CD integration | Native | CLI/Node | CLI | CLI |
| Cross-browser support | Chromium, FF, WK | Chromium only | N/A | Chromium only |
The ideal setup is to use Playwright for frontend performance testing during CI/CD and a tool like k6 for backend load testing. Combine them with Playwright CI/CD integrations for a complete performance safety net.
Conclusion
Performance testing using Playwright turns your existing test suite into a performance monitoring system. Instead of relying on separate tools or manual audits, you embed performance checks directly into the tests you are already running.
To recap, effective Playwright performance testing requires four key pillars:
- Raw Timings: Use the Navigation Timing API to measure basic page load metrics like TTFB.
- User Experience: Track Core Web Vitals with PerformanceObserver for Google-relevant metrics.
- Audits & Emulation: Add Lighthouse integration for comprehensive audits, and use network throttling and HAR recording to simulate real-world conditions.
- Automation: Enforce everything with strict performance budgets in your CI/CD pipeline.
The code examples in this guide give you a working foundation. Copy them, adjust the thresholds to match your SLAs, and plug them into your existing Playwright reporting setup. Every slow page you catch before deployment is a user you did not lose.
FAQs

Ayush Mania
Forward Development Engineer