Results in a dashboard, not buried in CI logs.
TestDino connects to GitHub Actions, GitLab CI, Azure DevOps, and TeamCity with copy-paste configs so every run feeds dashboards automatically.

Test reporting should take
5 minutes, not 5 hours
Results live in CI logs that expire, artifacts nobody downloads, and output nobody reads.

CI logs are write-only
Test results exist in a CI log nobody reads unless something breaks. No search, no filtering, no trending. Finding a failure from three days ago means scrolling pages of terminal output.
Every developer debugs from scratch
When a test fails, the developer opens the job log, scrolls to the failure, and copies the error message. They have no context about whether this test has failed before or what changed.
No historical visibility across runs
You cannot answer basic questions. What is our pass rate trend? Which tests fail most often? Is the suite getting slower? The data exists in individual runs but there is no aggregation layer.
GitHub Actions and GitLab CI need different configs
Your team uses different CI platforms across projects. Setting up test reporting for each means learning separate integration patterns, managing separate secrets, and maintaining separate workflows.
How CI integration works
Copy the workflow snippet, add your API key as a secret, and your next pipeline run starts reporting to TestDino.
Add the TestDino reporter
Two lines in your Playwright config file. The same setup works for both GitHub Actions and GitLab CI. Results start flowing immediately.

reporter: [
  ['html', { outputDir: './playwright-report' }],
  ['json', { outputFile: './playwright-report/report.json' }],
]
npx tdpw upload <report-dir> --token=$TESTDINO_API_KEY
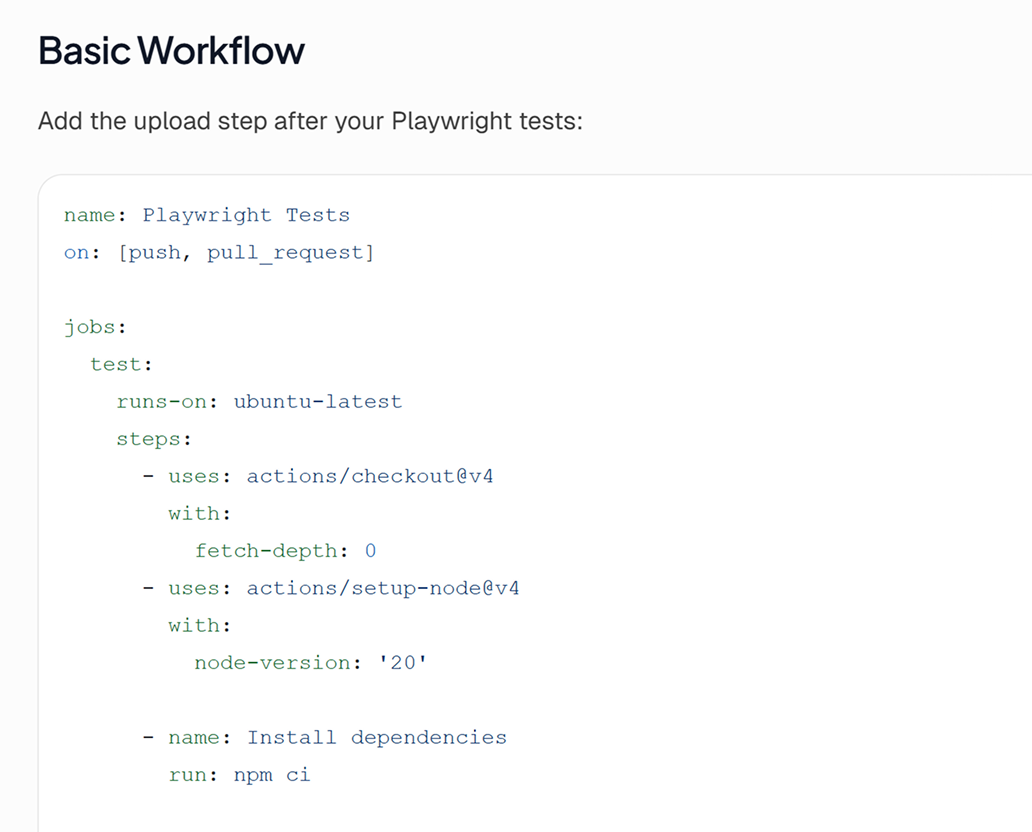
Copy the workflow config
Add your TESTDINO_KEY as a CI secret, then drop a ready-made config into your pipeline. GitHub Actions gets a workflow YAML, GitLab CI gets a pipeline config. Your next push triggers reporting automatically.

Run tests and see results
Your existing npx playwright test command stays the same. The reporter streams data during the run, so even if a job crashes midway, you still get partial results for completed tests.
Let your AI agent debug failures for you
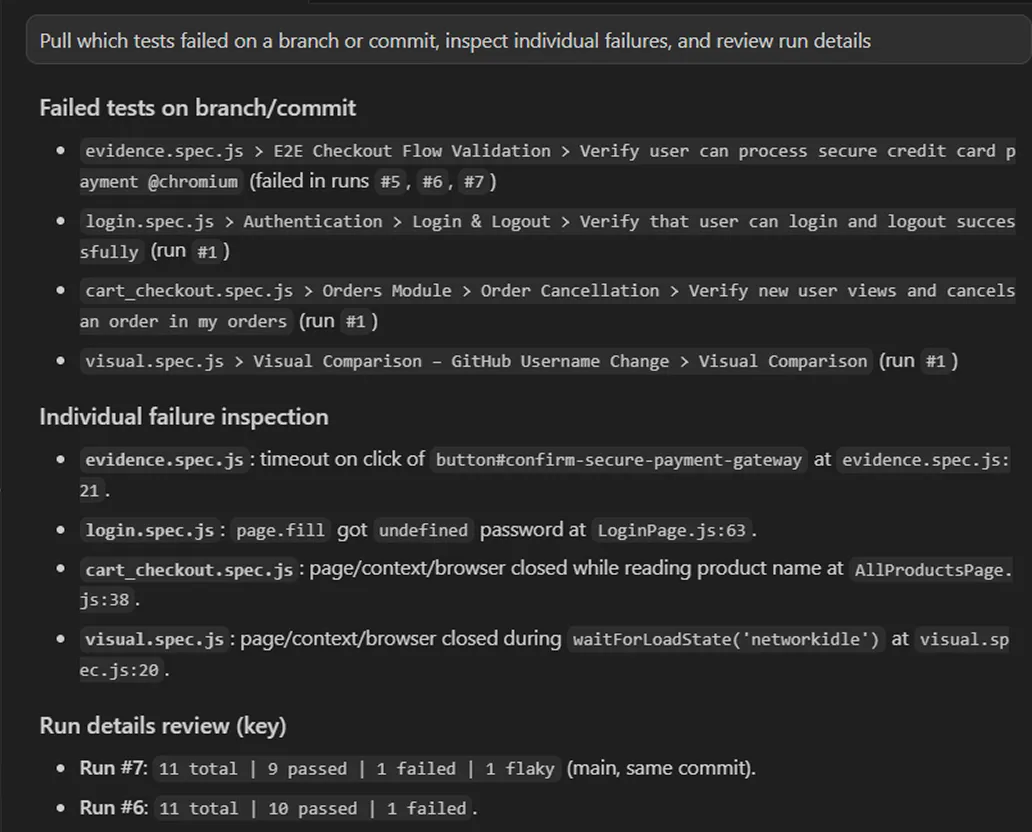
Connect TestDino's MCP server to Cursor, Claude Code, or Copilot. Your AI agent checks which tests failed on a branch or commit, inspects each failure, and suggests fixes without you ever opening the dashboard.
Teams love what we built
See why developers choose TestDino to ship faster and debug smarter
We were on the default Playwright reporter, and it was tedious to dig through; half a day gone just triaging failures. The TestDino MCP changed that for us. I now run through the failures in minutes instead of devoting half a day to it, and pulling the latest runs straight through the MCP sped up bug triage drastically. AI failure classification and Slack reports do the rest. It's saved us weeks.
To triage failures, down from half a day
Saved across the team

Migrating to TestDino from Currents was an easy decision. The features are stronger, the cost is lower, and the interface makes debugging far less painful. Flaky test detection and AI failure classification have simplified debugging and reduced our CI costs by cutting down reruns and noisy failures.
Reduction in CI costs
Less time triaging failures

Over 30 flaky tests and no structured way to track them, just CI artifacts and morning guesswork. TestDino's "Most Flaky Tests" feature broke this pattern. We can see failure trends now and pull up video recordings of exactly what went wrong. The TestDino MCP server is the magic piece on top, I ask my Claude agent about a failure and it pulls full context from TestDino without switching tabs. We went from 30-something flaky tests down to 3 or 4.
Fewer flaky test reruns
Faster failure triage

Structured test reporting
for every CI platform
Structured dashboards instead of terminal output
CI logs are unstructured text. TestDino turns every test result into a searchable, filterable data point in a real dashboard.
Cross-run trend analysis
Results aggregate across runs, branches, and pipelines showing pass rate trends, failure frequency, duration regressions, and flaky patterns.
GitHub, GitLab, Azure DevOps, and TeamCity
GitHub and GitLab post PR/MR comments with quality gates. TeamCity installs as a Recipe plugin. Azure DevOps provides a read-only test run view inside your pipeline.
Failure context with history
Beyond the error message, you see when the test last passed, how often it fails, whether it's flaky, and video links.
Team-wide visibility
Dashboards are accessible to QA leads, managers, and anyone who needs test health visibility. No repo access or CI familiarity required.
Automatic metadata capture
Git branch, commit SHA, CI job ID, shard number, and run timestamp captured automatically. No environment variables or tags needed.
What you get with CI integration
Same CI pipeline, same tests, completely different debugging experience. The data was always there, TestDino just makes it accessible.
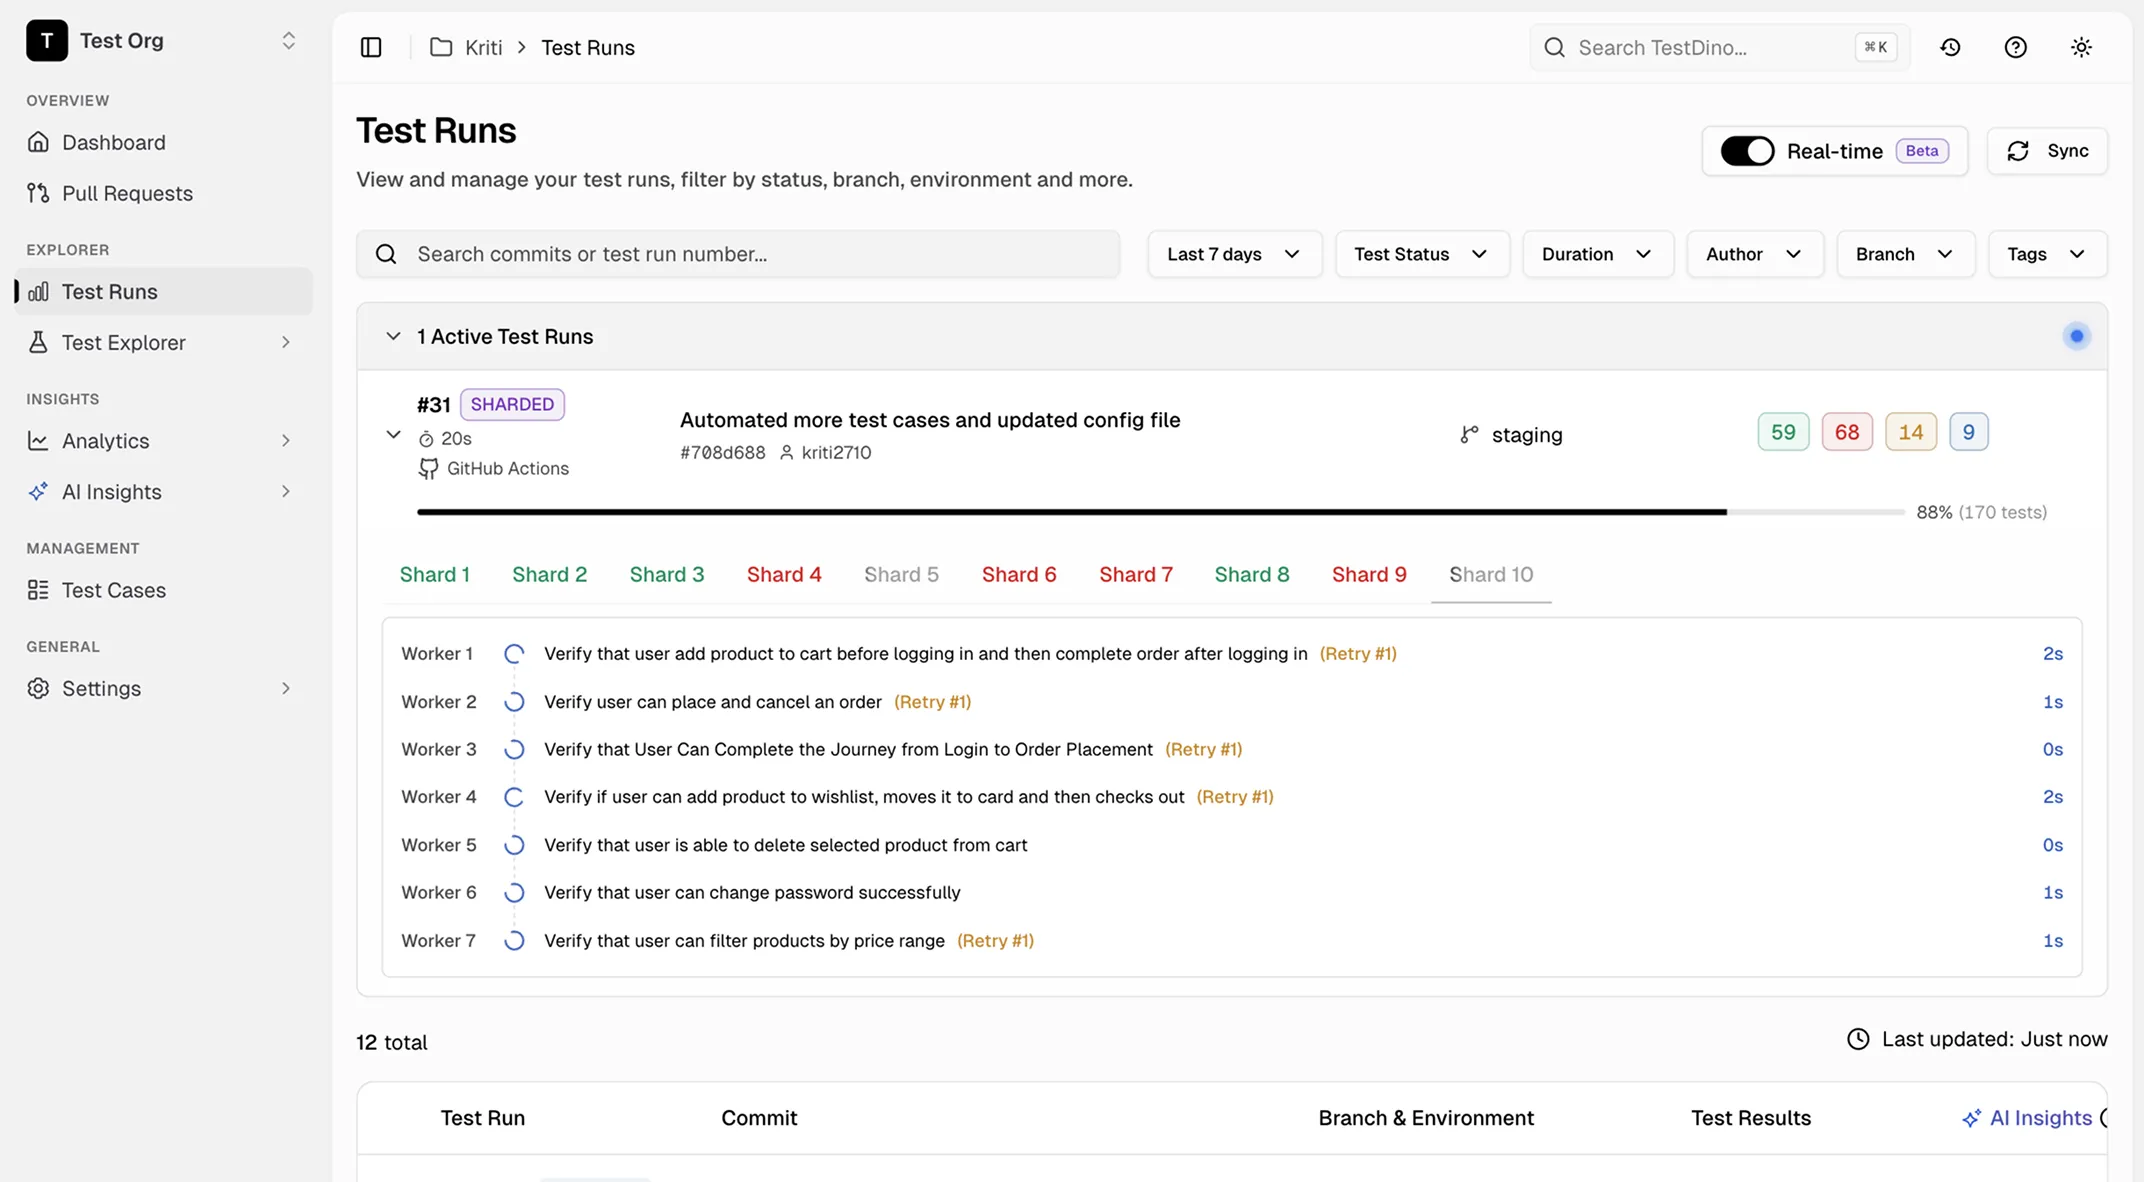
Real-time result ingestion
Results appear in TestDino within seconds of your CI job completing. The reporter streams data during the run, so even if the job crashes midway, you still get partial results for tests that already finished.
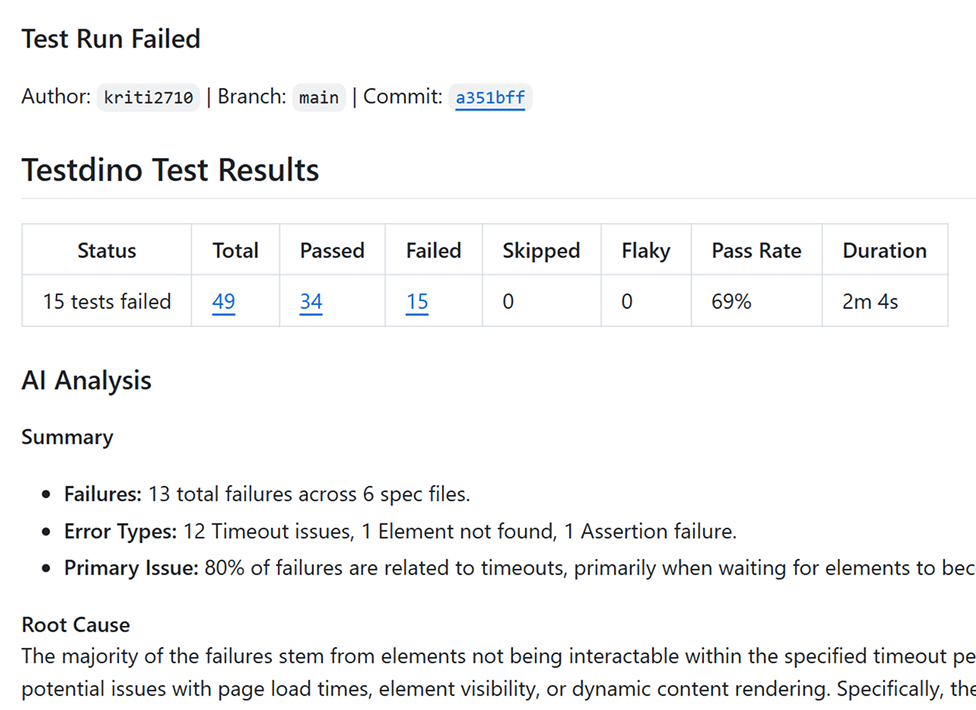
AI-generated PR comments and quality gates
TestDino posts AI-generated test summaries with root cause analysis on every failed run. The summary includes failure counts by error type, primary issue classification, and actionable root cause so your team triages without opening logs.
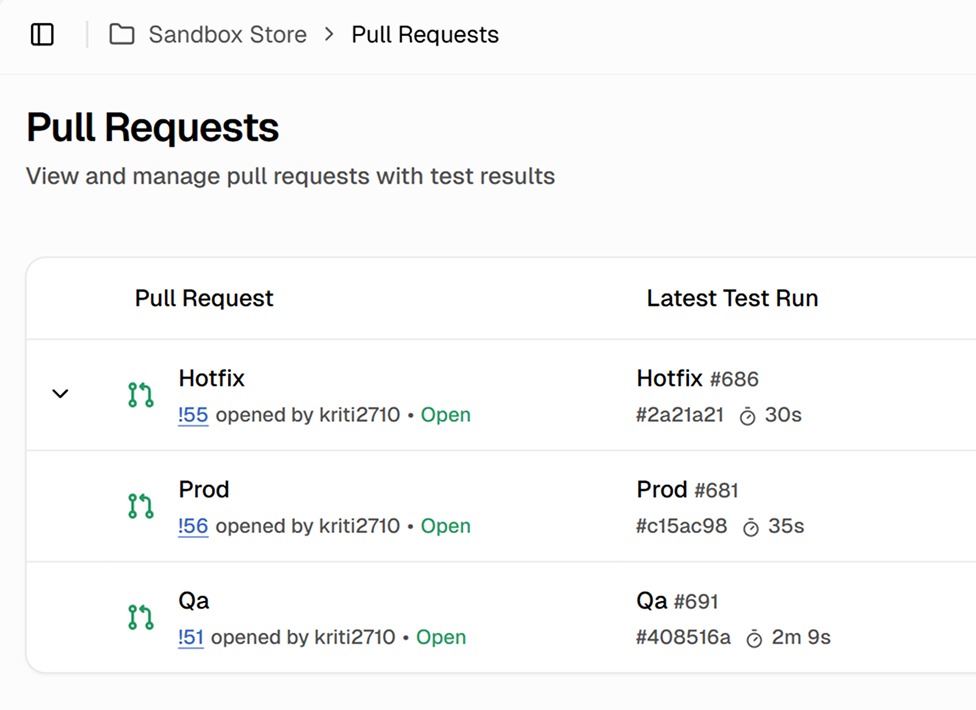
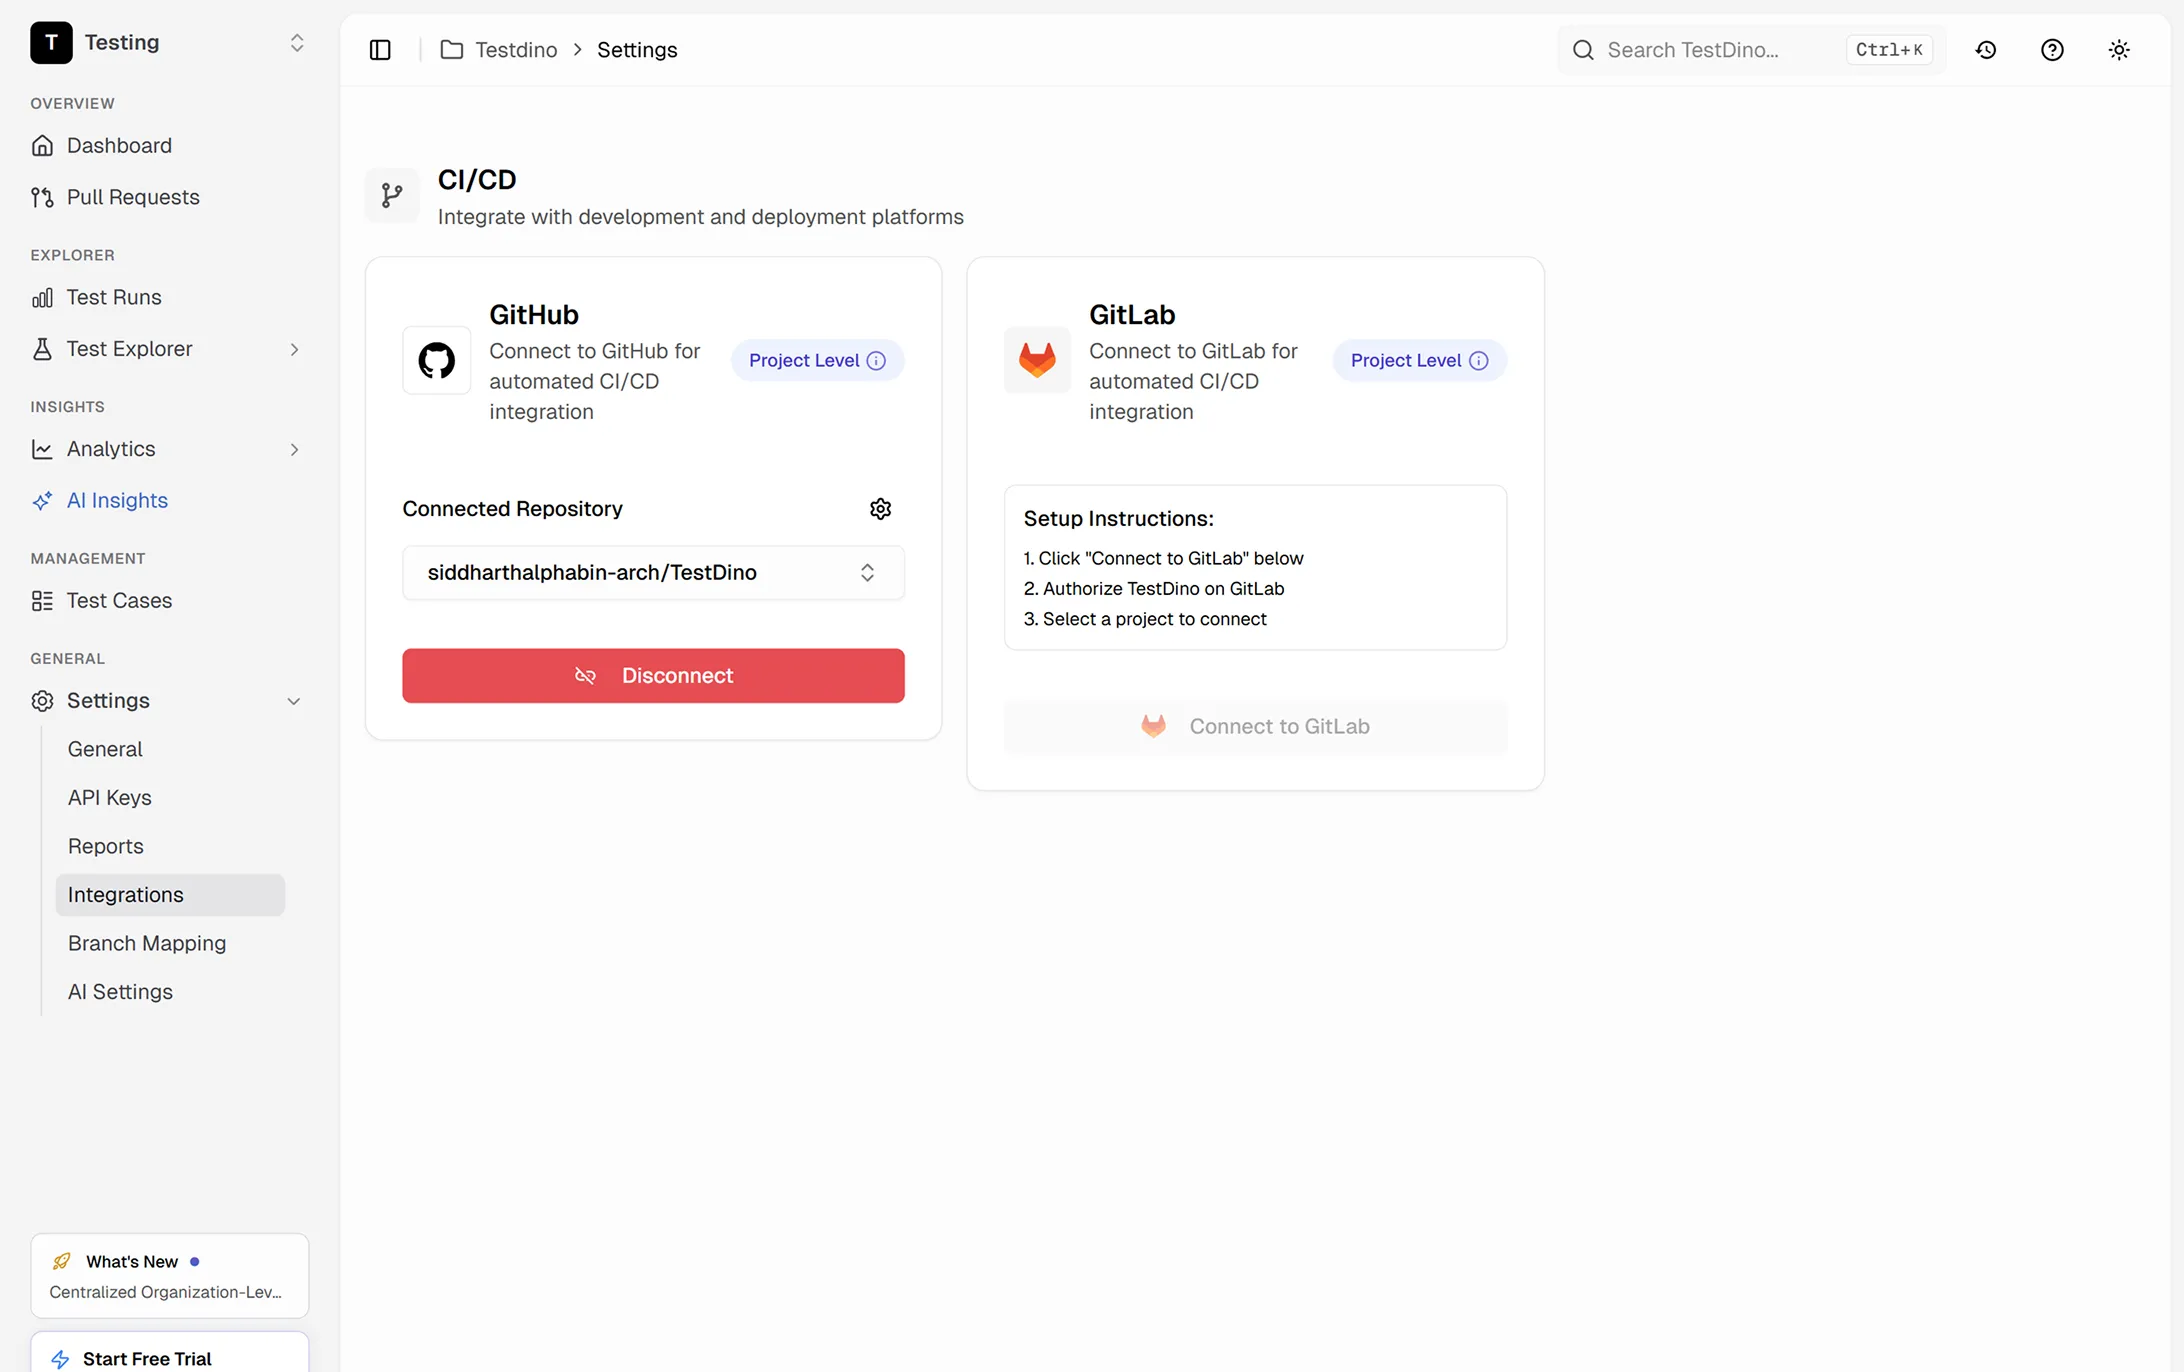
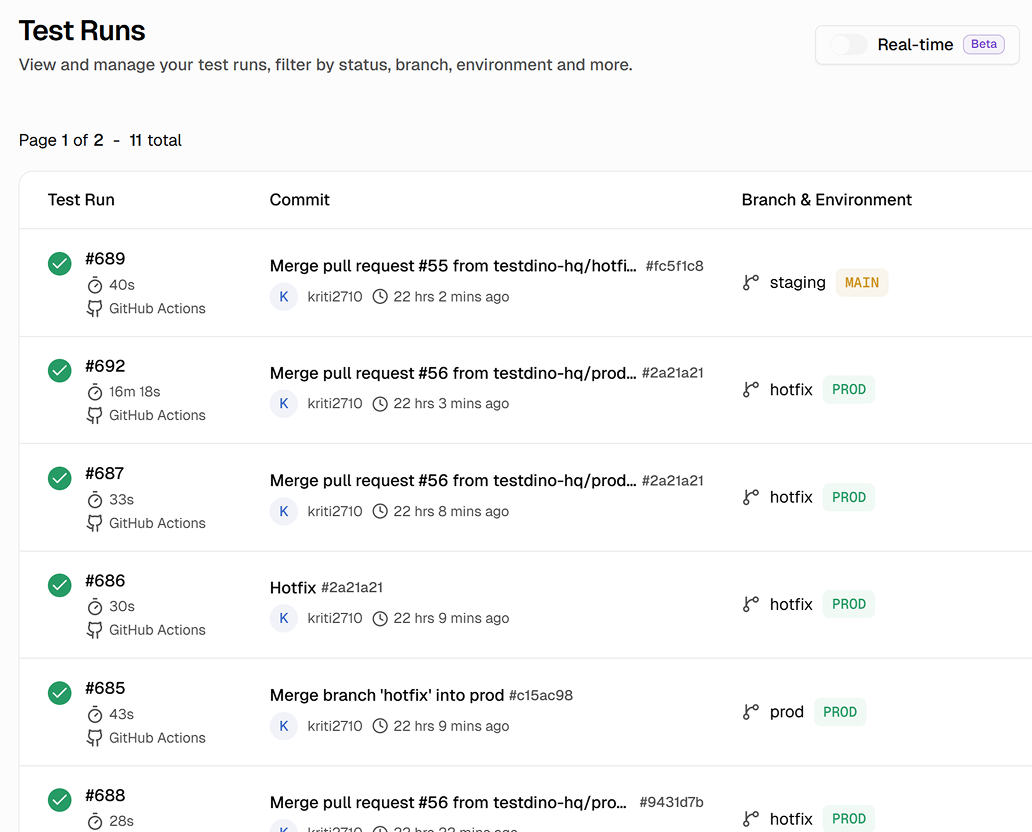
Pull requests with latest test run status
Every pull request shows its latest test run, status, environment, and branch. See which PRs have passing tests and which need attention before merging.
Works with your favourite tools
Connect seamlessly with Jira, Slack, GitHub, Linear, Azure DevOps, Asana, and monday to keep your workflow smooth and your team aligned.
FAQs
Add the @testdino/playwright package to your project, add the reporter to playwright.config.ts, and store your TESTDINO_KEY as a GitHub repository secret. Pass the secret as an environment variable in your workflow YAML. No custom actions or additional steps required.