Know what your Playwright tests cover and miss.
Istanbul-based code coverage per file, per run, across shards. No source code ever leaves your machine.

Shipping Playwright tests without
knowing what they actually cover
Most teams try to measure E2E coverage and give up. Here is why.

E2E coverage is hard to set up
Unit test coverage is a one-liner. E2E coverage with Playwright requires instrumenting your app with Istanbul, configuring the build pipeline, collecting window.__coverage__, and merging results. Most teams never get past step one.
Sharded runs produce fragmented coverage data
You split tests across CI shards for speed. Each shard generates its own coverage data. Merging them into a single report requires custom scripts and shared artifact storage that breaks every CI change.
Coverage metrics don't track over time
Even if you generate a coverage report, it's a snapshot. You can't compare this run to last week's, see if a feature branch dropped coverage, or set thresholds that block merges on regression.
Source code safety concerns kill adoption
Engineering leads worry about coverage tools uploading source code to third-party platforms. Without clear guarantees about what gets uploaded, the security review stalls and coverage never happens.
Coverage dropped. But when and where?
It's dropping. But why?
See exactly when and where
How code coverage works in TestDino
Instrument your app once. TestDino handles collection, merging, and visualization from there.
Instrument your app with Istanbul
TestDino reads coverage data from window.__coverage__, the standard Istanbul global. Use babel-plugin-istanbul, vite-plugin-istanbul, or nyc instrument depending on your stack.

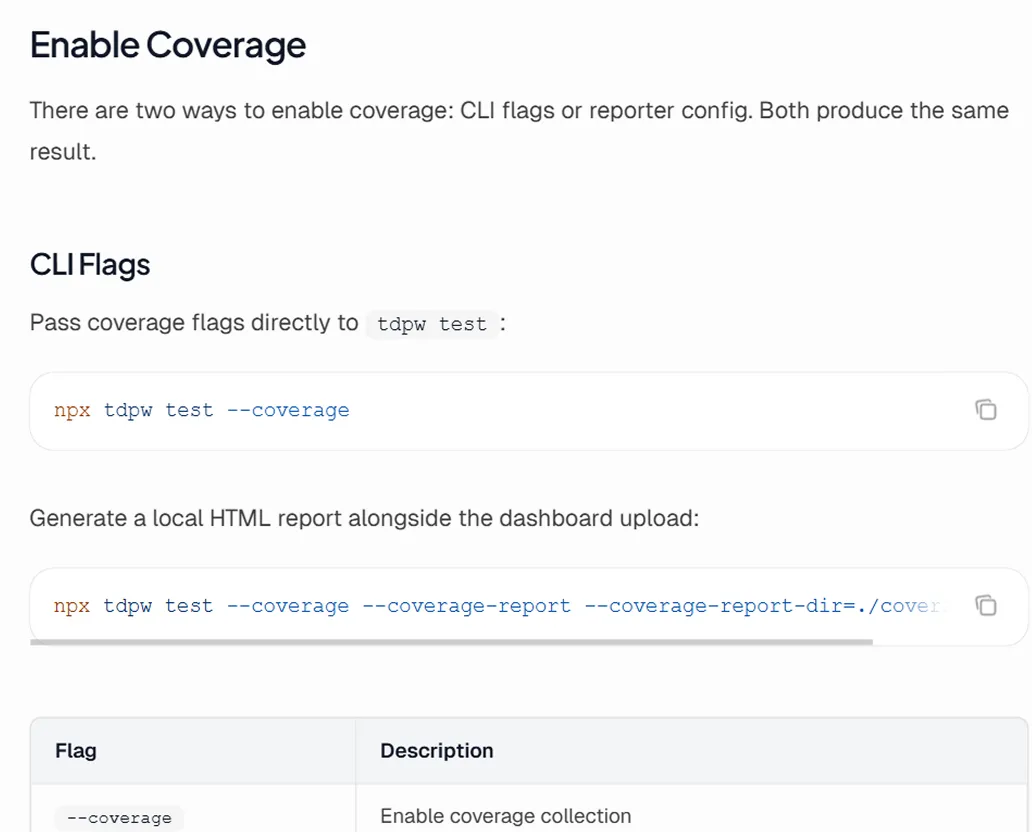
Enable coverage in Playwright
Add the TestDino reporter with coverage enabled. Import from @testdino/playwright instead of @playwright/test and coverage collection runs automatically after each test. See the full setup guide at docs.testdino.com/guides/playwright-code-coverage.

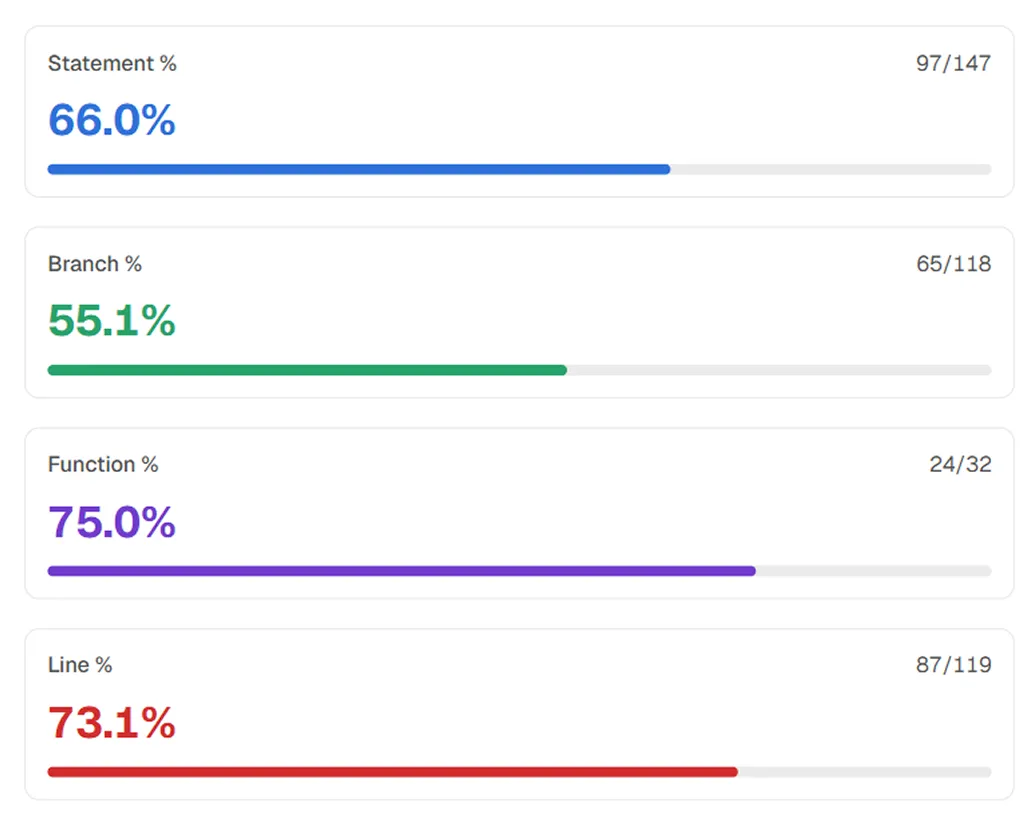
Per-run coverage across all four metrics
Every run shows Statement, Branch, Function, and Line coverage with hit counts. Sharded runs merge automatically into one report with no custom scripts.
Teams love what we built
See why developers choose TestDino to ship faster and debug smarter
We were on the default Playwright reporter, and it was tedious to dig through; half a day gone just triaging failures. The TestDino MCP changed that for us. I now run through the failures in minutes instead of devoting half a day to it, and pulling the latest runs straight through the MCP sped up bug triage drastically. AI failure classification and Slack reports do the rest. It's saved us weeks.
To triage failures, down from half a day
Saved across the team

Migrating to TestDino from Currents was an easy decision. The features are stronger, the cost is lower, and the interface makes debugging far less painful. Flaky test detection and AI failure classification have simplified debugging and reduced our CI costs by cutting down reruns and noisy failures.
Reduction in CI costs
Less time triaging failures

Over 30 flaky tests and no structured way to track them, just CI artifacts and morning guesswork. TestDino's "Most Flaky Tests" feature broke this pattern. We can see failure trends now and pull up video recordings of exactly what went wrong. The TestDino MCP server is the magic piece on top, I ask my Claude agent about a failure and it pulls full context from TestDino without switching tabs. We went from 30-something flaky tests down to 3 or 4.
Fewer flaky test reruns
Faster failure triage

Playwright code coverage
without the plumbing
Statements, branches, functions, and lines
All four Istanbul metrics tracked per file, per run, showing exactly what your E2E tests exercise and miss.
Automatic shard merging
Coverage from all parallel CI shards merges into one unified report. No custom scripts, shared artifacts, or post-processing needed.
Coverage diff between runs
Compare any two runs to see which files gained or lost coverage and by how much, catching regressions before merge.
Coverage trends over time
Statement, branch, function, and line coverage tracked over days, weeks, and months with per-run hover details.
Branch comparison
Average coverage compared across branches, making it easy to spot when feature branches have lower coverage than main.
No source code uploaded
Only percentages and hit counts per file are sent. Source code and raw Istanbul maps stay on your machine.
What you get with code coverage
Coverage visibility without the infrastructure overhead.
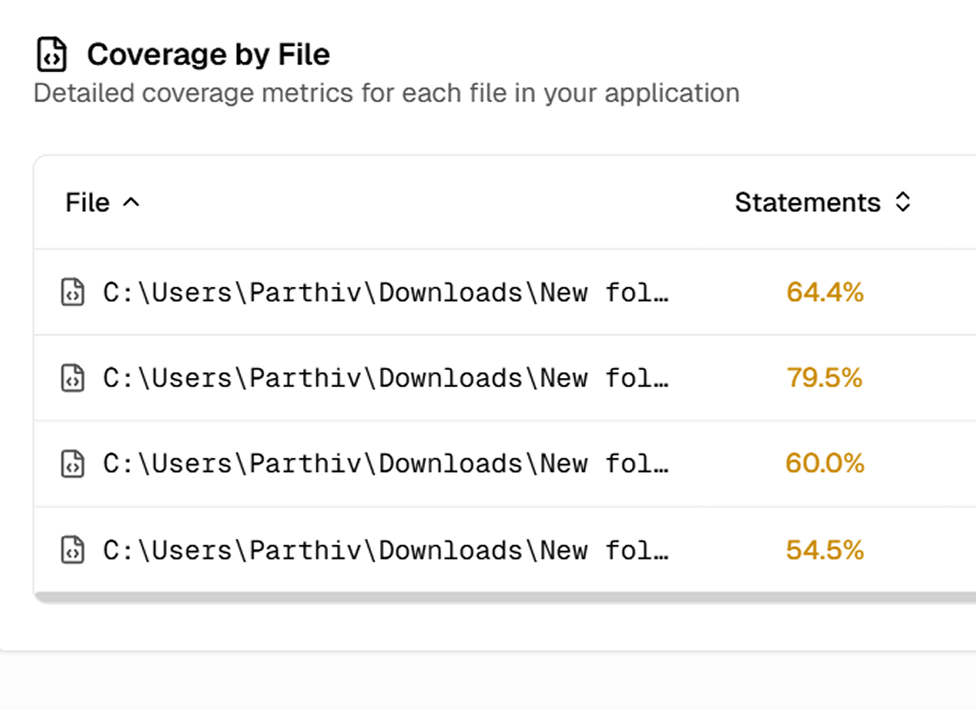
Coverage by file with statements, branches, and functions
Every run includes a file-level table showing Statements, Branches, and Functions coverage per file. Switch between list and tree view to find which files need more coverage.
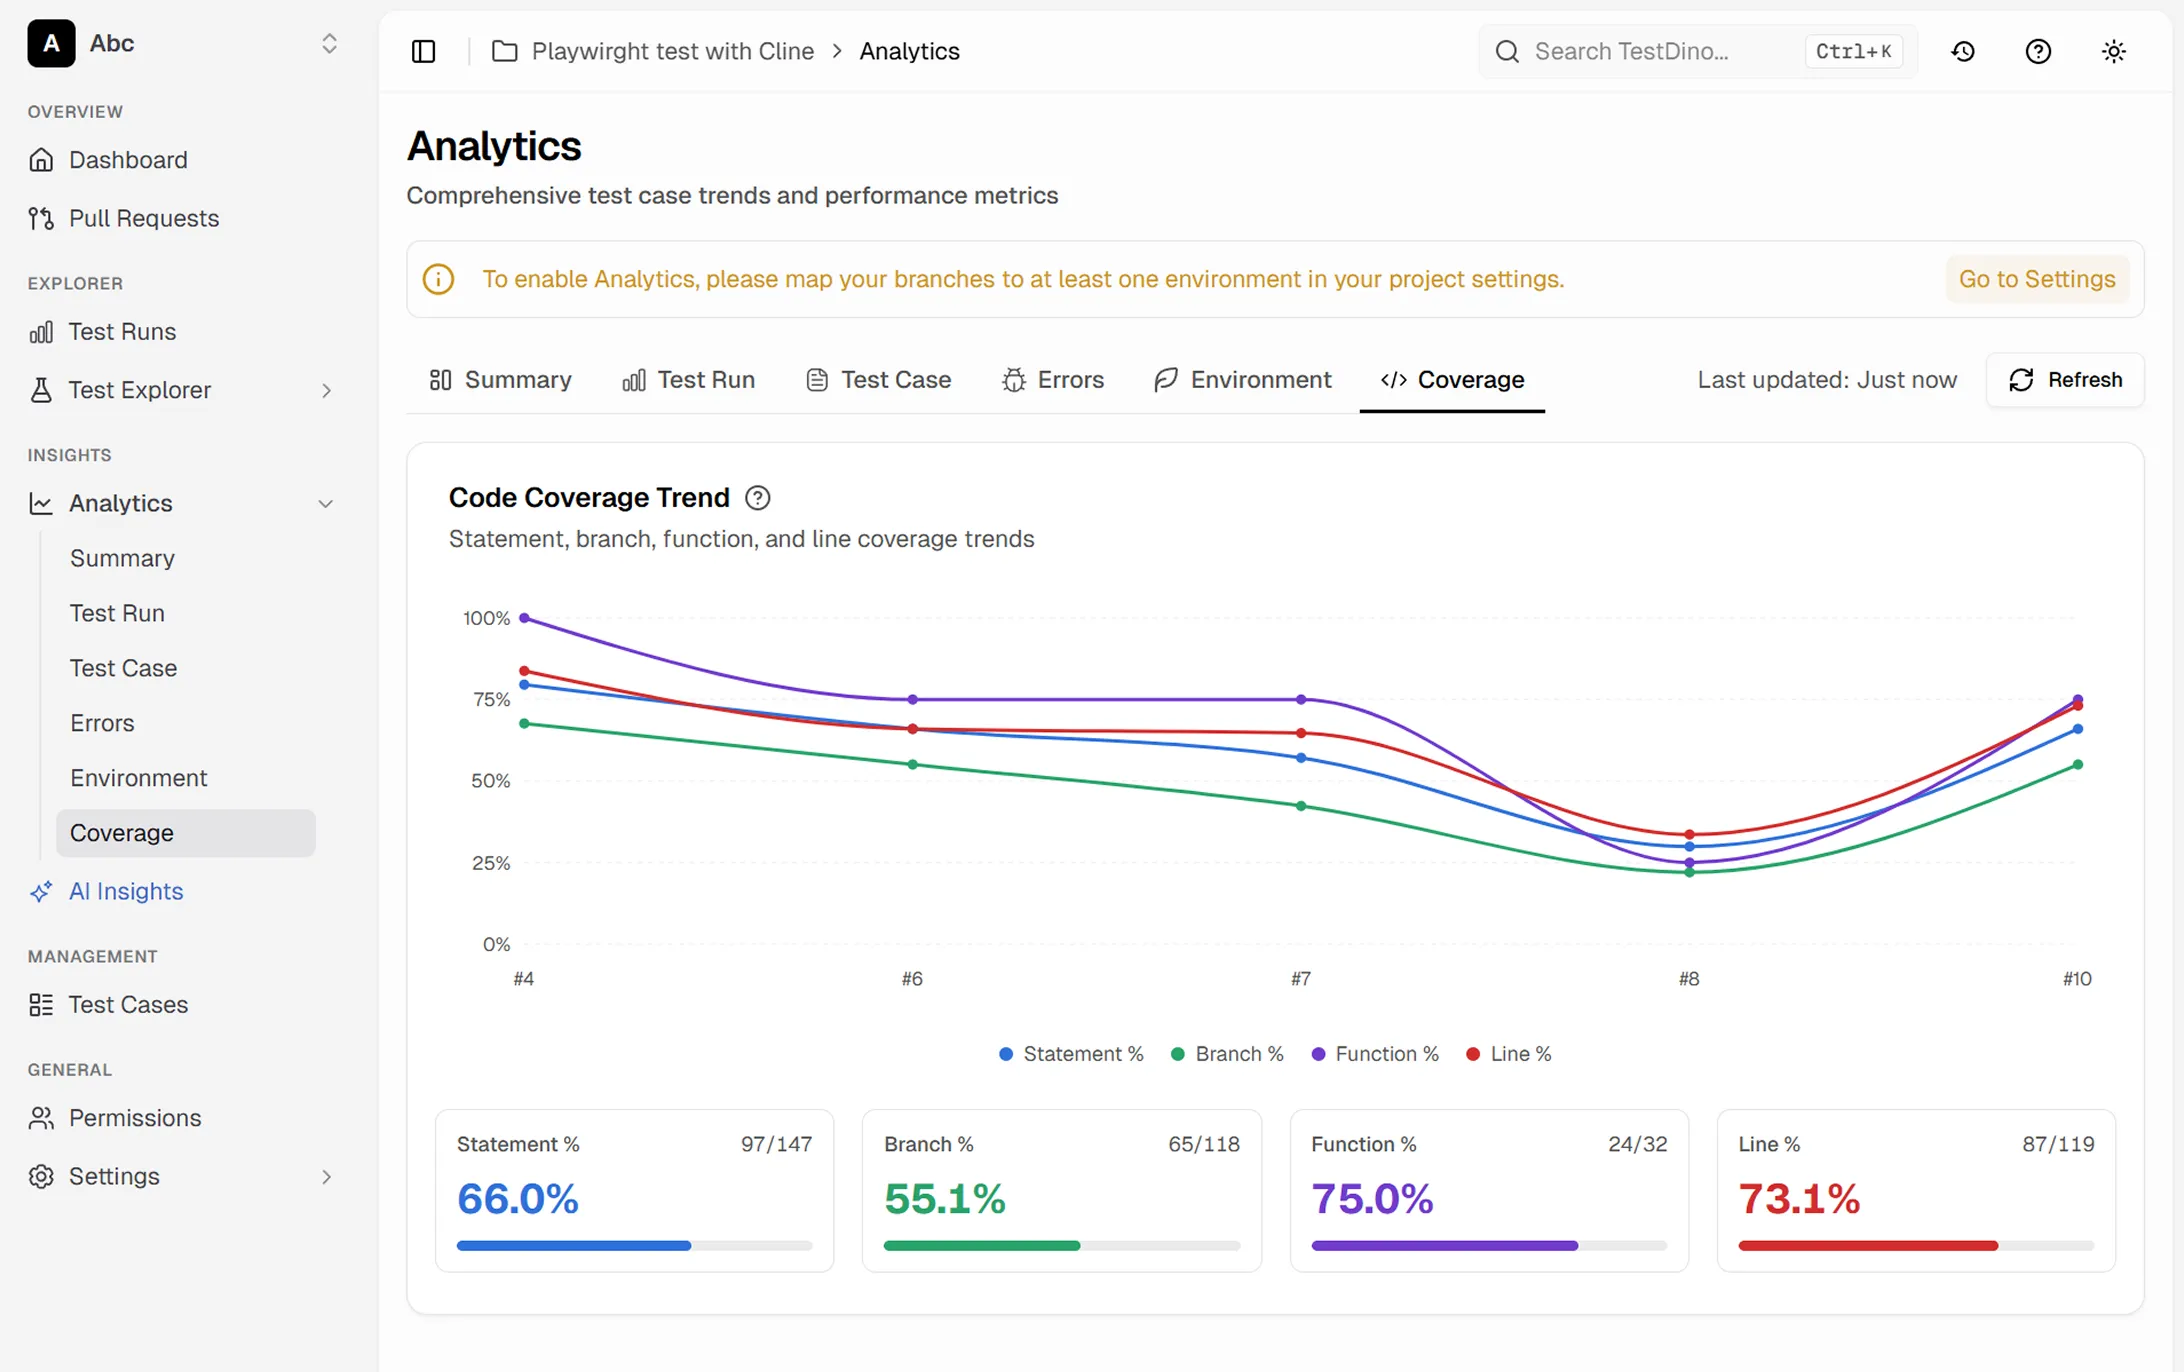
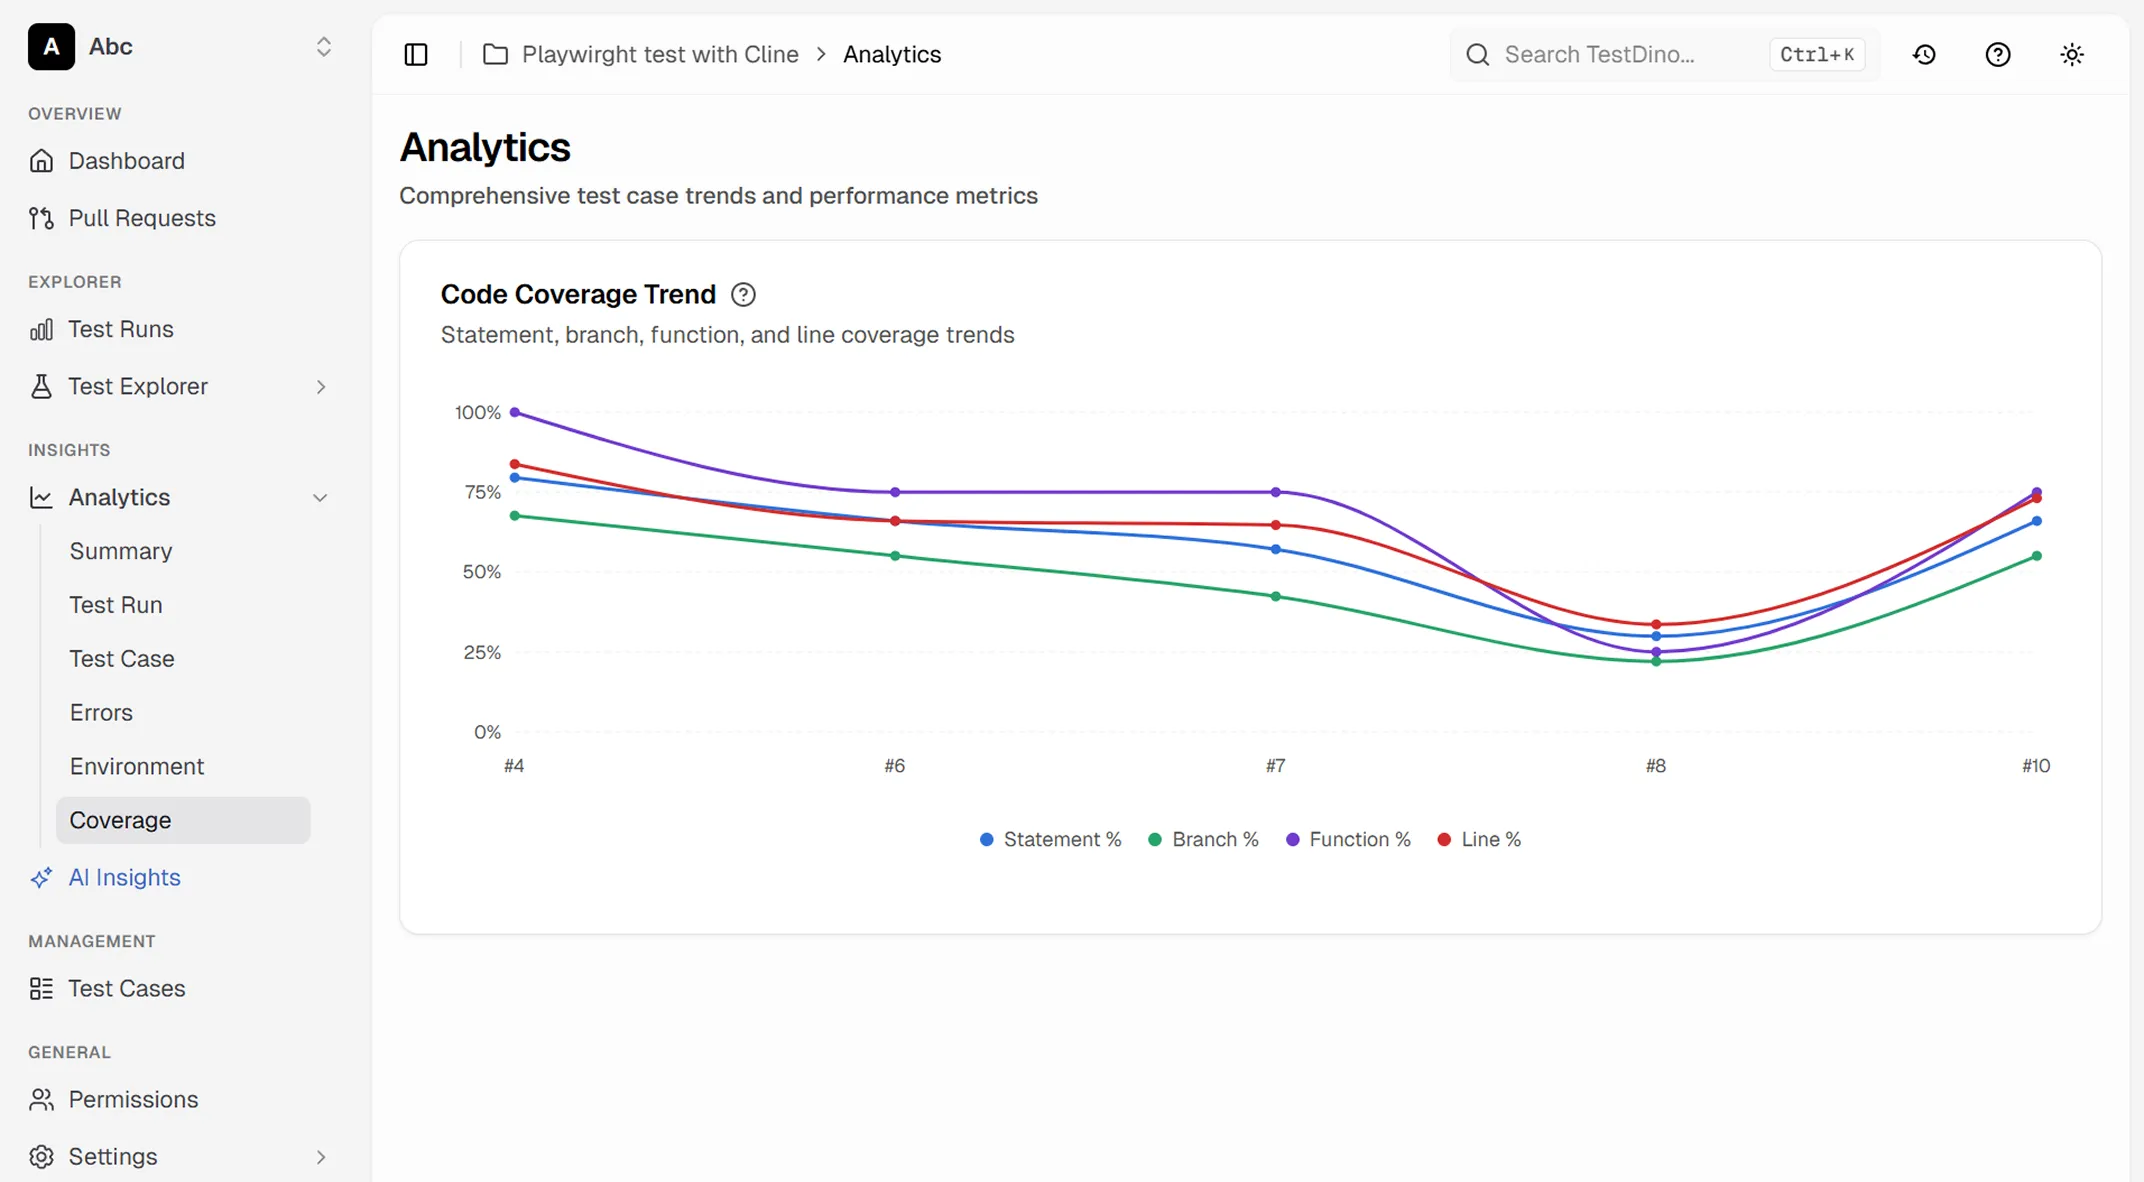
Code coverage trend across runs
The Analytics Coverage tab shows Statement, Branch, Function, and Line trends across your last runs. Filter by environment or date range to see where coverage is moving.
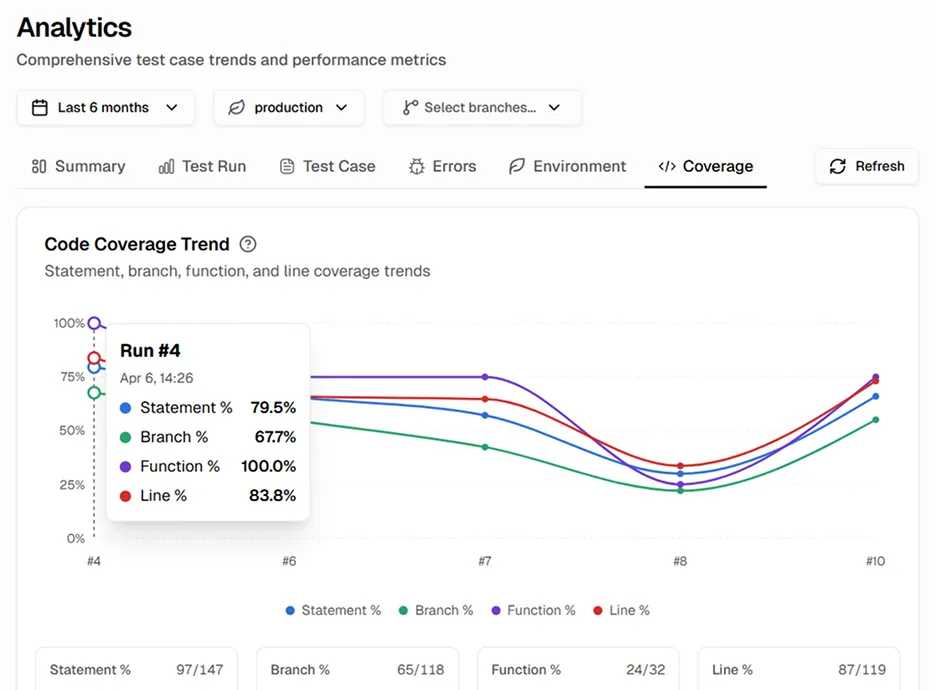
Hover any run to see the exact coverage numbers
Hover any point on the trend chart to see Statement, Branch, Function, and Line percentages for that run. The totals at the bottom show hit counts across your full test suite.
Works with your favourite tools
Connect seamlessly with Jira, Slack, GitHub, Linear, Azure DevOps, Asana, and monday to keep your workflow smooth and your team aligned.
FAQs
TestDino tracks four standard Istanbul metrics: statements, branches, functions, and lines. All four are tracked per file, per run, and across time.