
Know why your tests passed and if they will keep passing.
Pass rate trends, flakiness trajectories, and error patterns across environments and time.

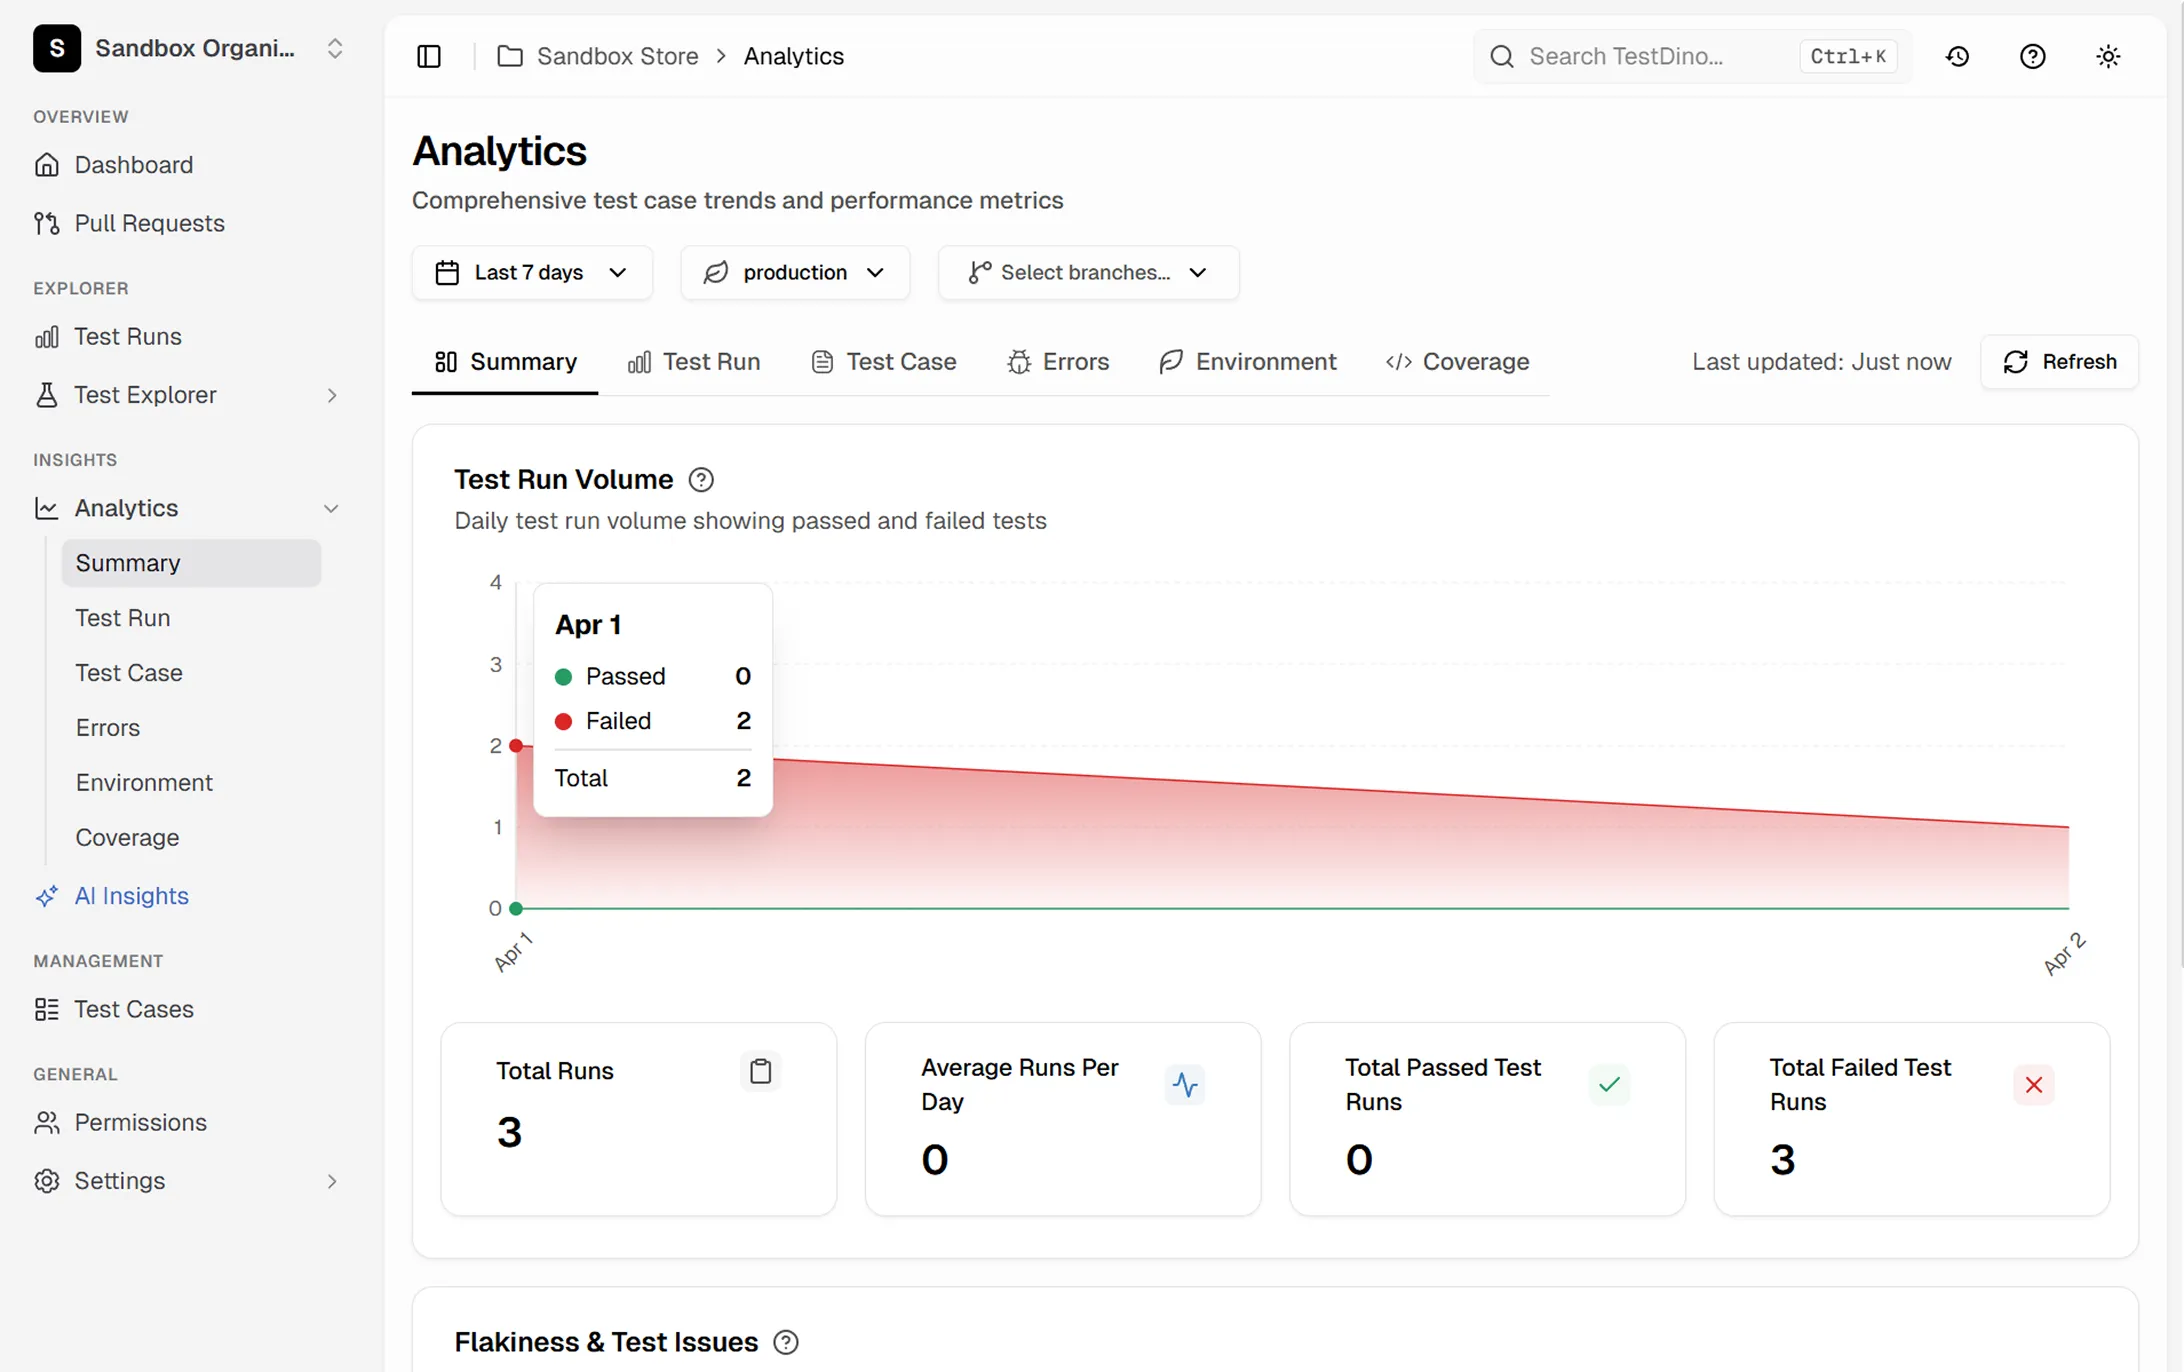








Rich test data but zero
visibility into the patterns
Hundreds of tests run daily but the only metric anyone tracks is whether the build passed.

Failure patterns repeat but nobody connects the dots
The same API timeout failure happens every Tuesday morning. Without trend data, each occurrence gets investigated from scratch as if it's new.
Flakiness increases gradually and invisibly
A test that was 99% reliable six months ago is now failing 15% of the time. The degradation happened so slowly that nobody flagged it until it started blocking deployments.
Environment-specific issues are hard to isolate
Tests pass on staging but fail on preview environments. Without analytics that segment by environment, you waste time debugging the wrong configuration.
Error classification is manual and inconsistent
One engineer marks a failure as 'infra issue,' another marks the same pattern as 'test bug.' Without standardized categorization, your failure data is unreliable.
A good run can still hide a bad trend.
Pass rate, failures, and flakiness
Flaky tests, errors, environments
How Playwright test analytics work
Every test result flows into TestDino automatically. The platform aggregates, categorizes, and visualizes your data across runs, environments, and time periods.
Add the TestDino reporter
One line in your Playwright config. Every test result, timing, error message, and metadata is captured from that point forward.

reporter: [
  ['@testdino/playwright', {
    token: process.env.TESTDINO_TOKEN
  }],
]
npx playwright testRun tests as usual
No changes to your test code or CI pipeline. TestDino receives results in the background and begins building your analytics from the first run.

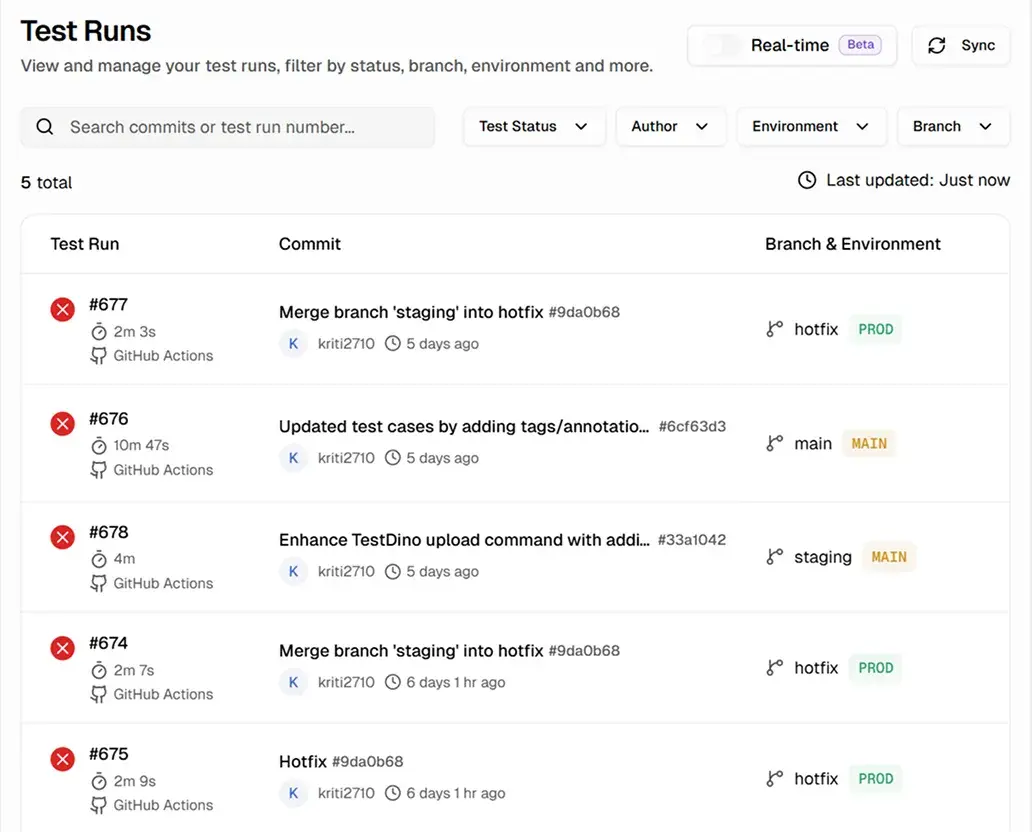
Explore interactive dashboards
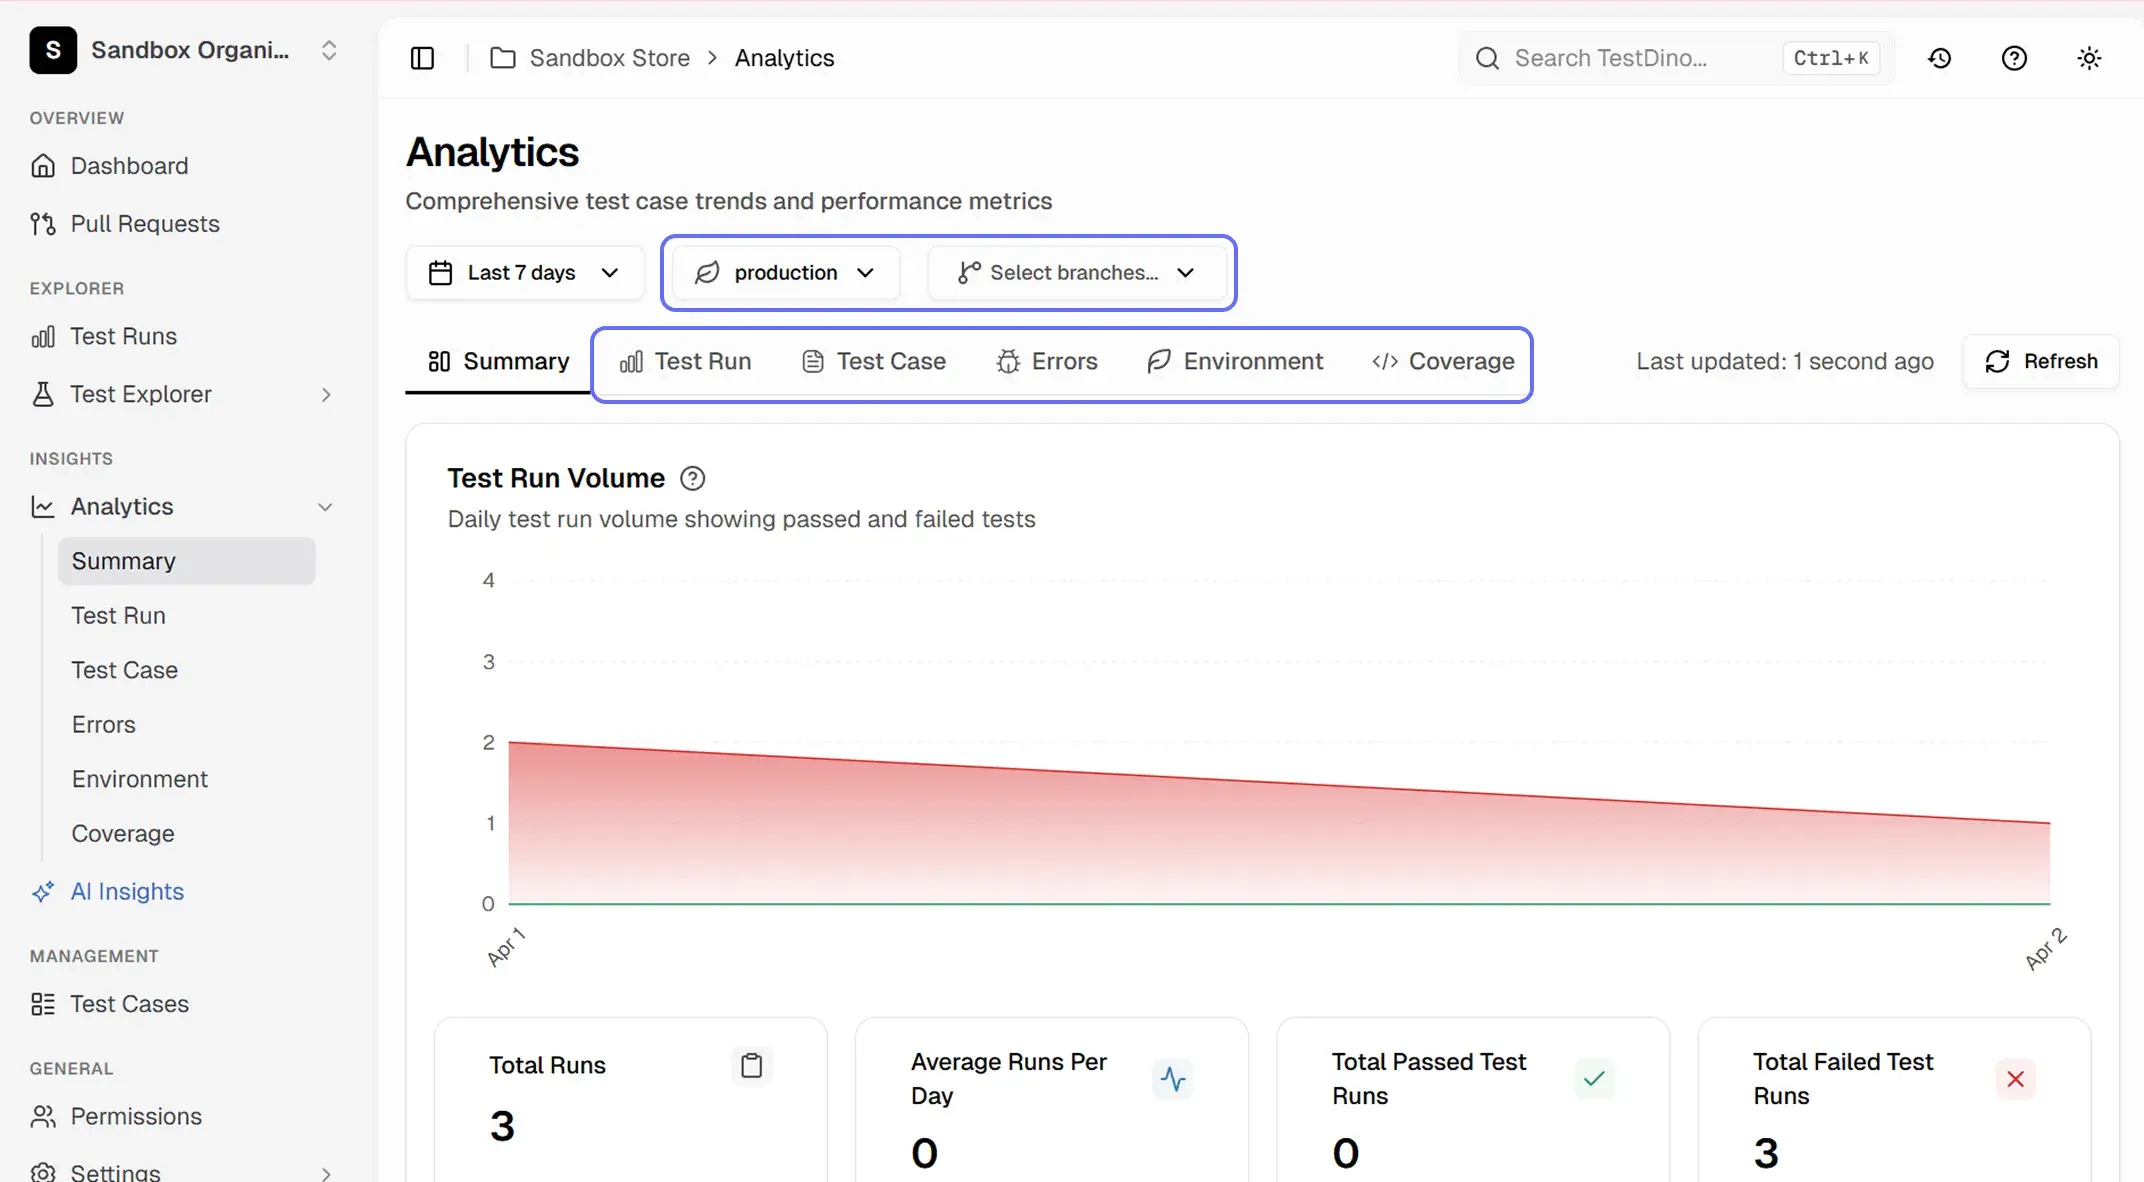
Use interactive charts to track pass rates, failure trends, flakiness scores, and error categories - segmented by environment, branch, tag, or time range.
What analytics reveal about
your Playwright suite
Pass rate trends over time
Daily, weekly, and monthly pass rates show whether your suite is improving or degrading, down to the exact commit.
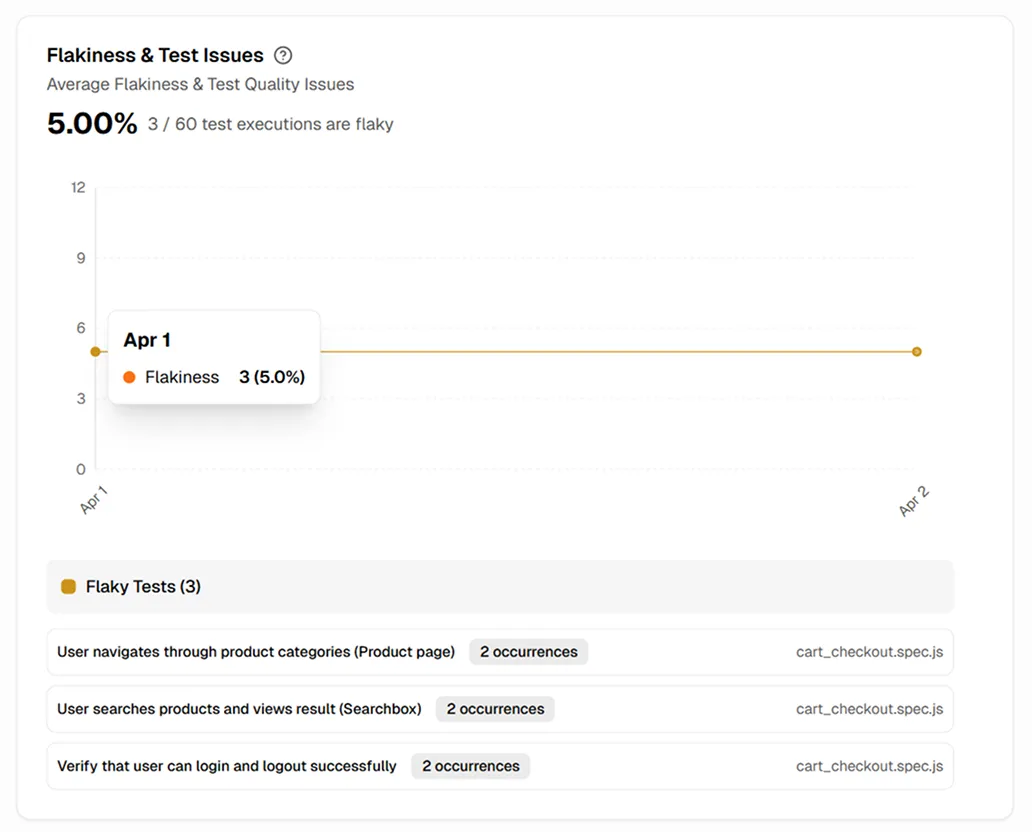
Flakiness scoring and trend tracking
Each test gets a flakiness score based on inconsistent outcomes, with trends over time to prioritize the noisiest tests.
Error pattern analysis
Errors are grouped by pattern automatically, not manually tagged. The most frequent error messages and their frequency trends are visible.
Environment-scoped comparison dashboards
Pass rates, failure counts, and flakiness scores compared side by side across staging, production, and preview environments.
Test duration analytics
Individual test and full suite durations tracked across runs, highlighting tests getting slower before they inflate your CI bill.
Regression detection signals
Tests that recently went from passing to failing or stable to flaky are flagged automatically, catching regressions early.
What you get with test analytics
Raw test data turned into actionable trends and insights.
Shared team visibility without shared logins
Share dashboard links with anyone on your team. Product managers see suite health, QA leads see flakiness trends, and engineers see error breakdowns without asking for screenshots or status updates.
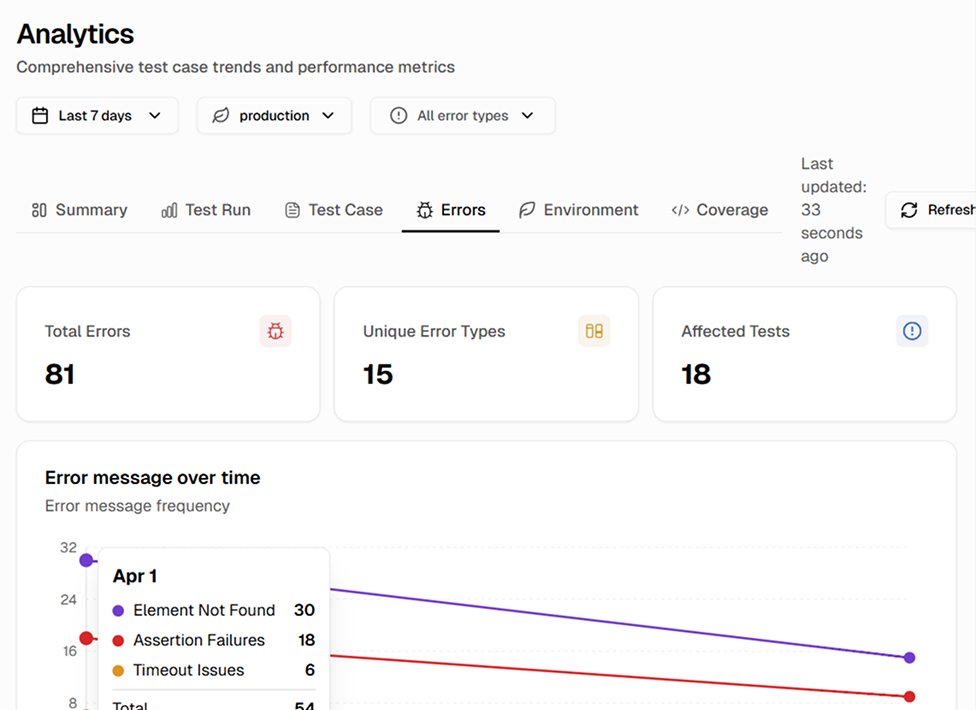
Patterns that would take hours to find manually
TestDino correlates data across hundreds of runs to surface trends you'd never spot in CI logs. Recurring failures, slow degradation, and environment-specific patterns become visible automatically.
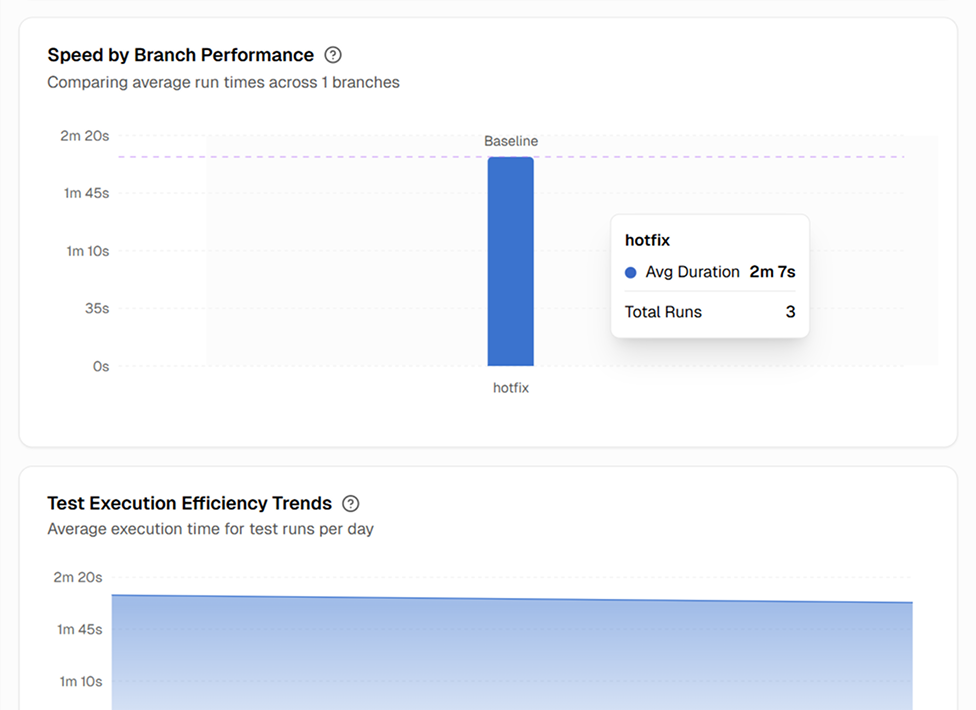
Speed by branch and execution trends
Compare average run duration across branches and track daily execution efficiency trends to spot slowdowns before they hit main.
Works with your favourite tools
Connect Jira, Slack, GitHub, Linear, Azure DevOps, Asana, and monday to keep your workflow smooth and your team aligned.





FAQs
Analytics begin populating from your very first test run. Summary metrics like pass rate and test count are available immediately. Trend data becomes more useful after a few days of runs, as the platform needs multiple data points to calculate trends.