Playwright report for CI and local runs
Playwright reports turn raw test output into clear, actionable insights for CI and local runs. This guide covers HTML and JSON reporting, CI best practices, and faster failure debugging.
Automated testing only delivers real value when teams clearly understand what happened during every run, and that understanding comes from a well-structured Playwright report.
A clear Playwright test report acts as the bridge between raw test execution and confident release decisions, helping teams quickly identify whether failures are real regressions or test noise.
Studies show that nearly 70% of QA time is spent analyzing failures rather than writing new tests, which makes reporting quality a major productivity multiplier.
Strong Playwright reporting, especially when using the Playwright HTML reporter and Playwright JSON report, reduces noise, improves test result visualization, and accelerates failed test debugging across QA and development teams.
In this guide, we will see how to generate, customize, and optimize Playwright reports for both CI and local runs, including best practices for Playwright report configuration, CI-friendly reporting, and actionable insights for faster, more reliable releases.
What is a Playwright Report and Why Does it Matter
A Playwright report includes critical execution details, such as pass/fail status, test duration, browser coverage, retries, and rich artifacts like screenshots, videos, and traces.
Playwright reports display test status indicators for each test case, such as 'passed,' 'failed,' or 'skipped,' making it easy to interpret outcomes at a glance.
This Playwright test report serves as reliable test evidence and a shared source of truth for QA engineers, developers, test leads, and other stakeholders across the release cycle.
According to GitHub Octoverse data, teams using structured automated test reports detect up to 40% more regressions before production compared to teams relying only on logs.
A well-configured Playwright test report, especially when using the Playwright HTML reporter and Playwright JSON report, directly improves software quality by increasing visibility, speeding up debugging, and strengthening CI/CD decision-making.
Where Playwright Reports Fit in the Workflow
Playwright reports sit immediately after test execution and just before release decisions are made. They transform raw automation output into actionable insights by summarizing results through a structured Playwright test report.
In CI/CD pipelines, Playwright reports act as CI test reports and build artifacts that influence key decisions, including:
-
Merge approvals based on Playwright test report status
-
Deployment gates driven by Playwright HTML reporter results
-
Rollback decisions supported by Playwright JSON report data and test evidence
-
Overall release confidence through consistent Playwright report configuration
Understanding Playwright Test Automation Reports
Playwright provides multiple default reporters designed to support different testing and reporting use cases. These include the Playwright HTML reporter, Playwright JSON report, and lightweight console-based reporters used during local and CI runs.
Each Playwright report type offers a different level of test result visualization, automation, and integration, allowing teams to choose the right Playwright test report format based on their workflow and CI/CD needs.
Default Playwright Report Types: HTML Report and More
Playwright ships with several built-in reporters that cover both human-readable and machine-consumable reporting requirements:
-
Playwright HTML reporter for rich visual debugging, screenshots, videos, and trace viewer access
-
Playwright JSON report for structured, machine-readable output used in analytics and custom reporting
-
Line, dot, and list reporters for fast terminal feedback during local execution
The Playwright HTML reporter is used by over 70% of teams because of its clarity and ease of debugging.
Where Reports Fit in the Playwright Workflow
Playwright reports are generated immediately after test execution and stored in the artifacts folder. CI pipelines, dashboards, and automated test analytics tools consume these outputs.
A consistent Playwright report folder structure ensures traceability, auditability, and reliable access to Playwright test reports across local runs and CI environments.
How to Generate Playwright Reports
Generating a Playwright report is a straightforward process, but following the right steps ensures consistent and CI-ready Playwright test reports for both local and automated runs.
Step 1: Install Playwright and Initialize Tests
First, make sure Playwright is installed and initialized in your project. This sets up the default test runner and configuration needed for reporting.
npm init playwright@latestThis command creates the basic Playwright setup, including the default playwright.config.ts file where Playwright report configuration is defined.
Step 2: Run Tests with the Default Reporter
By default, Playwright generates a simple console-based report. This is useful for quick feedback but limited for debugging.
npx playwright testAt this stage, you get basic pass or fail output, but no rich Playwright HTML report or structured Playwright JSON report.
Step 3: Generate a Playwright HTML Report from the CLI
To generate a visual Playwright HTML reporter output, run tests with the HTML reporter enabled.
npx playwright test --reporter=htmlThis command creates a Playwright report inside the playwright-report folder. You can open the report locally to view test results, screenshots, videos, and traces.
Step 4: Configure Reporters in playwright.config.ts
For consistent reporting across local and CI runs, configure reporters in
import { defineConfig } from '@playwright/test';
export default defineConfig({
  reporter: [
    ['html', { outputFolder: 'playwright-report', open: 'never' }],
    ['json', { outputFile: 'report.json' }]
  ],
});
This setup generates both a Playwright HTML report and a Playwright JSON report, enabling visual debugging and automation-friendly output.
Step 5: Run Tests and Verify Report Output
Run your Playwright tests again after configuration.
npx playwright testVerify that the Playwright test report HTML output is generated in the configured folder and that the JSON file contains structured test results.
Step 6: Store Reports as CI Artifacts
In CI environments, ensure the Playwright report folder is stored as an artifact. This allows teams to download and review test results after the pipeline completes.
This step ensures Playwright reports remain accessible for debugging, auditing, and team collaboration across CI/CD pipelines.
Customizing Your Playwright Reports with Custom Reporters
Many teams extend Playwright reporting using third-party tools or custom integrations to go beyond basic HTML output. These enhancements improve test result visualization, enable automated test analytics, and provide deeper test run insights across CI and local runs.
Customization allows teams to adapt each Playwright report to their workflow, whether the goal is long-term trend analysis, compliance reporting, or advanced debugging for failed tests.
Playwright Allure Report Setup
The Playwright allure report is a popular choice for teams that need historical visibility across multiple runs. Allure provides interactive dashboards, test summaries, timelines, and trend analysis built on top of Playwright results.
Organizations report up to a 25% reduction in flaky tests after adopting Allure reporting, primarily due to improved visibility into failure patterns and retries.
Integrating Allure with Playwright test reports helps teams move from reactive debugging to proactive quality management.
Custom Playwright Report Solutions
Some teams build a Playwright custom report using the Playwright JSON report as the data source.
This approach is ideal for organizations with branding, compliance, or security requirements that standard reporters cannot meet.
Custom Playwright reports enable deep integration with internal dashboards, CI systems, and automated test analytics platforms, turning raw test data into actionable insights tailored to the organization's needs.
Optimizing Playwright Reports for CI/CD Test Execution
CI environments introduce unique challenges such as parallel execution, ephemeral runners, and limited storage. Proper Playwright report configuration ensures that Playwright test reports remain reliable, accessible, and actionable across CI pipelines.
Industry data shows that over 80% of CI failures are diagnosed using test reports rather than raw logs, highlighting the importance of clear and consistent Playwright reporting in CI/CD workflows.
Merging Playwright Reports in CI
Parallel test execution significantly improves CI speed, but it also fragments results across multiple shards, browsers, and runners. Merging Playwright reports brings all execution data together into a single, unified Playwright test report for faster and more reliable analysis.
Why merging Playwright reports is important in CI:
-
Consolidates results from parallel shards into one report
-
Provides a single Playwright HTML report for the entire pipeline
-
Simplifies failure analysis across browsers and environments
-
Improves visibility for QA, developers, and CI stakeholders
How Playwright report merging works:
-
Each CI shard generates a partial report using the blob reporter
-
All shard outputs are collected after test execution
-
Playwright merges these blobs into one complete report
Step-by-step approach to merging Playwright reports in CI:
-
Configure the blob reporter in your Playwright report configuration
-
Run Playwright tests in parallel across shards or browsers
-
Collect blob report outputs from each CI runner
-
Use Playwright's merge command to generate a unified Playwright HTML reporter output
This approach ensures that even in highly parallelized CI environments, teams get a single, accurate Playwright test report that reflects the full test run.
From Playwright Reports to Actionable Insights with TestDino
TestDino elevates Playwright reporting from static outputs to actionable intelligence. TestDino transforms raw Playwright test reports into an interactive web dashboard that provides clarity across CI and local runs.
Teams using AI-assisted reporting resolve failures up to 35% faster by reducing manual triage and surfacing meaningful insights early.
TestDino:
TestDino is a Playwright test reporting and analytics platform that turns raw test results into an interactive web dashboard. Instead of only reading a console log or opening a local HTML file, your team can view test runs, failures, screenshots, and AI insights in one place.
Prerequisites
Before you add TestDino to your project, make sure you have:
-
A working Playwright test project
-
Node.js is installed on your machine or CI runner
-
A TestDino account
-
At least one project was created in TestDino
-
A project token for that TestDino project
You will use this token with the tdpw CLI. Treat it like a password and do not commit it to Git.
Step 1: Install and Check the TestDino CLI
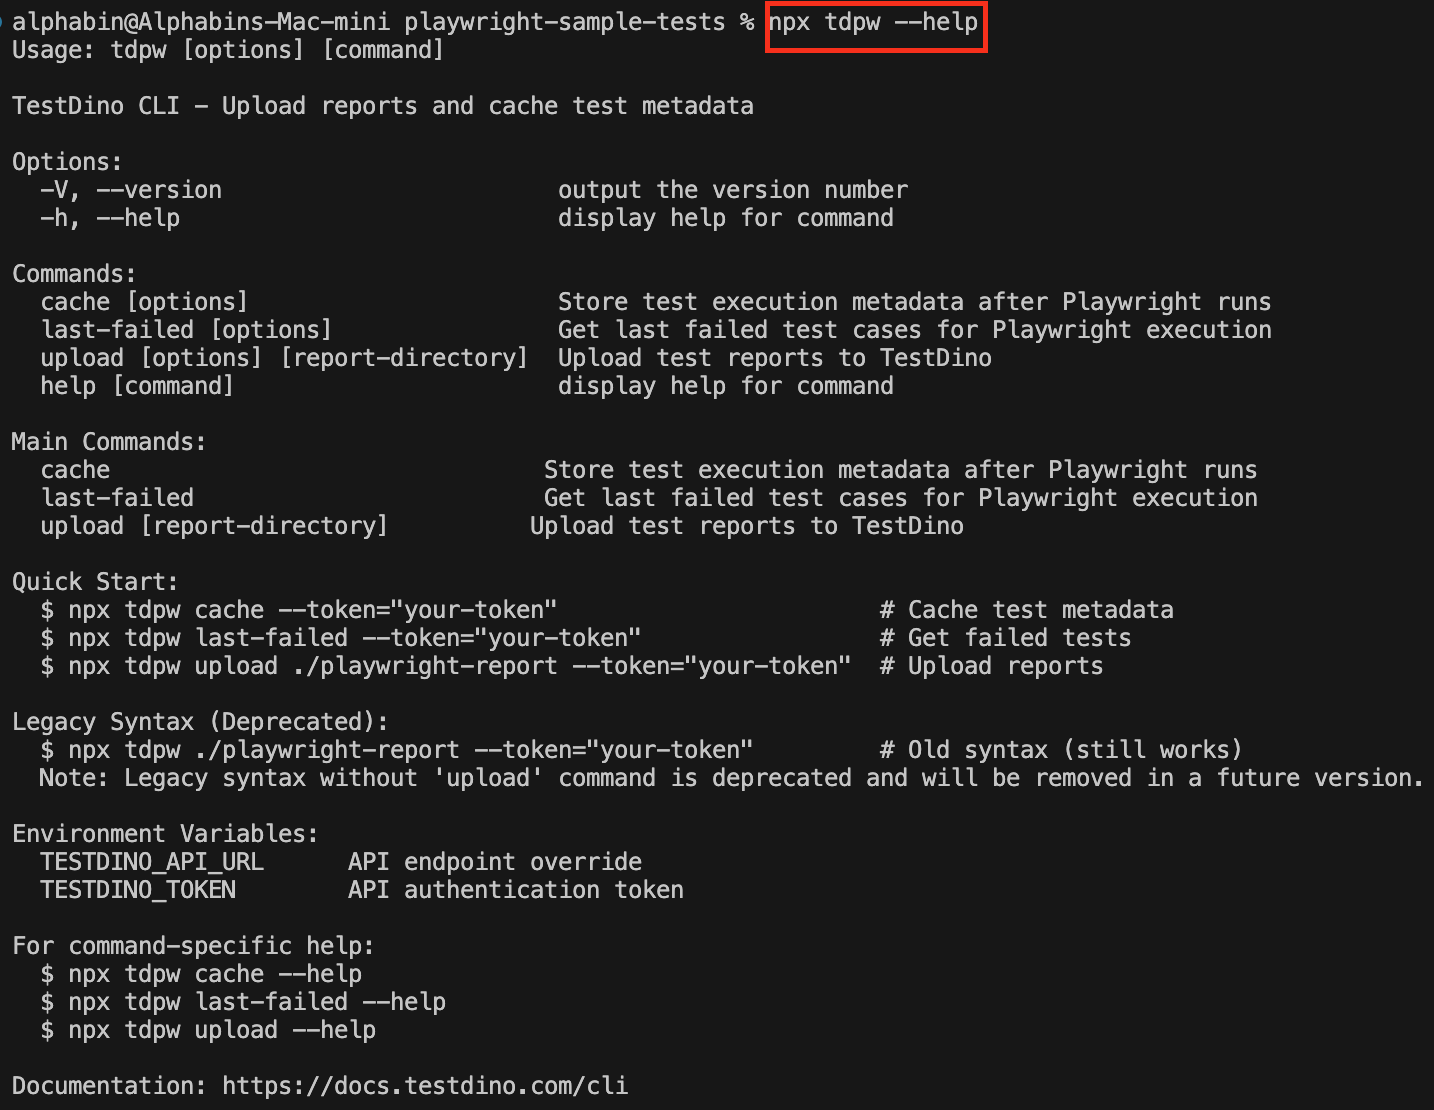
TestDino provides a CLI tool called tdpw to upload reports and work with test history. You don't need to install it globally; you can call it with npx.
# Show TestDino CLI help
npx tdpw --help
This command confirms the CLI is available and ready to upload Playwright reports.
Step 2: Configure Reporters in Playwright
TestDino works with the Playwright JSON report. Add the following reporter configuration to your existing playwright.config.js or playwright.config.ts.
reporter: [
  // Mandatory reporter for JSON results
  ['json', { outputFile: './playwright-report/report.json' }],
  // Optional, enables native HTML upload
  ['html', { outputDir: './playwright-report' }],
],
This setup:
-
Writes a JSON report to ./playwright-report/report.json
-
Writes the Playwright HTML report and assets into ./playwright-report
The JSON file is what tdpw reads during upload, and the HTML folder provides screenshots and the full Playwright HTML reporter output.
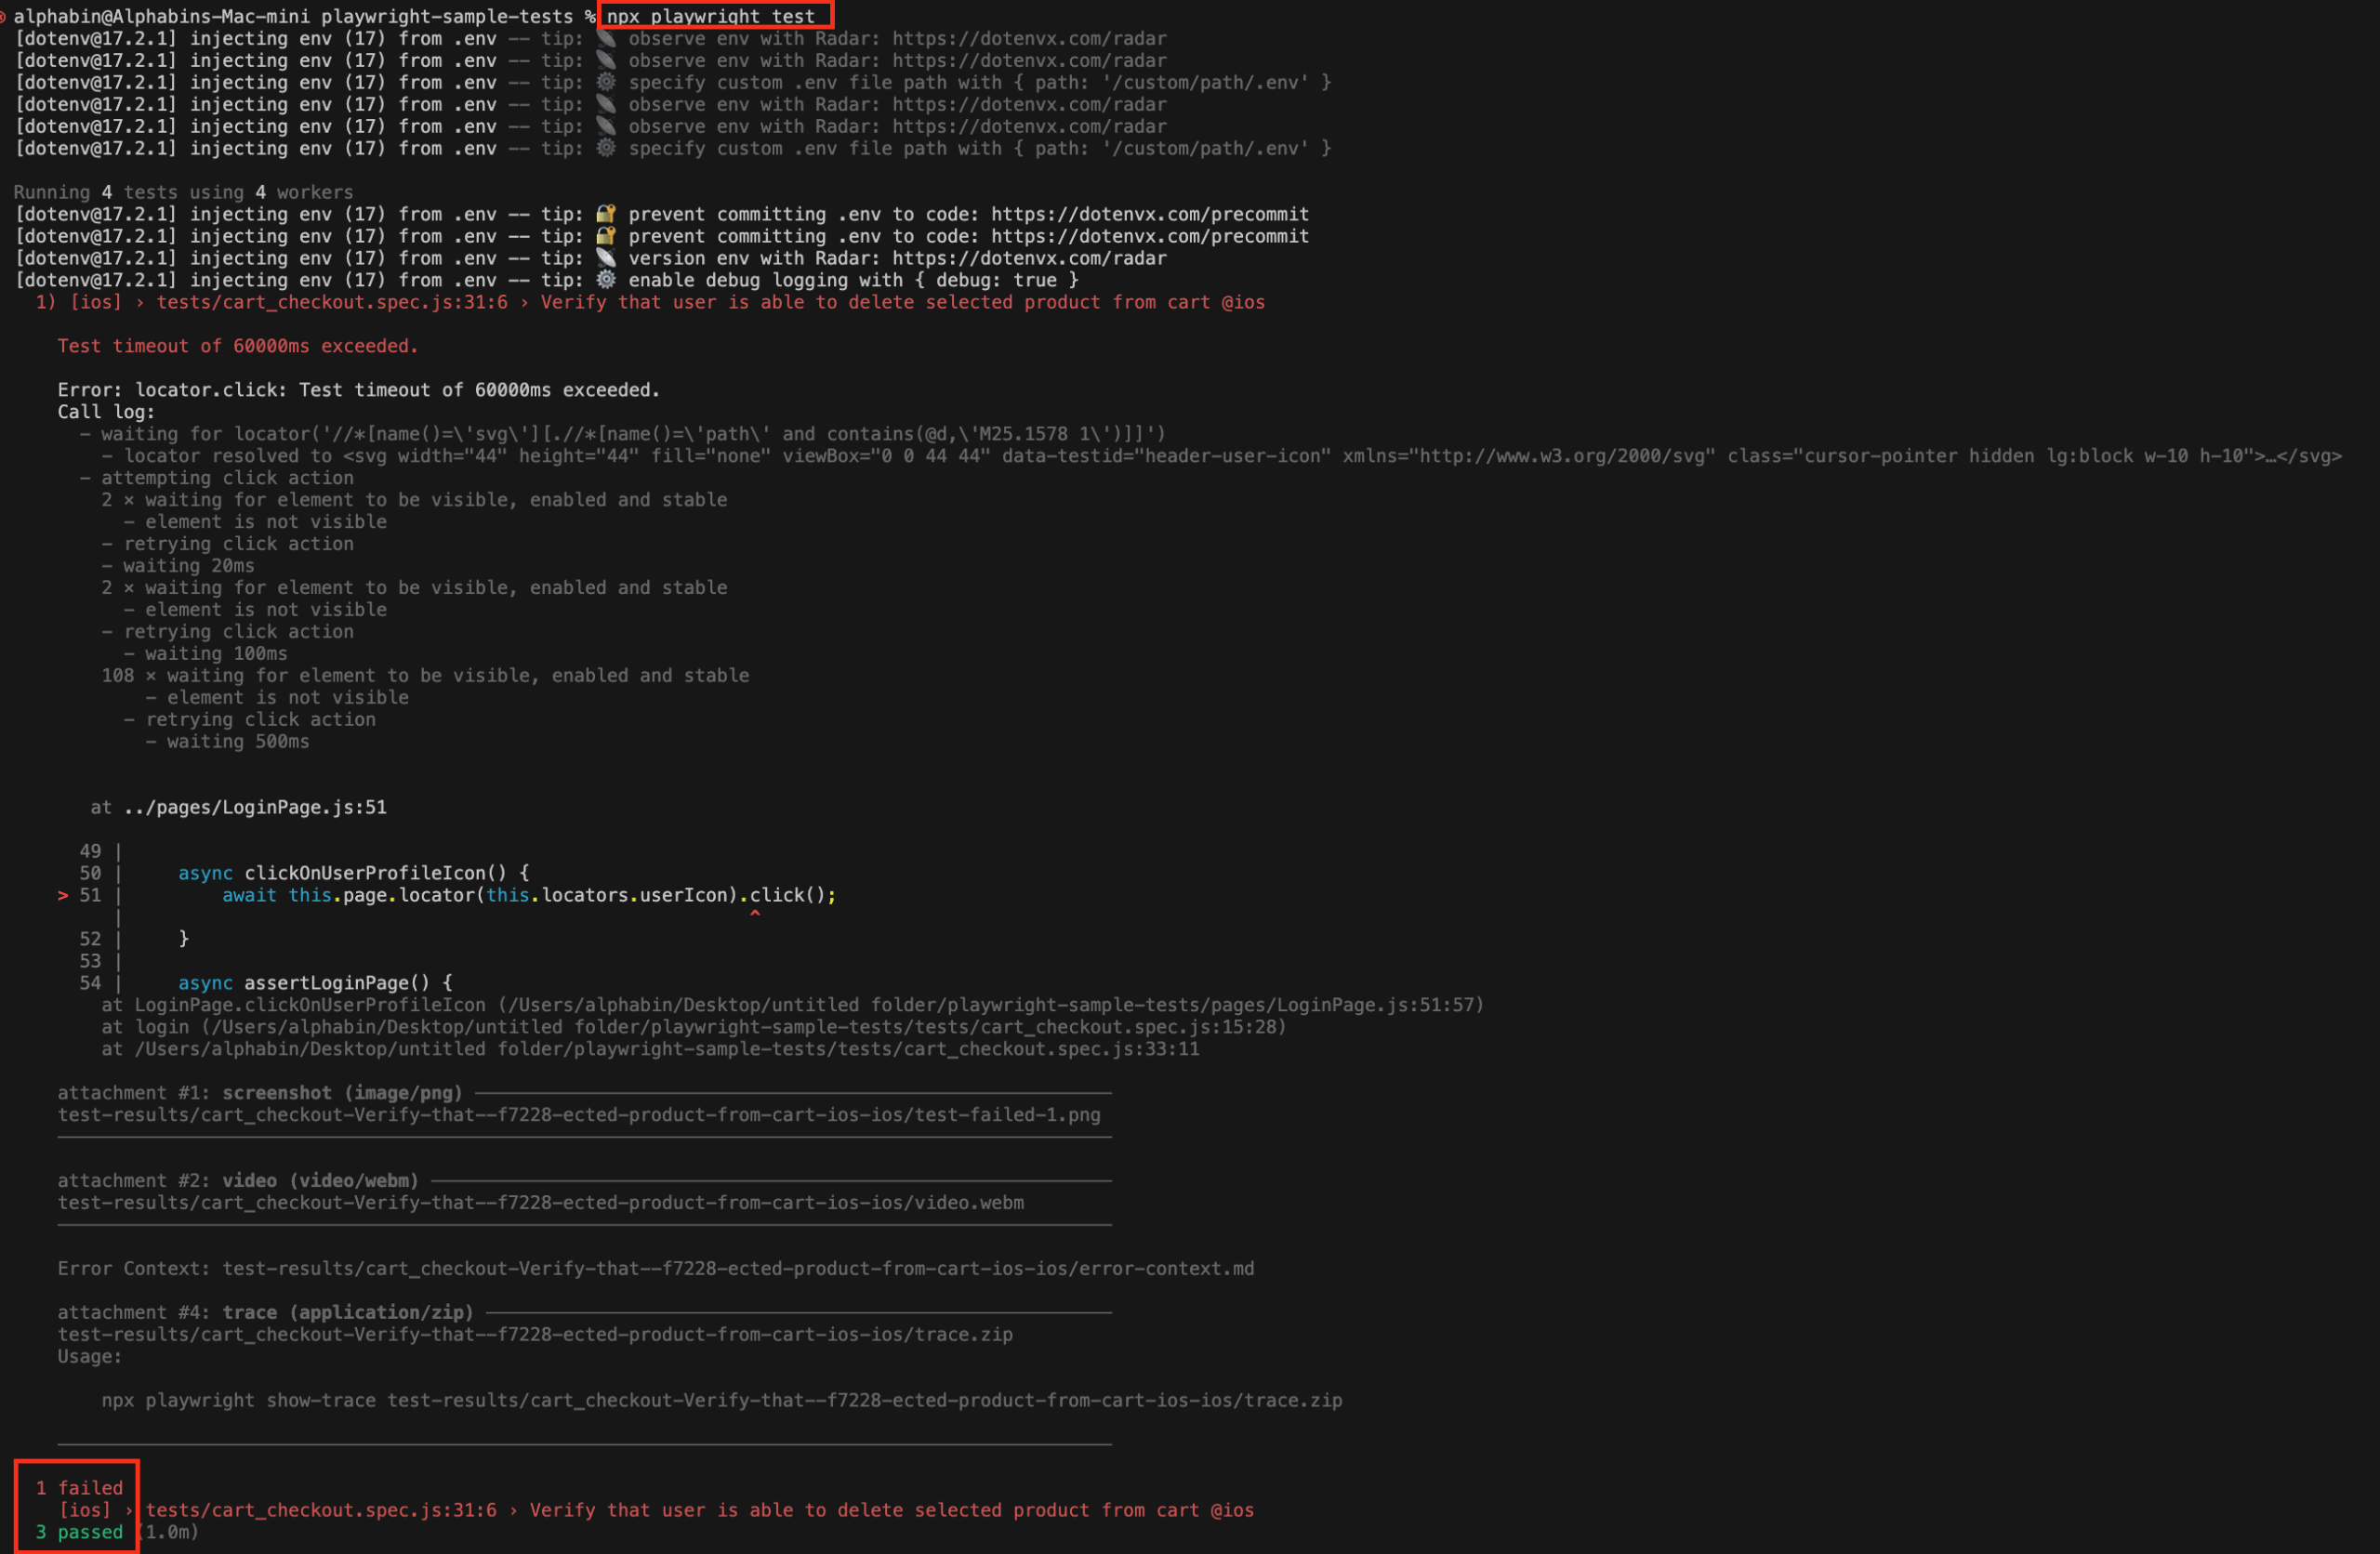
Step 3: Run Tests Locally
Run your tests as usual using Playwright. The configuration automatically generates the report folder and files.
npx playwright testThis produces a complete Playwright test report with JSON and HTML output.
Step 4: Upload Reports from Your Machine
To send reports to TestDino, run the upload command with your report directory and project token.
npx tdpw upload ./playwright-report --token="your-token" --upload-html-
--token="your-token" is your project token from the TestDino UI
-
--upload-html uploads HTML assets like screenshots and attachments
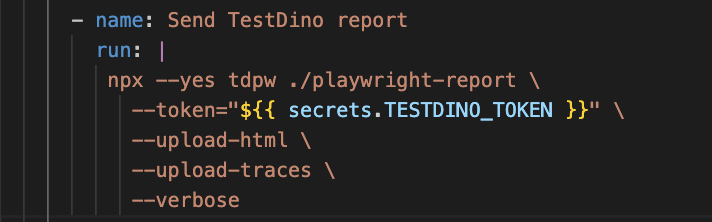
Step 5: Upload Reports from CI
In CI, uploads should run automatically after tests are complete. Store the token as a secret (for example, TESTDINO_TOKEN) and reference it in your workflow.
name: Playwright Tests
on:
  push:
  workflow_dispatch:

jobs:
  test:
    runs-on: ubuntu-latest
    container: mcr.microsoft.com/playwright:latest

    env:
      TESTDINO_TOKEN: ${{ secrets.TESTDINO_TOKEN }}

    steps:
      - uses: actions/checkout@v4

      - uses: actions/setup-node@v4
        with:
          node-version: '22.x'

      - name: Install dependencies
        run: |
          npm ci
          npx playwright install --with-deps

      - name: Run tests
        run: npx playwright test

      - name: Upload to TestDino Reporter
        if: always()
        run: npx tdpw upload ./playwright-report --token="${{ secrets.TESTDINO_TOKEN }}" --upload-html
Key points:
-
The upload runs after npx playwright test
-
if: always() ensures reports upload even if tests fail
-
The same CLI command works across different CI tools
Step 6: View Results in the TestDino Dashboard
Once uploads are complete, open the TestDino web app and navigate to your project's Test Runs.
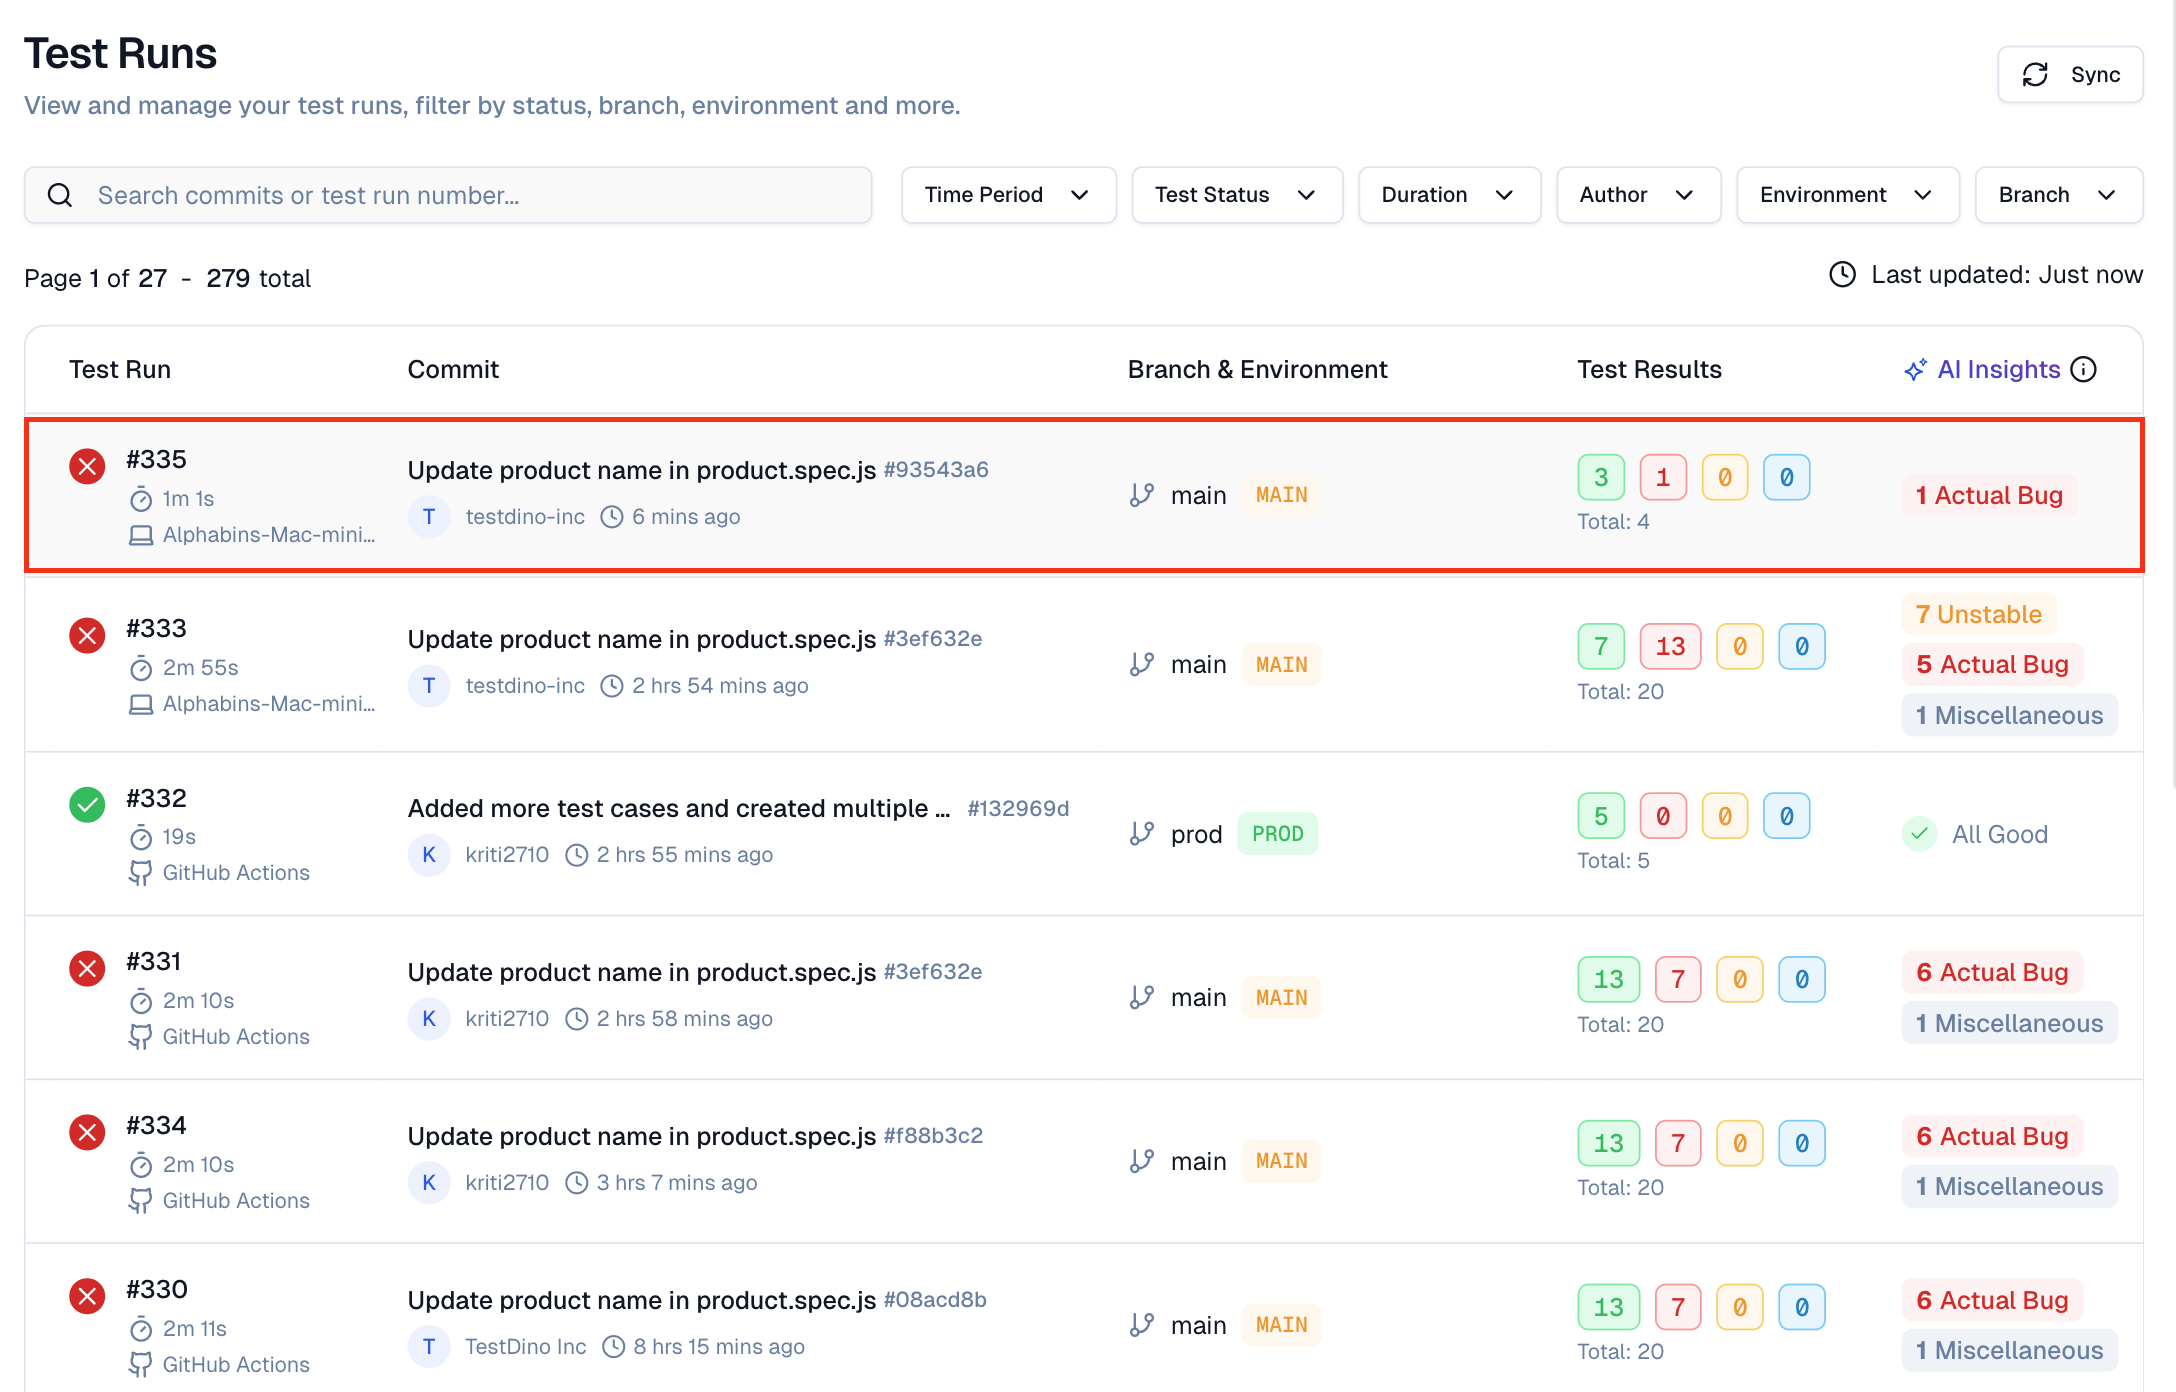
-
A list of recent runs with pass or fail counts and total duration
-
Filters for branches, authors, or environments
-
Each run expanded into a list of test cases with status and timing
Clicking a failed test shows:
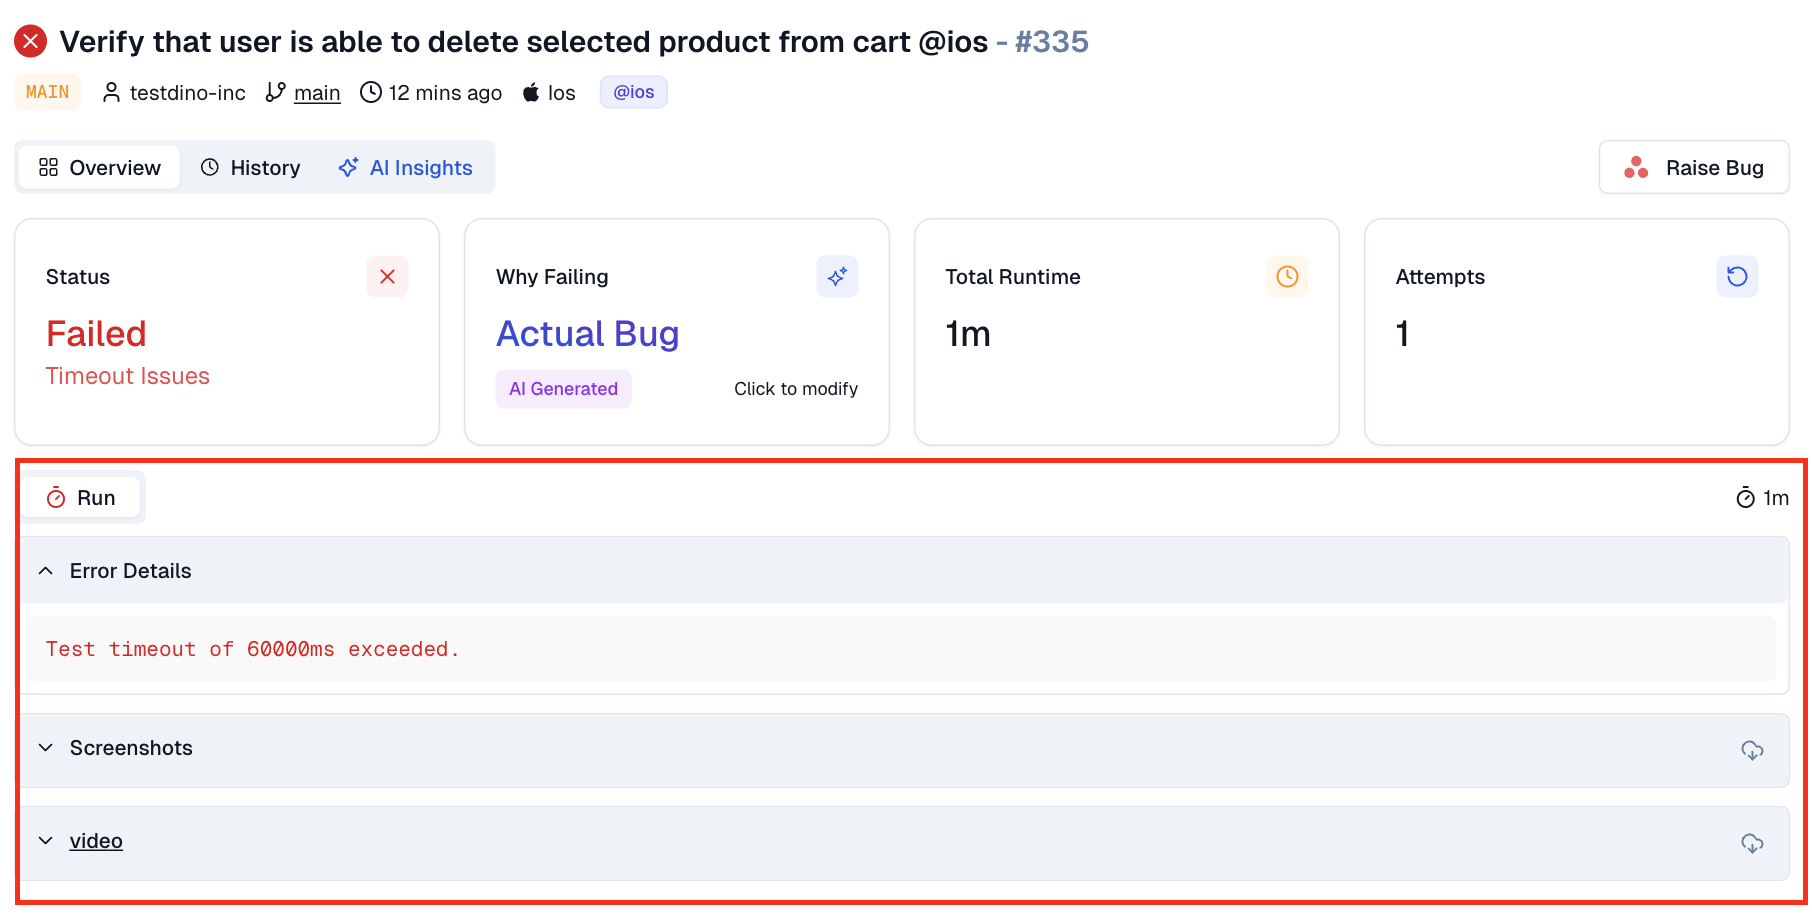
-
Error message and stack trace
-
Screenshots captured at failure
-
Links to traces if enabled in Playwright
-
AI hints that help separate real bugs from flaky tests or environment issues
Over time, this provides a single place to understand what failed, why it failed, and how often it happens.
With this setup, TestDino integrates directly into your existing Playwright reporting workflow while keeping npx playwright test unchanged.
Troubleshooting Common Playwright Reporting Issues
Even mature automation setups encounter Playwright reporting issues over time. Common problems include missing artifacts, empty Playwright test reports, or incomplete Playwright HTML reporter output in CI.
In most cases, these failures are caused by incorrect Playwright report configuration, path mismatches between local and CI environments, or insufficient CI permissions.
Fixing Missing or Empty Playwright Reports
When a Playwright report is missing or empty, start by validating the basics and eliminating silent failures early.
-
Ensure the Playwright report folder structure exists before test execution
-
Verify the Playwright HTML reporter and Playwright JSON report output paths in playwright.config.ts
-
Confirm CI pipelines explicitly upload Playwright test report artifacts
-
Check file system permissions on CI runners for report directories
-
Validate that parallel jobs correctly merge Playwright reports when sharding is enabled
Early validation of Playwright reporting prevents silent CI failures and ensures reliable test result visualization for debugging and audits.
Best Practices for Playwright Reporting
| Best Practice | Why It Matters | Playwright Reporting Impact |
|---|---|---|
| Standardize Playwright report configuration | • Ensures consistency across local and CI runs • Avoids environment-specific mismatches |
• Reliable Playwright test report output • Predictable Playwright HTML reporter behavior |
| Enable JSON and HTML reporters together | • JSON supports automation and analytics • HTML supports visual debugging |
• Full Playwright JSON report for tools • Rich Playwright HTML report for teams |
| Retain artifacts on test failure | • Screenshots explain UI issues • Traces show step-by-step execution |
• Strong Playwright test report evidence • Faster failed test debugging |
| Use retries only in CI environments | • Separates flaky tests from real failures • Avoids hiding bugs locally |
• Cleaner CI test reports • Better flake detection |
| Merge Playwright reports in parallel runs | • Parallel shards fragment results • Browsers report separately |
• Unified Playwright report • Accurate cross-browser coverage |
| Publish Playwright HTML reports as CI artifacts | • No need to rerun tests • Easy access for all roles |
• Faster triage using Playwright HTML reporter |
| Track results across multiple runs | • Single runs lack historical context • Trends reveal instability |
• Better Playwright reporting best practices • Improved test stability |
| Validate report paths and permissions early | • Prevents empty reports • Avoids silent CI failures |
• Reliable Playwright report configuration |
Conclusion:
Playwright reporting is a critical part of modern test automation, connecting raw execution data to confident release decisions.
A well-configured Playwright report with HTML and JSON output improves visibility, reduces debugging time, and ensures every Playwright test report clearly communicates pass, fail, and test evidence.
As teams scale Playwright in CI/CD, following Playwright reporting best practices and using analytics-driven tools transforms reporting from reactive troubleshooting into proactive quality control. With the right Playwright report configuration, teams spend less time chasing failures and more time shipping reliable software.
Use TestDino to instantly turn Playwright test reports into clear, actionable CI insights. 🚀
FAQs

Pratik Patel
Co-founder