Harness Overhead Benchmark: How Many Tokens 11 Coding Agents Burn Before the Test Starts
We measured 11 coding agents in one Playwright repo. The first call alone ranged from 1,894 to 31,798 tokens.
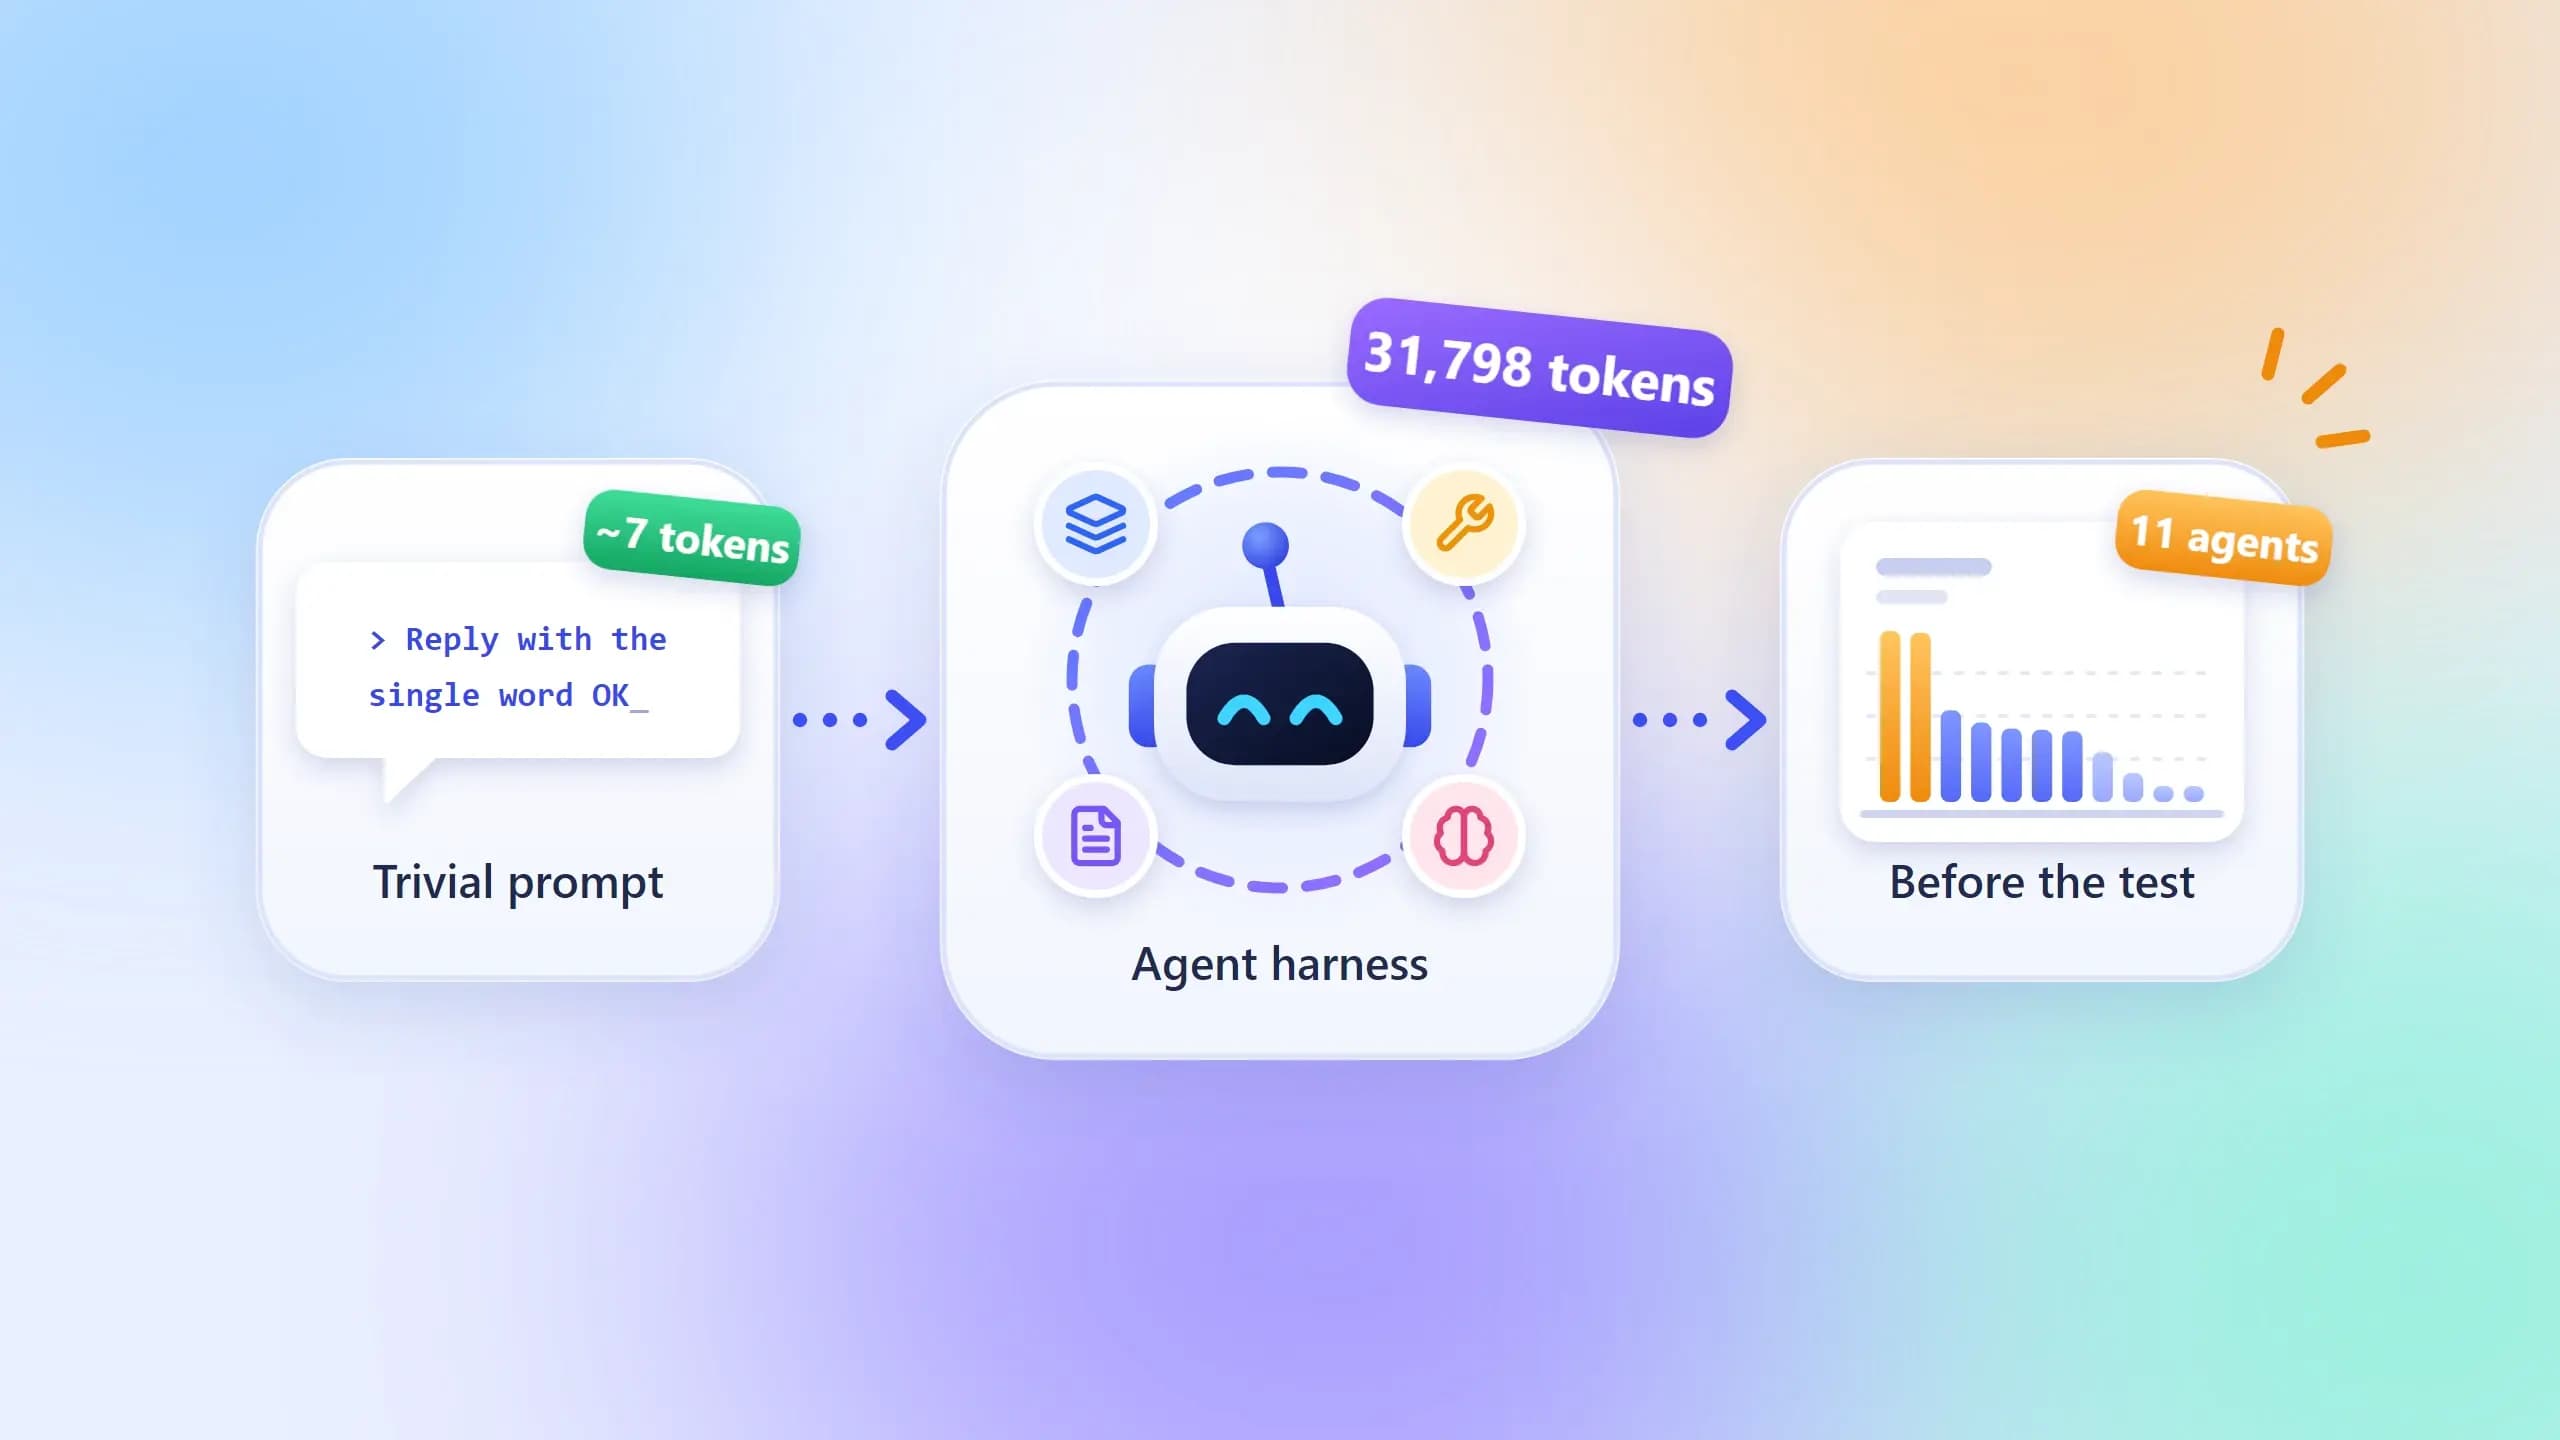
Ask a coding agent to reply with the single word OK and it will send somewhere between 1,894 and 31,798 tokens to the model to do it. That is the headline of this harness overhead benchmark, which we ran on 11 coding agents in one clean Playwright repo on 8 October 2026.
The pain is that none of that shows up in the terminal. You see a short answer and maybe a dollar figure, with no clue that the agent read 30,000 tokens of its own plumbing before it looked at your test, and that it will do so again on every step.
This guide shows the full ranked table, the method so you can rerun it, where the tokens go, what 5 independent studies say happens after the first call, and 7 fixes that cut the number without touching accuracy.
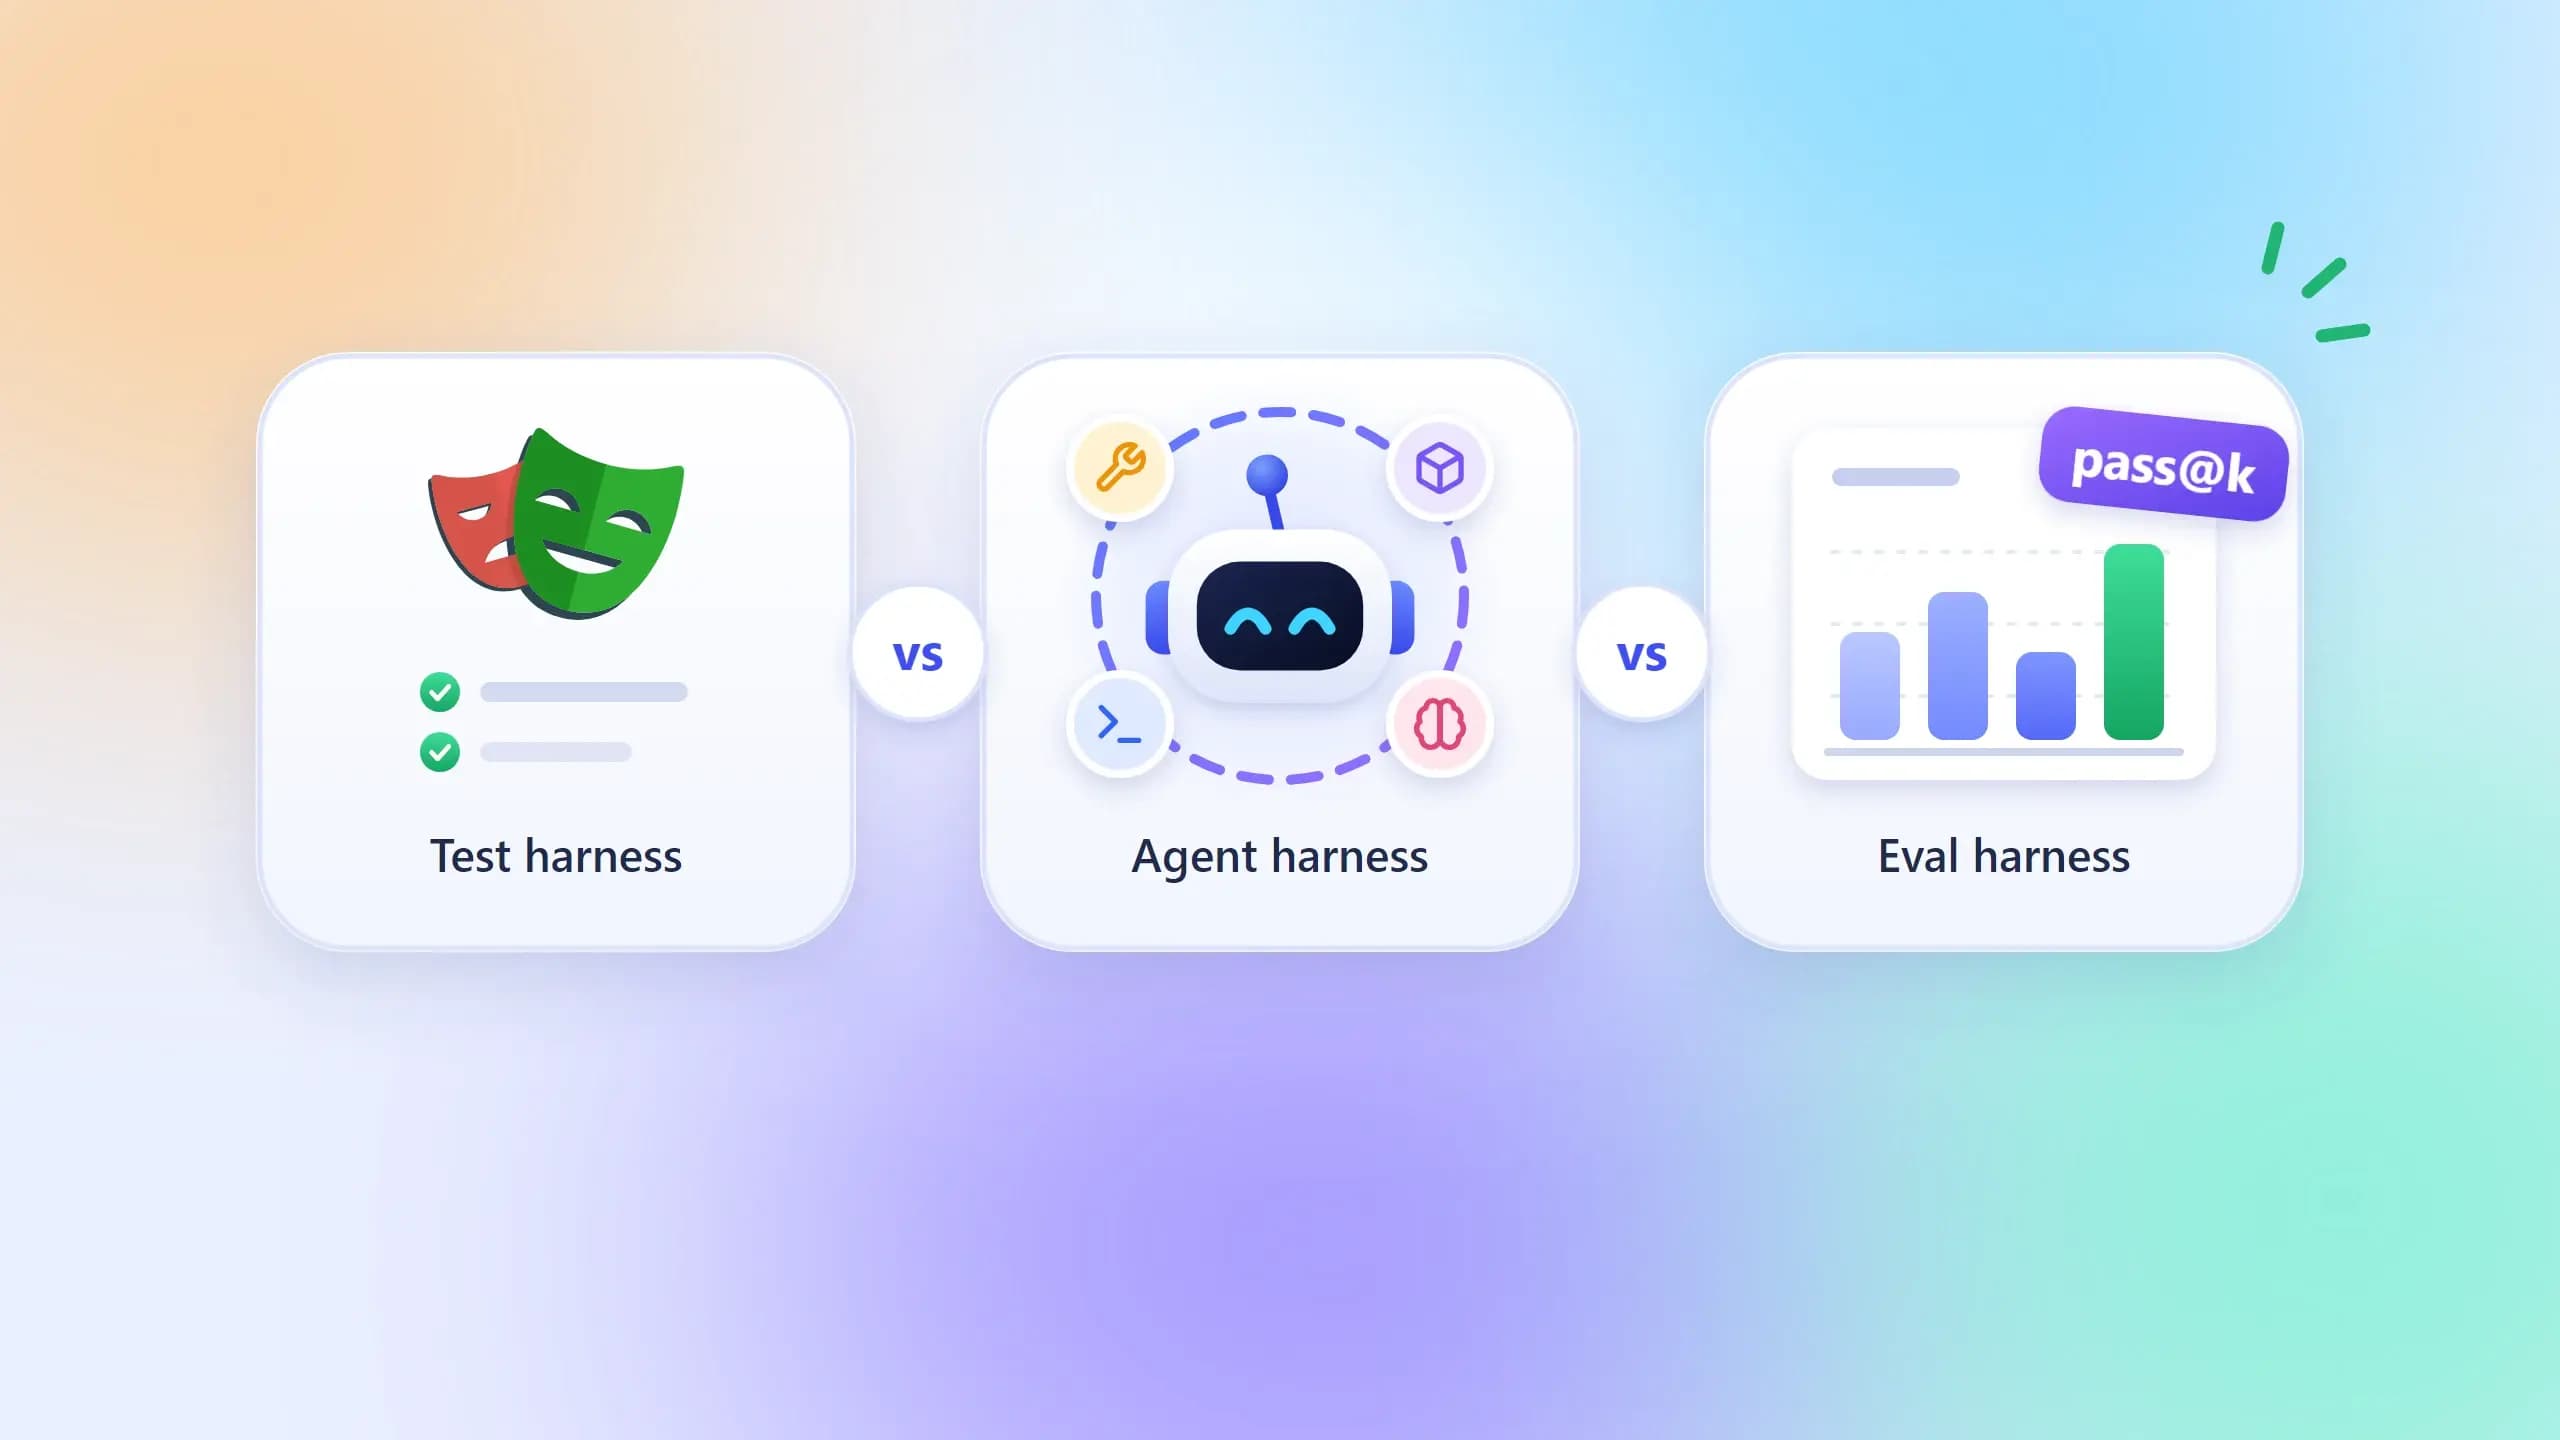
It builds on harness engineering and on the difference between a test harness vs agent harness, so those are good companions if the terms are new.
What a harness overhead benchmark measures
A harness overhead benchmark measures the input tokens a coding agent sends to the model that do not come from your task: its system prompt, tool schemas, instruction files, memory, and environment data. The cleanest version measures the very first call on a trivial prompt, because at that point the task contributes almost nothing and everything else is the harness.
The harness, the model, and the bill
A coding agent is 2 things glued together. The model is the part that reasons, and the harness is the loop around it that builds each request, runs the tools the model asks for, and feeds results back. Claude Code, Codex CLI, Cursor, Copilot CLI, Kiro, Cline, Gemini CLI, Qwen Code, OpenCode, Pi, and Aider are all harnesses.
The model has no memory between calls. So on every step, the harness re-sends everything: its own instructions, the list of tools, the files it has read, and the whole conversation so far. The vendor fixes the price per token, but the harness decides how many tokens get sent, and that is the number that lands on your invoice.
Why "before the test starts" is the fair comparison
Comparing agents on a real task mixes 3 things: how big the harness is, how many steps the model takes, and how lucky the run was. Comparing them on a one-word reply removes 2 of those. No file is read and no tool is called, so the input is the harness and nothing else.
That makes ai coding agent token overhead a property you can measure in a minute and compare across vendors, the same way ai agent evaluation metrics should isolate one variable at a time. With the metric defined, here is exactly how we collected it.
How we ran the harness overhead benchmark on 11 coding agents
The repo, the prompt, and the rule
Every agent opened the same folder: a minimal Playwright project with one config file, one spec file, a README, and a git history of one commit.
There were no agent instruction files, no MCP servers, and no skills in the repo. Where an agent reads user-level config, we used a clean profile and recorded the real profile separately.
The prompt was always the same 7 words: reply with the single word OK. We ran it in each agent's headless mode and recorded the first model call's input tokens as the sum of uncached input, cache writes, and cache reads. Each agent ran 3 times and the table reports the median.

Where each number came from
Most agents print usage when you ask for JSON output. Claude Code, Codex CLI, Cursor, Copilot CLI, Gemini CLI, Cline, OpenCode, and Pi all do. Qwen Code prints a session total that includes background memory calls, so we took the main request's prompt token count from its own session log instead.
Kiro CLI does not expose API usage in headless mode, so its number is the context estimate it writes to its debug log before the first message, with tools, system, and context files itemized. Aider reports a rounded total, which is why its row says 2.5k rather than an exact figure.
claude -p "Reply with the single word OK" --output-format jsonThat one command is the whole measurement for Claude Code. The usage object carries input_tokens, cache_read_input_tokens, and cache_creation_input_tokens, and the Claude API docs define total input as the sum of the 3. Every other agent has an equivalent flag, listed in the table below.
| Agent | Version tested | Default model it picked | Headless command and usage source |
|---|---|---|---|
| Claude Code | 2.1.293 | Claude Opus 5.5 | claude -p --output-format json, usage object |
| Codex CLI | 0.161.0 | GPT-6.1 Sol | codex exec --json, turn.completed usage |
| Cursor CLI | 2026.10.01 | Auto | agent -p --output-format json, usage object |
| Copilot CLI | 1.0.93 | mai-code-1.1-flash | copilot -p --output-format json, usage checkpoint event |
| Kiro CLI | 2.28.0 | auto | kiro-cli chat --no-interactive, debug log context estimate |
| Cline CLI | 2.11.0 | GPT-6 Astra via Cline | cline --json -y, run_result usage |
| Gemini CLI | 0.59.0 | Gemini 3.8 Flash | gemini -p --output-format json, stats.models |
| Qwen Code | 0.25.0 | Gemini 3.7 Flash (API key) | qwen -p --output-format json, session log prompt count |
| OpenCode | 1.18.35 | Gemini 3.6 Flash (API key) | opencode run --format json, step tokens |
| Pi | 0.73.1 | Gemini 3.7 Flash (API key) | pi -p --mode json, message_end usage |
| Aider | 0.86.2 | Gemini 2.5 Flash (API key) | aider --message, tokens sent line |
One honest caveat before the numbers. Each vendor agent ran its own default model, so the counts come from 4 different tokenizers.
The prefix is a harness property, not a model property, so the ranking holds, but a 5 to 10% gap between neighbours should be read as a tie. Amp was in the original list and was dropped because it requires paid credits; Aider took its slot.
Results: tokens burned before the test starts, ranked
The ranked table
Here is the full agent harness comparison from the harness overhead benchmark. The spread between the lightest and heaviest harness is 16.8 times, and the top 2 are within 1% of each other.

| Rank | Agent | First-call input tokens (median of 3) | Of which served from cache on reruns | Note |
|---|---|---|---|---|
| 1 | Kiro CLI 2.28 | 31,798 | not reported | Own estimate; 31,722 of it is tool schemas |
| 2 | Claude Code 2.1.293 | 31,480 | 15,919 to 17,809 | Clean profile; real profile 34,161 |
| 3 | Copilot CLI 1.0.93 | 17,059 | 1,280 to 16,640 | System segments total 5,502; the rest is tools and schema |
| 4 | Codex CLI 0.161 | 14,768 | 12,544 | Clean profile; real profile with 2 plugins 14,851 |
| 5 | Qwen Code 0.25 | 13,677 | 8,148 | Main request only; background memory calls excluded |
| 6 | OpenCode 1.18 | 13,437 | 11,398 | Identical across all 3 runs |
| 7 | Cursor CLI 2026.10 | 13,174 | 3,840 to 13,056 | Model "Auto"; identical across 3 runs |
| 8 | Gemini CLI 0.59 | 9,290 | 4,066 | Plus a separate 828-token routing call to Flash Lite |
| 9 | Cline CLI 2.11 | 5,382 | 5,379 | Identical across all 3 runs |
| 10 | Aider 0.86 | 2.5k | not reported | Aider rounds; 605 on a model with the shorter "whole" edit format |
| 11 | Pi 0.73 | 1,894 | 0 | Identical across all 3 runs |
The 30,000-token club
Kiro CLI and Claude Code both cross 31,000 tokens before anything happens. Kiro's own breakdown is the clearest evidence of why: 31,722 of its 31,798 tokens are tool definitions, with 58 for the system prompt and 18 for context files. The harness ships a large toolbox and the model must read the whole catalogue on every call.
Claude Code's clean-profile figure of 31,480 is almost double the 16,581-token preamble that Liu and Han measured on Claude Code 2.1 earlier this year, which suggests the built-in tool set has kept growing between releases.
Add a global CLAUDE.md, auto memory, and 3 MCP servers, as on our real machine, and the first call rises to 34,161.
That matters for a comparison like Claude Code vs Cursor, where Cursor's CLI came in at 13,174 on the same prompt, less than half of Claude Code's clean number.
The 13,000-token middle
Five agents land between 13,000 and 17,100 tokens: Copilot CLI, Codex CLI, Qwen Code, OpenCode, and Cursor. Three of them are within 500 tokens of each other, which is inside the tokenizer noise, so treat Qwen Code, OpenCode, and Cursor as a tie in this harness overhead benchmark.
Codex CLI is the interesting one for teams writing Playwright tests with Codex, because 12,544 of its 14,768 tokens came back as cache hits even on a fresh profile.
The prefix matched runs made minutes earlier on the same account, so the uncached part of a Codex first call was only about 2,200 tokens.
The under-6,000 tail
Cline, Aider, and Pi show how small a working harness can be. Pi sends 1,894 tokens, and its prompt stayed identical across all 3 runs with zero cache reads, which is what a truly minimal prefix looks like. Aider sits around 2,500 tokens on a model it has an edit-format profile for, and drops to 605 on one it does not.
Cline's 5,382 is notable because it runs a frontier model, GPT-6 Astra, with a prefix one sixth the size of Claude Code's. The next section explains what fills the difference.
Where the first call's tokens actually go
Anatomy of one request
Every request has a fixed part and a growing part. The fixed part is the harness: system prompt, tool schemas, instruction files, and environment data. The growing part is the conversation, which starts near zero and swells with every file read and test log.

On a one-word prompt, the growing part is 7 words. So the benchmark table above is, to within a rounding error, the fixed part of each harness, which is the part you pay for on every one of the 50 to 90 steps a real task takes.
Tool schemas are the heavy part
Two agents itemize their own prefix, and both point at the same culprit. Kiro attributes 99.8% of its 31,798 tokens to tools.
Copilot CLI's usage event lists 18 system segments that add up to only 5,502 tokens, with tool instructions the largest at 3,794, leaving roughly 11,500 of its 17,059 tokens that the event does not itemize, most likely the tool schemas themselves.
| Copilot CLI system segment | Tokens |
|---|---|
| tool_instructions | 3,794 |
| environment_limitations | 244 |
| code_change_instructions | 228 |
| final_instructions | 223 |
| tool_efficiency | 188 |
| dynamic_guidelines | 147 |
| environment_context | 127 |
| 11 smaller segments combined | 551 |
| Total system segments | 5,502 |
Anthropic's own tool search documentation says the same thing from the API side: a typical multi-server MCP setup can consume about 55k tokens in definitions before the model does any work, and tool selection accuracy degrades once you pass 30 to 50 tools.
That is why adding Playwright MCP with 20-plus tools to a heavy harness is a decision worth measuring first.
Note: Claude Code defers MCP tool schemas by default and loads them on demand through tool search, so the whole user layer on our real machine, a global CLAUDE.md, auto memory, and 3 MCP servers, added only about 2,700 tokens. The 31,480 clean figure is almost entirely built-in tools and system prompt, which you cannot trim from the outside.
What your own config adds on top
The clean-versus-real pairs in the table show the user-controlled layer. For Claude Code, a 1,732-byte global CLAUDE.md, an auto-memory file, and 3 MCP servers added 2,681 tokens, about 8.5%. For Codex CLI, 2 enabled plugins added 83 tokens. On the first call, the vendor's defaults dominate; your config is the smaller lever.
The exception is anything that loads tool schemas upfront. Anthropic's 55k-token multi-server example is 29 times the entire Pi prefix, so one upfront MCP server can outweigh everything else in this table.
Knowing the pieces is useful, but the real argument comes from what happens after the first call, which is what 5 research teams measured this year.
What 5 independent studies add: the overhead multiplies by every step
The first call is the unit, the step count is the multiplier
Our benchmark stops at the first call on purpose. The published studies pick up from there and show that the prefix is re-sent on every step, so total overhead is roughly prefix times steps.
Liu and Han, in "What Does a Harness Buy? Tokens, Mostly." on arXiv in October 2026, measured mean step counts of 88 for Claude Code and 55 for OpenCode on hard SWE-bench Verified tasks.
Apply that to our table and a 31,480-token prefix becomes about 2.8 million prefix tokens over an 88-step task, before a single file read is counted. A 1,894-token prefix over 55 steps is about 104,000. Caching discounts both, as the next section shows, but it does not change the ratio.
Same model, different harness: the cost gap without the accuracy gap
| Study (2026) | Harnesses compared | Overhead finding | Accuracy finding |
|---|---|---|---|
| Liu and Han, arXiv 2610.04433 | Claude Code, OpenCode, mini-SWE-agent | Preamble 16,581 vs 7,025 vs 829 tokens per step; up to 3x cost per trial | Heaviest and lightest harness equal within 5 points on 447 tasks |
| PointFive, arXiv 2608.01347 | Claude Code, PI.DEV | Prefix 12 to 15x larger; 5 to 30x cost per success | No success gain from the larger harness |
| HarnessTax, Berkeley Sky Lab and Arena | Claude Code, Codex CLI, Pi | 2.0x Pi and 1.6x Codex cost on SWE-bench Lite | Harness effect within ±2% (SWE-bench Lite) and ±5% (Terminal-Bench 2.0) |
| Vats and Golev, arXiv 2607.22585 | Goose, OpenHands-SDK, OpenCode | Up to 40x tokens per solved task | Pass-rate spread of 0 to 8 points |
| Fan et al., arXiv 2609.20804 | One modular harness, 176 settings | Bash-only action space cut cost 53% (SWE-Bench) and 30% (Terminal-Bench) on the largest model | Comparable success at lowest cost in 7 of 8 panels |
The PointFive study measured Claude Code's prefix at 15,983 to 20,330 tokens against 1,147 to 1,642 for PI.DEV, a 12 to 15 times gap.
Our Claude Code and Pi rows show 31,480 against 1,894, a 16.6 times gap, so the ratio has held or widened since that paper ran. The same study found the user prompt was under 1% of logical input on Claude Code.
HarnessTax, from UC Berkeley Sky Lab and Arena, puts a price on the coding agent harness tax: on SWE-bench Lite with Claude Fable 5, an attempt cost 1.33inClaudeCodeand1.33inClaudeCodeand0.67 in Pi, with nearly identical turn counts of 15.3 and 15.4.
Its authors traced the gap to an initial context over 10 times larger, which matches what we measured directly.
Why the extra tokens rarely buy accuracy
Across all 5 studies, the heavier harness never bought a clear win. Liu and Han found Claude Code and mini-SWE-agent "equivalent within five points" on 447 tasks. HarnessTax kept the harness effect within 2 points. Vats and Golev saw 0 to 8 points of spread against a 40x token spread.
Liu and Han also measured noise. Swapping the harness flipped about 13% of hard tasks, and rerunning the same harness flipped about the same number.
A one-off comparison on 20 tasks cannot tell harness from luck, the same lesson a good flaky test benchmark teaches about test suites.

Tip: Read a harness overhead benchmark as a budget line, not a quality signal. The studies agree a heavy harness buys fewer ways to lose a task, such as avoiding context overflow, rather than more wins. Pick the harness whose failure modes you can live with, then measure tokens per solved task on your own repo.
That framing is also how our e2e test performance benchmarks treat runtime and cost, next to pass rate rather than behind it.
For a QA team, the useful harness gives the agent a sandbox, a verification loop, and a clean exit, the design in our state of QA harness report, not the longest system prompt.
There is one more variable between the token column and the invoice, and skipping it is the most common mistake in harness comparisons.
Prompt caching: why the bill is smaller than the token count
How much of the prefix you actually pay for
Every vendor now caches the unchanged start of a request, and the table above shows it working. On reruns, 12,544 of Codex CLI's 14,768 tokens, 11,398 of OpenCode's 13,437, and 5,379 of Cline's 5,382 came back as cache reads. Cursor's second accounting showed 13,056 of 13,174 served from cache.
On the Claude API, the documentation prices cache reads at 0.1 times the base input rate for most models, 0.05 times on Opus 5.5 and Sonnet 5.5, and 0.025 times on Fable 5.1. Writing to a 5-minute cache costs 1.25 times base and a 1-hour cache costs 2 times base.
| Token type (Claude API) | Multiplier on base input price |
|---|---|
| Uncached input | 1.0x |
| 5-minute cache write | 1.25x |
| 1-hour cache write | 2.0x |
| Cache read (most models) | 0.1x |
| Cache read (Opus 5.5, Sonnet 5.5) | 0.05x |
| Cache read (Fable 5.1) | 0.025x |
Claude Code's own cost estimate for the one-word reply made the write premium visible. On the clean profile with Opus 5.5 it reported $0.05 on a run that mostly read cache and $0.13 on a run that wrote 15,553 tokens to a 1-hour cache.
On the real profile with Fable 5.1, which wrote 17,843 tokens, it reported $0.36 for the word OK.
Why cache savings are not efficiency
Both research teams that measured caching add the same warning. PointFive states that cache savings "must never be reported as efficiency," because caching changed nothing about the agent's behavior. It only discounted the same waste.
Liu and Han measured cache hits at 96 to 99% of input tokens and still found up to 3 times the cost per trial between harnesses.
The tokens still occupy the context window, still push you toward compaction sooner, and still count toward rate limits. That is why Playwright CI cost optimization should look at context size, not only at the invoice.
The cache also breaks easily. Claude Code's prompt caching documentation lists the actions that invalidate it mid-session:
- Switching models or, on most models, changing effort level
- Connecting or removing an MCP server when tools load upfront
- Enabling or disabling a plugin that provides MCP servers
- Denying an entire tool by name
- Compacting the conversation, which rebuilds the conversation layer
- Upgrading Claude Code, which usually changes the system prompt
Note: Anthropic's April 2026 engineering post on prompt caching explains why Claude Code keeps every tool in every request and uses EnterPlanMode and ExitPlanMode as tools: swapping the tool set when you enter plan mode would break the cache. Deferred tool stubs exist for the same reason, and they are also why the built-in prefix is hard to shrink.
Each invalidation re-processes the full prefix at the uncached rate once. The practical rule is to pick model and effort at the top of a session and save compaction for natural breaks.
Session-level totals live in Claude Code's /usage command, which since version 2.1.251 also shows the share of input served from cache, the same split a test analytics dashboard should show for test runs.
7 ways to cut ai coding agent token overhead without losing accuracy
Shrink the fixed prefix
- Pick a lighter harness for the job. The table is the lever. Pi, Aider, and Cline do real work under 6,000 tokens, and the studies show the heavy harnesses do not win on pass rate. For scripted CI tasks, the light end of the table is the default to beat.
- Defer tool schemas. Anthropic recommends tool search once you have 10 or more tools or definitions over 10k tokens. In Claude Code, MCP tools are deferred by default, and ENABLE_TOOL_SEARCH=auto loads them upfront only while they stay under 10% of the context window.
- Prefer CLIs over MCP where you can. Claude Code's cost documentation notes that tools like gh and aws add no per-tool listing at all. Our Playwright CLI vs MCP comparison shows the same trade-off for browser automation.
- Keep CLAUDE.md under 200 lines. That is Anthropic's published guidance. Our 1,732-byte global file plus memory plus 3 servers cost 2,681 tokens per call, so a bloated one can cost 10 times that. Move workflow instructions into skills, which load only when invoked.
Shrink what grows per step
- Filter tool output before the model sees it. A hook that pipes test output through a failure filter turns tens of thousands of tokens into hundreds, as the Claude Code docs demonstrate with a test-runner example.
- Delegate verbose reads to subagents. File contents stay in the subagent's window and only a summary returns. The same docs warn the other way too: agent teams use about 7 times the tokens of a normal session.
- Stop asking for multiple approaches. PointFive found that phrase multiplies reasoning tokens 2.4 to 7.4 times with zero success gain. Ask for one approach and an explicit stopping rule instead.
Tip: Do these in order. The first 4 cut the prefix that is multiplied by every step, so they pay off on every task. The last 3 cut the growing part, so they pay off most on long debugging sessions with big logs and traces.
The tool-surface choice deserves its own evidence, because for browser testing it is the single largest lever TestDino has measured.
The same model on 2 Playwright tool surfaces
On 26 September 2026, TestDino ran 13 assertions on a login flow at storedemo.testdino.com with the same model behind 2 interfaces. Claude Opus 5 through the Playwright CLI used 56,874 input tokens for the run. The same model through Playwright MCP used 210,153, about 3.7 times more, for identical verdicts on every assertion.

The 2 small bars are Jev, a decision model from TypeSafe AI that TestDino tested in the same run at 2,811 and 2,775 tokens. We cover that setup in Jev with Playwright.
The point for this post is the 2 tall bars: the model never changed, only the amount of page state the harness pushed through it on each step.
If you give Claude Code a browser through the playwright-skill, the skill routes the agent to the CLI first, which is the cheaper surface in this data. Those choices add up once an agent is writing and repairing tests across a whole suite, which is where the QA angle comes in.
What this means for Playwright and QA teams
Overhead compounds across a test suite
A single agent run is cheap. A nightly job where an agent triages 40 failures, re-reads 40 traces, and proposes 40 fixes is 40 sessions, each carrying its full prefix on every step.
At the Claude Code enterprise average of about $13 per developer per active day that Anthropic publishes, the harness choice can be the difference between a line item and a budget review.
The place to start is the test data the agent consumes. Trace files, screenshots, and full HTML reports are exactly the verbose tool results the filtering advice targets.
That is also the context you add when you run Claude Code with Playwright and let it read trace output.
A reporting layer that hands the agent a short failure summary, with the failing step, the locator, and the last network call, cuts the growing part of the context before the model sees it. That is how we think about Playwright test reporting for agents as well as people.
Choose the agent by tokens per fixed test
When teams compare agents for test work, pass rate on a demo app tends to dominate the decision. This benchmark argues for a second column: tokens before the test starts, and then tokens per solved task on your own suite with the same model.
Our roundup of agentic testing tools compared uses that framing. The guidance on how to test AI-generated code covers the verification loop that keeps a cheap harness from shipping a wrong fix.
For the CI side of the same budget, you can model the monthly cost of shards, reruns, and dead tests with TestDino's free tools, which include a CI budget calculator and a trace configurator for estimating artifact size before the agent ever reads it.
Conclusion
This harness overhead benchmark found a 16.8 times spread in what 11 coding agents send before they do anything: 1,894 tokens for Pi, about 2,500 for Aider, 5,382 for Cline, 9,290 for Gemini CLI, a 13,000 to 17,100 band for Cursor, OpenCode, Qwen Code, Codex CLI, and Copilot CLI, and over 31,000 for Claude Code and Kiro.
Tool schemas, not instructions, explain most of the top.
Five independent studies then show that number is re-sent on every one of 50 to 90 steps, that caching discounts it without removing it, and that the heavier harness almost never buys accuracy.
The practical response is to treat ai coding agent token overhead as something you measure and manage, starting with the one-command test in this post.
Then pick the lightest harness whose failure modes you can live with, defer tools, trim always-on instructions, filter tool output, and use the cheaper tool surface for the browser. The numbers here are a snapshot from 8 October 2026 at the versions listed, so rerun the method before you decide.
For QA teams, the biggest single lever is the data the agent reads, which is why shorter failure summaries matter as much as shorter prompts. That is the same discipline behind good AI agent testing: control what goes into the loop, and the cost and the quality both follow.
FAQs

Ayush Mania
Forward Development Engineer