Top 5 Playwright Test Management Tools
Discover the top 5 Playwright test management tools that help teams organize tests, track results, and scale QA with confidence.

Running Playwright tests can be tricky when it's unclear which scenarios passed, which failed, and how results tie back to your requirements and releases. As teams scale automated testing in CI/CD pipelines, tracking coverage and outcomes only gets harder, and Playwright was built to run tests, not manage them.
Test management tools for Playwright fill that gap. They organize test suites, centralize results, link failures to defects and releases, and give QA and dev teams clear visibility across the testing lifecycle.
In this guide, we'll review the top 5 Playwright test management tools, compare their key features, and help you pick the right one.
Best Playwright test management tools at a glance
Why Playwright teams need a test management tool
Playwright handles multi-browser testing, auto-waits, and parallel execution out of the box. It is the fastest-growing browser automation framework for good reason. But Playwright was built to run tests, not to manage them.
Once a test suite grows beyond ~100 tests, Playwright does not track which tests are flaky over time. It does not connect test failures to specific pull requests. It does not calculate how much CI time your test suite wastes. And it does not give your QA lead a clear picture of test coverage across sprints or a place to keep the manual test cases that sit alongside your automated ones.
A test management tool designed specifically for Playwright fills these gaps by sitting atop your existing Playwright setup, ingesting test results, storing your test cases, and adding the intelligence layer that Playwright lacks.
Teams that run 100+ Playwright tests without a dedicated tool tend to hit the same problems:
-
Flaky tests erode trust. Developers start ignoring failures because "that test is always flaky." Real bugs slip through unnoticed.
-
CI pipelines slow down. There is no visibility into which tests are slow, redundant, or need a different parallelization strategy.
-
Manual triage burns hours. Engineers spend 30 to 60 minutes per day investigating failures that turn out to be infrastructure issues rather than actual bugs.
-
No link between tests and requirements. PMs ask "is feature X tested?" and nobody can give a quick answer.
-
Manual and automated testing live in two worlds. Manual cases sit in one tool, Playwright results in another, and nobody can see coverage across both.
-
Reporting is an afterthought. Test results sit in CI logs. Getting a sprint review summary means exporting CSVs and building slides by hand.
What is the best test management tool for Playwright?
For Playwright teams, TestDino is the best-fit test management tool: it combines full test case management, nested suites, multiple classification fields, custom fields, version history, and native manual testing (releases, runs, sessions), along with native Playwright reporting, flaky detection, and AI failure analysis in one platform.
Jira-native tools (Xray, Zephyr Scale) suit teams that must keep test management within Atlassian; qTest suits enterprises that need formal requirement traceability.
The evolution of test management: From spreadsheets to AI-native
The history of test management tools explains why most of them are a poor fit for modern Playwright workflows. Each generation solved the previous one's problems while introducing new limitations.
Phase 1: Spreadsheets (Pre-2010), reactive, manual record-keeping
The first version of test management was a shared spreadsheet. Teams maintained Google Sheets or Excel files with columns for test case name, steps, expected result, and pass/fail status. It worked for small teams running fewer than 100 test cases.
The problems were obvious. No version control. No CI/CD integration. No automated execution tracking. Constant merge conflicts when multiple testers edited the sheet at the same time. The spreadsheet recorded what had already happened and relied entirely on a human to decide what to do about it.
Phase 2: Cloud test management tools (2010–2022), reactive, digitized spreadsheets
The next generation replaced spreadsheets with dedicated cloud platforms like TestRail, Zephyr, qTest, and PractiTest. These tools moved the spreadsheet experience into a web UI. Instead of rows in Excel, teams got folders, filters, and API endpoints.
But the core model stayed the same. These tools put manual QA engineers at the center of every action. Someone had to manually write test cases, fill in test steps, update expected results, and record execution outcomes. Every field, every status change, every link to a Jira ticket required a human.
Teams lost interest fast. In agile environments where the application changes every sprint, nobody has time to update 300 test cases in a web form after every feature change. The documented test cases in the management tool drifted out of sync with what the Playwright tests actually covered. Two disconnected sources of truth emerged: the Playwright test code in Git (current and accurate) and the test case records in the management tool (weeks or months stale). The tool that was supposed to provide visibility ended up providing outdated information.
Phase 1 and Phase 2 tools were reactive. They recorded what already happened and waited for a human to act on it. A test failed? You investigated. Test coverage was missing? You found out during a production incident. Neither generation told you what to do next.
Phase 3: AI-native test management (2023–present), proactive, intelligence-first
Phase 3 changes the operating model entirely. AI-native Playwright test management platforms like TestDino treat your Playwright test code as the single source of truth and apply intelligence on top. They do not wait for problems to surface. They find them before they become incidents.
This is the shift from reactive to proactive.
An AI-native platform classifies test failures automatically using historical patterns. It detects flaky tests by analyzing pass/fail data across hundreds of CI runs. But it goes further than diagnostics. It proactively identifies gaps in your test coverage before those gaps become blind spots in production. It analyzes your test suite and suggests where to add assertions, strengthen validation logic, and identify performance bottlenecks slowing down your CI pipeline. It recommends specific, actionable improvements instead of waiting for an engineer to notice a problem.
Engineers interact with these platforms through MCP (Model Context Protocol) server integrations with Claude Code, Cursor, and GitHub Copilot. They never need to open a separate dashboard or context-switch out of their IDE. Test intelligence lives where the code lives.
This is what separates AI-native test management from everything that came before: instead of recording test history and hoping someone reviews it, the platform tells engineers what to fix, what to add, and what to improve. It turns test management from a bookkeeping task into an active contributor to code quality.
What to look for in a Playwright test management tool
Not every test management platform works well with Playwright. These are the criteria that matter for Playwright-based teams.
1. Native Playwright reporter integration
The tool should ingest results through a Playwright reporter, not a generic API. A native reporter captures Playwright-specific data including trace files, screenshots, video recordings, browser contexts, and test step timings. Generic importers miss this data entirely.
What to check: Does the tool provide an npm package you can add to playwright.config.ts in under 5 minutes? Or does it require you to build a custom API integration?
2. Test case management that maps to code
A Playwright test management tool should let you store and organize actual test cases, manual and automated, in a structure that mirrors how your code is organized, not a parallel folder system that drifts out of sync. Look for nested suites, customizable classification fields (priority, severity, type), version history on every case, and a way to link manual cases to the automated tests that cover them.
What to check: Can you keep manual test cases and automated Playwright results in the same tool, see coverage between them, and import your existing cases (e.g. from TestRail CSV) without writing a script?
3. Flaky test detection and intelligence
Flaky tests are the number one pain point for Playwright teams at scale. Your tool should automatically detect flaky tests by analyzing historical pass/fail patterns. It should not just flag a test as flaky because it failed once and passed on retry.
What to check: Can the tool distinguish between a test that is genuinely flaky (intermittent infrastructure issues) and a test that started failing after a specific commit?
4. AI-driven failure classification
When a test fails, you need to know why before you spend time investigating. AI-powered classification can categorize failures into buckets: environment issue, locator change, timing/flakiness, actual product bug, or test data problem.
What to check: Does the tool use AI to analyze failure patterns, error messages, and stack traces? Or does it show the raw error and leave you to figure it out?
5. CI/CD integration and cost attribution
Playwright tests run in CI. Your tool should connect to your CI pipelines (GitHub Actions, GitLab CI, CircleCI, Jenkins) and surface insights such as cost per test run, pipeline duration trends, and the tests that are the biggest CI cost drivers.
What to check: Can you see how much each test suite costs in CI compute minutes? Can you identify which tests should be moved to a different parallelization strategy?
6. MCP server support for AI-native workflows
This is the differentiator for 2025. MCP (Model Context Protocol) server support means engineers can interact with the test management platform directly from AI coding assistants. Instead of opening a dashboard to check test status, create test plans, or triage failures, they use natural language commands in Claude Code, Cursor, or GitHub Copilot.
What to check: Does the tool expose an MCP server? Can an engineer ask their AI assistant "What are the top 5 flaky tests this week?" or "Create a test plan for the checkout flow" without leaving their IDE?
7. Proactive test improvement suggestions
Reactive tools show you what happened. Proactive tools tell you what to do. Your Playwright test management tool should suggest missing test coverage, flag tests with weak or missing assertions, identify performance bottlenecks, and recommend specific improvements to your test suite.
What to check: Does the tool analyze your test code and results to suggest improvements? Or does it only report pass/fail status and leave optimization to your team?
8. PR-level test reporting
Engineers care about test results in the context of their pull request, not in a separate dashboard. Your tool should post test summaries, failure details, and flaky test warnings directly to PRs.
What to check: Does the tool post PR comments with actionable summaries? Can it highlight which failures are new versus pre-existing?
9. Developer-first experience
If the tool requires your QA lead to spend a week configuring it, adoption will fail. Setup should take minutes, not days. The core value should be visible on the first CI run.
What to check: Can a developer install the reporter, run their existing Playwright suite, and see value in the dashboard within 15 minutes?
Best Playwright test management tools compared
| Test management capability |  TestDino |
 Xray |
 Zephyr Scale |
 PractiTest |
 qTest |
|---|---|---|---|---|---|
| Manual + automated cases in one place | |||||
| Nested test suites/hierarchy | drag-and-drop | (in Jira) | folders (in Jira) | ||
| Classification fields | 6 built-in + customizable | via Jira fields | via Jira fields | ||
| Custom fields | |||||
| Version history on test cases | compare + restore | via Jira history | via Jira history | ||
| Manual runs with step-level results | Releases / Runs / Sessions | ||||
| Exploratory testing sessions | Sessions | add-on | limited | ||
| Link manual cases ↔ automated tests | Auto-Match / Auto-Generate | ||||
| Import from TestRail / CSV / JSON | Auto-mapped columns | CSV/Jira import | CSV import | ||
| Manage cases via AI assistant (MCP) | Claude / Cursor / ChatGPT | ||||
| Requirement-traceability matrix | Issue linking (not a full matrix) | ||||
| Pricing model | Usage-based (per test run) | Per user/month | Per user/month | Per user (tiered) | Quote-based enterprise |
How we evaluated these tools:
Each tool was assessed on Playwright-specific criteria: how it ingests Playwright results, what Playwright-specific data it captures (traces, screenshots, steps), setup complexity for a typical Playwright project, and whether it adds intelligence beyond raw result storage. We prioritized tools that treat automation results as first-class data rather than an afterthought in manual test management.
Top 5 Playwright test management tools
1. TestDino: Playwright test management & test observability
TestDino is the AI-native test management and observability platform built specifically for Playwright. It is not a manual test management tool with automation bolted on, nor is it a dashboard that only reports results. It does both jobs in one place: it manages your test cases (manual and automated) and applies intelligence on top of every Playwright run.
Where legacy tools record and report, TestDino organizes, analyzes, and recommends. It is built for teams that write tests in code, run them in CI, and want their manual cases, automation results, and test intelligence in a single platform instead of three.
Test Case Management in TestDino
This is the part most Playwright comparisons miss: TestDino is a full test case management system, not just a reporter.
-
Organize cases the way your team works. Build test cases inside nested test suites with drag-and-drop reordering, switch between List and Grid views, and filter the repository by Status, Automation, Priority, Type, and Tags. An existing TestRail-style section hierarchy maps over directly.
-
Classify with the fields QA actually uses. Six built-in classification fields (Priority, Severity, Type, Layer, Behavior, and Status) plus automation states (Automation Status, To Be Automated, Is Flaky, Is Muted), all customizable per project. Add custom fields in five types (text, textarea, number, dropdown, checkbox), and add more as needed.
-
Never lose a change. Every case carries full version history: compare two versions side by side and restore any previous one. Use bulk actions to edit, delete, or print many cases at once.
-
Run manual testing natively. TestDino's native manual testing workspace has three connected parts: Releases (plan and group work by sprint, version, or cycle), Manual Runs (execute a chosen set of cases, record step-level results, and link issues), and Sessions (capture exploratory findings, evidence, and linked issues, with attachments).
-
Link manual cases to the automated tests that cover them. Auto-Match connects existing manual cases to the automated tests already covering them, and Auto-Generate drafts automation directly from manual cases, so coverage between manual and automated stays visible instead of living in a spreadsheet.
-
Move your existing cases in without scripts. TestDino imports from CSV (TestDino, TestRail, or custom) or JSON, auto-maps TestRail columns (title, preconditions, steps, priority, type, suite hierarchy, labels), handles both TestRail case templates, and offers Skip / Update / Create duplicate handling so re-running an import is safe. See the full TestRail migration walkthrough.


How Playwright integration works
Install the TestDino Playwright reporter via npm:
npm install @testdino/playwright-reporterAdd it to your playwright.config.ts:
export default defineConfig({
  reporter: [
    [ 'list' ],
    [ '@testdino/playwright' , { token: process.env.TESTDINO_TOKEN }]
  ],
});
That is the entire setup. On your next CI run, TestDino receives every test result live with full Playwright context: traces, screenshots, video, step-by-step execution data, and timing metadata.
AI-native failure classification
When a Playwright test fails, TestDino's AI engine analyzes the failure and classifies it automatically:
-
Environment issue: The test failed due to a network timeout, a container resource limit, or a browser crash. Not a product bug.
-
Locator change: A CSS selector or test ID changed. Likely a frontend code change that requires a test update.
-
Flaky / Timing issue: The test has an intermittent pass/fail pattern consistent with race conditions or animation timing.
-
Actual product bug: The failure pattern is new, correlates with a recent code change, and does not match known flaky patterns.
-
Test data issue: The test depends on data that is stale, missing, or in an unexpected state.
This AI failure classification saves 30 to 60 minutes per day of manual triage for the average Playwright team. Engineers stop investigating every red test and focus only on failures classified as likely product bugs.
Proactive test intelligence
TestDino does not stop at diagnostics. It actively analyzes your Playwright test suite and provides specific, actionable recommendations:
-
Missing coverage detection. TestDino identifies areas of your application that lack test coverage and suggests where to add new tests before gaps become production incidents.
-
Assertion quality analysis. It flags tests with weak, missing, or redundant assertions and recommends where to add proper validation logic to catch real regressions.
-
Performance optimization. It pinpoints slow tests, identifies bottlenecks in your CI pipeline, and recommends parallelization or configuration changes to reduce total runtime.
-
Test maintenance guidance. It detects tests that are becoming brittle or overly coupled to implementation details and suggests refactoring approaches.
This is the difference between a reactive tool that shows you a red/green dashboard and a proactive platform that tells you exactly where your test suite needs improvement.
MCP server: Manage tests without leaving your IDE
TestDino's MCP (Model Context Protocol) server is what sets it apart as a different category of tool from legacy test management platforms.
Engineers connect TestDino's MCP server to their AI coding assistant (Claude Code, Cursor, or GitHub Copilot) and interact with their test management data using natural language:
Check test health: "What are the top 10 flakiest tests in the checkout module this month?"
Get proactive suggestions: "Where are we missing test coverage in the payment service?"
Improve assertions: "Which tests in the auth module have weak or missing assertions?"
Create test plans: "Create a test plan for the new payment flow covering happy path, edge cases, and error states."
Triage failures: "Show me all test failures from the last PR that are classified as real bugs, not flaky tests."
Update test metadata: "Mark the test checkout.spec.ts > should apply discount code as a known flaky test with a linked Jira ticket ENG-4521."
Engineers never need to open a separate dashboard to manage tests. They stay in their IDE, ask their AI assistant, and get immediate answers backed by TestDino's data.
The MCP server exposes the full TestDino API (read, create, update, and delete operations) through a protocol that AI assistants natively understand. It exposes TestDino's test-management tools too: an assistant can create_manual_test_suite, create_manual_test_case, and list_manual_test_cases, so you can build out a suite, recreate a TestRail hierarchy, or update case metadata entirely from Claude code, Cursor, or ChatGPT.
Flaky test intelligence
TestDino tracks the pass/fail history of every test across every CI run and identifies flaky patterns automatically. The flaky test dashboard shows:
-
Flake rate: Percentage of runs where the test flipped between pass and fail.
-
Flake trend: Is the test becoming more or less flaky over time?
-
Correlation: Does the flakiness correlate with specific browsers, CI runners, or time of day?
-
Cost impact: How many CI minutes are wasted on retries caused by this flaky test?
-
Recommended actions: quarantine, fix the root causes, or adjust retry configuration.
CI/CD cost attribution
TestDino connects to your CI provider and calculates the compute cost of your Playwright test suite. You get a breakdown of cost per test file, per test, and per browser so you can make data-driven decisions about where to optimize.
PR-level test reporting
Every pull request gets an automated comment with:
-
Total tests run, passed, failed, skipped
-
New failures introduced by this PR
-
Known flaky tests flagged separately
-
Link to detailed trace viewer for each failure
-
Estimated CI cost for this PR's test run
Pros
-
Test case management AND automation intelligence in one platform: manual cases, suites, classification, version history, and manual runs alongside Playwright reporting
-
Purpose-built for Playwright; not a repurposed manual testing tool
-
AI-native architecture with failure classification, flaky detection, proactive suggestions, and cost analysis as core features
-
Auto-Match / Auto-Generate link manual cases to automated tests so coverage is visible
-
MCP server lets engineers manage tests and cases from Claude Code, Cursor, or ChatGPT
-
One-click import from TestRail / CSV / JSON with auto-mapped columns
-
5-minute setup with native Playwright reporter
-
Free tier available for small teams
Cons
-
Strongest for Playwright-centric teams; teams running many non-Playwright frameworks may want broader framework coverage
-
Formal requirement-traceability matrices (requirement to case to result) are lighter than legacy tools like qTest or Xray; TestDino links issues from runs and sessions rather than offering a full traceability matrix
-
Newer product with a smaller user community compared to legacy tools
Best for
-
Startups growing their automation
-
Mid-size teams building serious CI pipelines
-
Enterprise teams managing large test suites across branches and environments
Playwright teams that want test case management and automation intelligence in one place: manual cases, suites, and runs alongside AI failure classification, flaky detection, and MCP-based workflows. Especially strong for teams migrating from TestRail/Testmo who want their cases and their automation truth in the same tool.
2. Xray for Jira: Enterprise test management with Playwright support
Overview
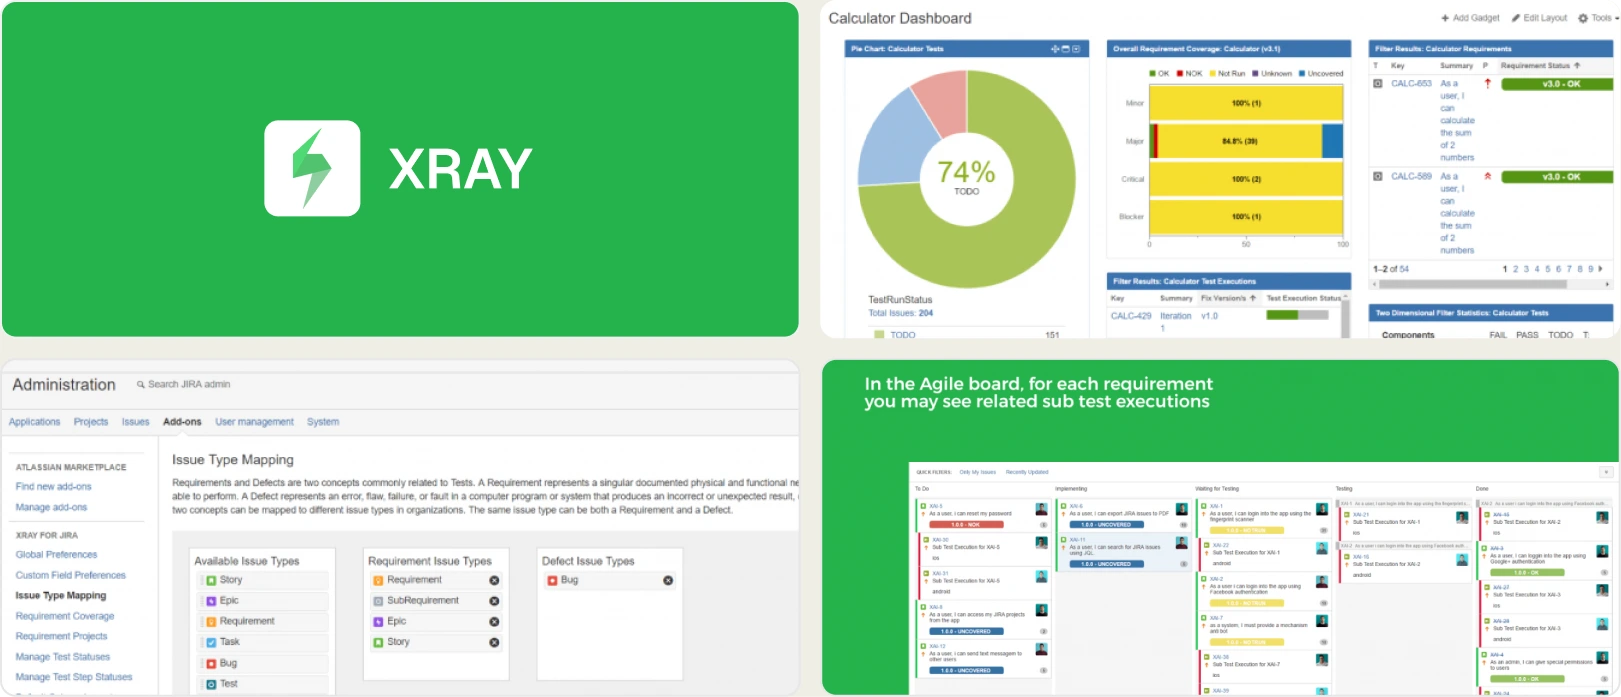
Xray is one of the most established test management tools in the Atlassian ecosystem. It integrates directly with Jira as a native add-on, so test cases, test plans, and test executions live alongside your Jira issues.
How Playwright integration works
Xray does not have a native Playwright reporter. Integration works by converting Playwright results to the JUnit XML format (which Playwright supports natively) and then importing the XML into Xray via its REST API or CI plugin.
// playwright.config.ts
export default defineConfig({
  reporter: [
    ['junit', { outputFile: 'results/junit-report.xml' }]
  ],
});
After the CI run, a post-step uploads the JUnit XML to Xray:
curl -X POST \
  "https://xray.cloud.getxray.app/api/v2/import/execution/junit" \
  -H "Authorization: Bearer $XRAY_TOKEN" \
  -F "file=@results/junit-report.xml"
Limitation: JUnit XML is a generic format. It captures pass/fail status and error messages but loses Playwright-specific data like traces, screenshots, browser context, and step-level timing. You get test results in Xray, but not the rich Playwright debugging data.
What Xray does well for Playwright teams
Xray excels at traceability. If your organization requires formal links between requirements (Jira stories), test cases, test executions, and defects, Xray handles this natively within Jira. Every test execution is a Jira issue that can be linked to stories, epics, and bugs.
Test plans in Xray let you group test cases into structured execution plans, useful for release-gated testing or compliance audits. You can define test environments (browser/OS combinations), track test cycles, and generate coverage reports that show which requirements have passing tests.
Where Xray falls short for Playwright
-
No AI-powered failure analysis. When a test fails, Xray shows the JUnit error message. There is no automatic classification, no flaky detection, and no root cause suggestion.
-
No native Playwright data. Without a Playwright reporter, you lose traces, screenshots, videos, and step-level data. The JUnit XML gives Xray the minimum amount of information.
-
Setup complexity. Configuring the Xray-Jira-Playwright pipeline involves setting up the JUnit reporter, creating API credentials, writing CI upload scripts, and mapping test keys between Playwright and Xray. Expect 30 to 60 minutes for initial setup.
-
Manual test mindset. Xray's data model is built around manually written test cases with steps. Playwright tests defined in code do not map cleanly to this model. You either auto-generate test cases from JUnit results (losing structure) or manually maintain them (adding overhead).
-
No proactive suggestions. Xray does not analyze your test suite for coverage gaps, weak assertions, or performance issues.
-
No MCP server or AI assistant integration. Engineers must use the Jira/Xray UI or API to interact with test data.
Pros
-
Deep Jira integration for teams already in the Atlassian ecosystem
-
Strong traceability: requirements to tests to defects
-
Mature product with large enterprise user base
-
Supports manual, automated, and BDD test types
Cons
-
No native Playwright reporter (relies on JUnit XML, loses Playwright-specific data)
-
No AI-powered failure classification or flaky test intelligence
-
No proactive test improvement suggestions
-
Manual test case model creates friction for code-first Playwright teams
-
Setup and configuration is significantly more complex than code-native tools
-
No MCP server support
Best for
Enterprise teams in the Atlassian ecosystem that need formal test plans, regulatory traceability, and are willing to accept the limitations of JUnit-based Playwright integration.
Pricing
Per-user, per-month, billed as a Jira/Atlassian Marketplace add-on.
3. Zephyr Scale: Scalable test management for Jira teams
Overview
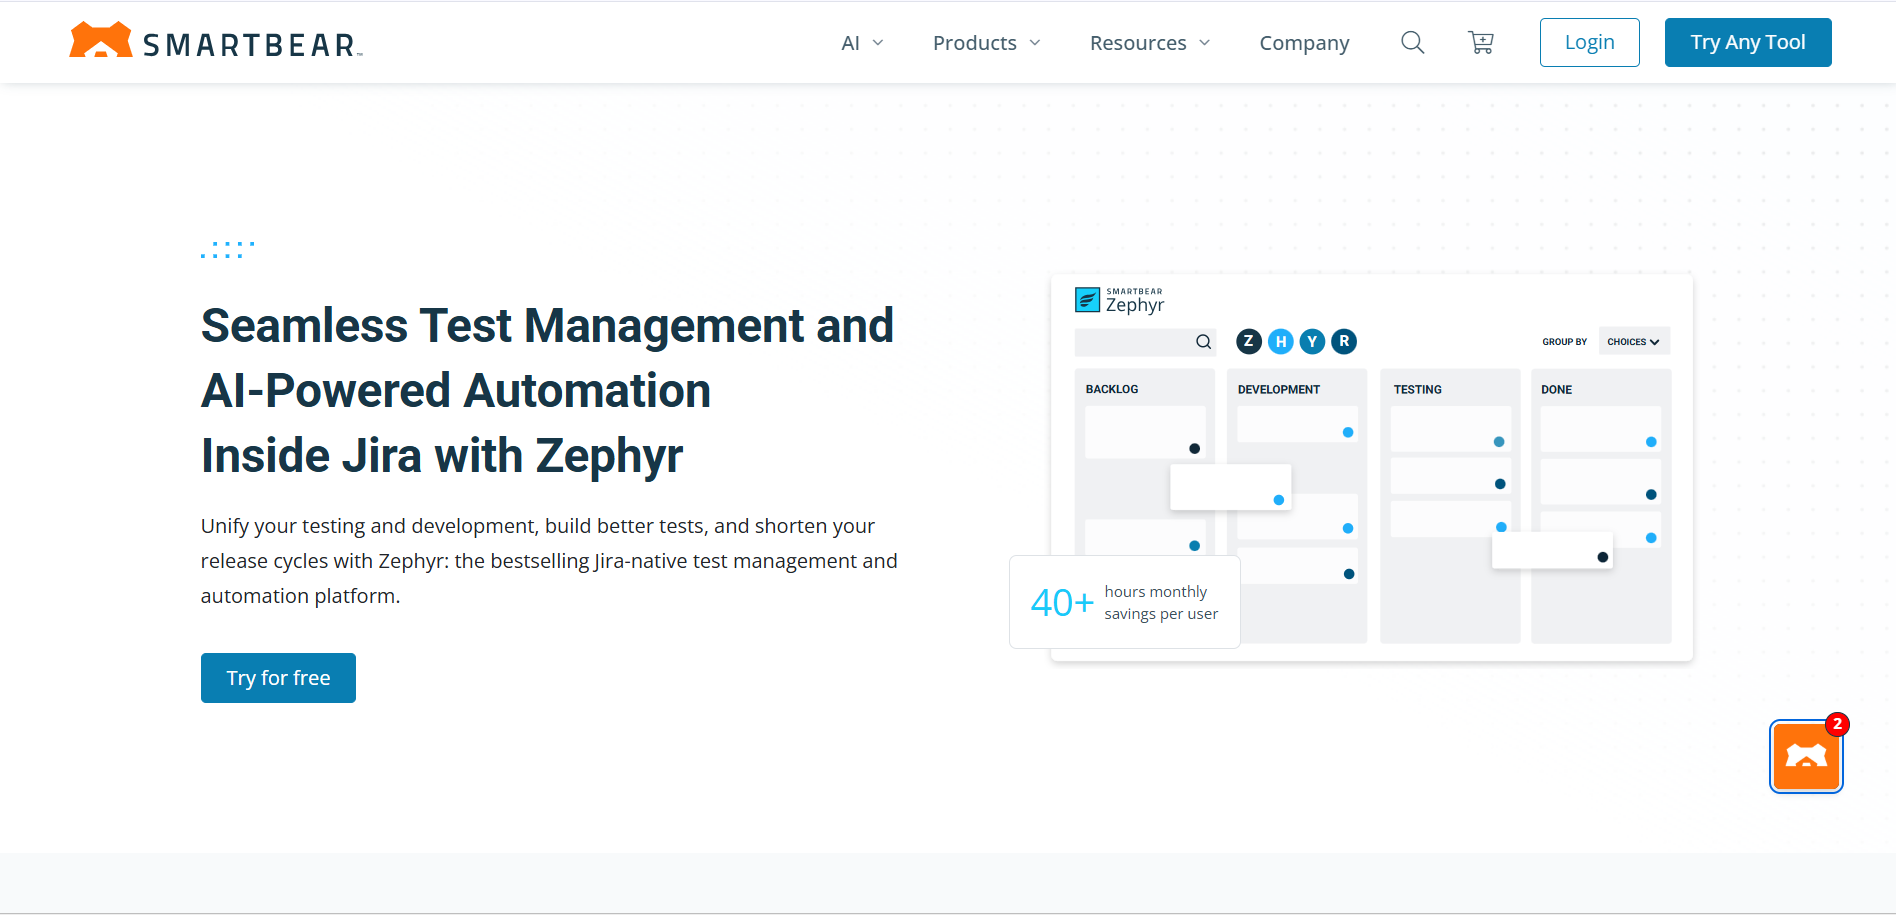
Zephyr Scale (formerly TM4J) is a Jira-native test management app by SmartBear. Like Xray, it lives inside Jira. Unlike Xray, Zephyr Scale focuses more on simplicity and team adoption speed.
How Playwright integration works
Zephyr Scale integrates with Playwright through JUnit XML import, similar to Xray. You configure Playwright's JUnit reporter, generate XML results, and upload them using Zephyr Scale's REST API.
# Upload JUnit results to Zephyr Scale
curl -X POST \
  "https://api.zephyrscale.smartbear.com/v2/automations/executions/junit" \
  -H "Authorization: Bearer $ZEPHYR_TOKEN" \
  -F "file=@results/junit-report.xml" \
  -F "projectKey=PROJ"
The same JUnit XML limitation applies: Zephyr Scale receives pass/fail status and error messages, but not Playwright traces, screenshots, or step-level data.
What Zephyr Scale does well for Playwright teams
Zephyr Scale's strength is its lower barrier to entry compared to Xray. The UI is cleaner, the learning curve is shallower, and it is easier to get basic test result tracking working quickly.
Test cycles in Zephyr Scale let you group executions by sprint, release, or environment. The reporting is straightforward with pass/fail charts, test coverage by folder, and execution progress tracking. For teams that need basic test management without heavy process, Zephyr Scale delivers.
Where Zephyr Scale falls short for Playwright
-
Same JUnit XML limitation as Xray. No native Playwright data capture.
-
No AI capabilities. No failure classification, no flaky detection, no intelligent triage.
-
No proactive suggestions. Does not analyze test coverage gaps, assertion quality, or performance issues.
-
Limited automation depth. While it ingests automated results, the tool does not provide insights specific to automation, such as CI cost, retry analysis, or parallelization recommendations.
-
Folder-based organization. Test cases are organized in folders, which does not map well to Playwright's file-and-describe-block structure. You end up with a parallel organizational system that drifts from your actual code.
-
No MCP server or AI assistant integration.
Pros
-
Lightweight and easy to adopt within Jira
-
Clean UI with simple reporting dashboards
-
Good for teams mixing manual and automated tests
-
Lower price point than Xray for smaller teams
Cons
-
No native Playwright reporter (JUnit XML only)
-
No AI-powered failure analysis or flaky test detection
-
No proactive test improvement suggestions
-
Limited automation-specific insights (no CI cost, no retry analysis)
-
Test case organization does not mirror Playwright project structure
-
No MCP server support
Best for
Jira-native teams that want straightforward test management without the complexity of Xray, and are okay with basic JUnit-level Playwright integration.
Pricing
Per-user, per-month, sold as a SmartBear app on the Atlassian Marketplace.
4. PractiTest: End-to-End Test Management Platform
Overview
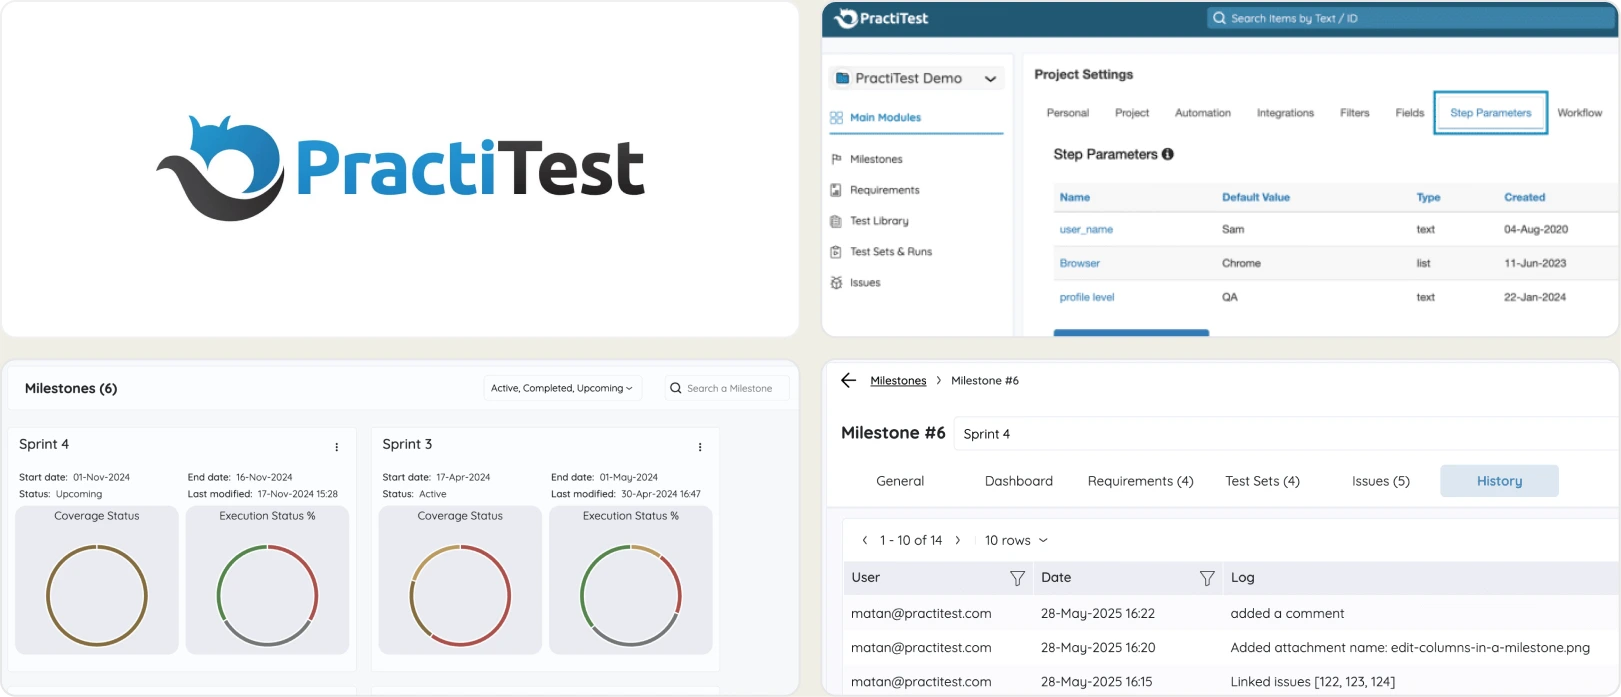
PractiTest is a standalone test management platform (not tied to Jira) that supports manual, automated, and exploratory testing. It positions itself as a tool for QA teams that manage multiple testing methodologies across different projects.
How Playwright integration works
PractiTest integrates with Playwright through its REST API. You use Playwright's built-in reporters to generate results (JUnit XML or JSON), then use PractiTest's API or a custom script to upload them.
PractiTest also provides a "Firecracker" agent that can pull results from CI/CD tools and map them to PractiTest test cases. This requires configuring the agent, mapping test IDs, and maintaining the connection between your Playwright tests and PractiTest entities.
Limitation: Like Xray and Zephyr, PractiTest does not have a native Playwright reporter. Playwright-specific data (traces, screenshots, step timings) must be handled separately if you want them accessible from PractiTest.
What PractiTest does well for Playwright teams
PractiTest's standout feature is its customizable dashboards and reporting. You can build dashboards that combine manual and automated test data, filter by custom fields, and generate reports for stakeholders at different levels (engineering, QA lead, PM, executive).
The platform supports hierarchical test libraries with custom fields, filters, and tags. If your team manages tests across multiple projects, environments, and test types, PractiTest provides a flexible structure.
Where PractiTest falls short for Playwright
-
No native Playwright integration. Requires API-based import or third-party agent setup. Expect 1 to 2 hours for initial configuration.
-
No AI capabilities. Failure classification, flaky detection, and cost analysis are not available.
-
No proactive suggestions. Does not surface coverage gaps, assertion issues, or performance improvements.
-
Heavy on manual workflow. PractiTest was built for manual QA teams. The automation support works but feels like an addition to a manual-first product.
-
Separate from developer workflow. Engineers need to use PractiTest's web UI. There is no IDE integration, PR commenting, or MCP server support.
-
No Playwright-specific data. Traces, videos, and browser context information are not captured.
Pros
-
Flexible, standalone platform not tied to a specific project management tool
-
Strong support for multiple testing methodologies (manual, automated, exploratory)
-
Customizable dashboards and executive reporting
-
Good for cross-project test management
Cons
-
No native Playwright reporter (API-based import only)
-
No AI-powered analysis or flaky test intelligence
-
No proactive test improvement suggestions
-
Manual QA-first design creates friction for automation-first teams
-
Setup requires significant configuration (1 to 2 hours minimum)
-
No MCP server, IDE integration, or PR-level reporting
Best for
QA teams managing different testing methodologies (manual, automated, and exploratory) across multiple projects, who need a standalone platform independent of Jira or other project management tools.
Pricing
Per-user, per-month with tiered plans, billed directly by PractiTest (it is a standalone platform, not a Jira add-on).
5. qTest by Tricentis: Enterprise-Grade Test Management
Overview
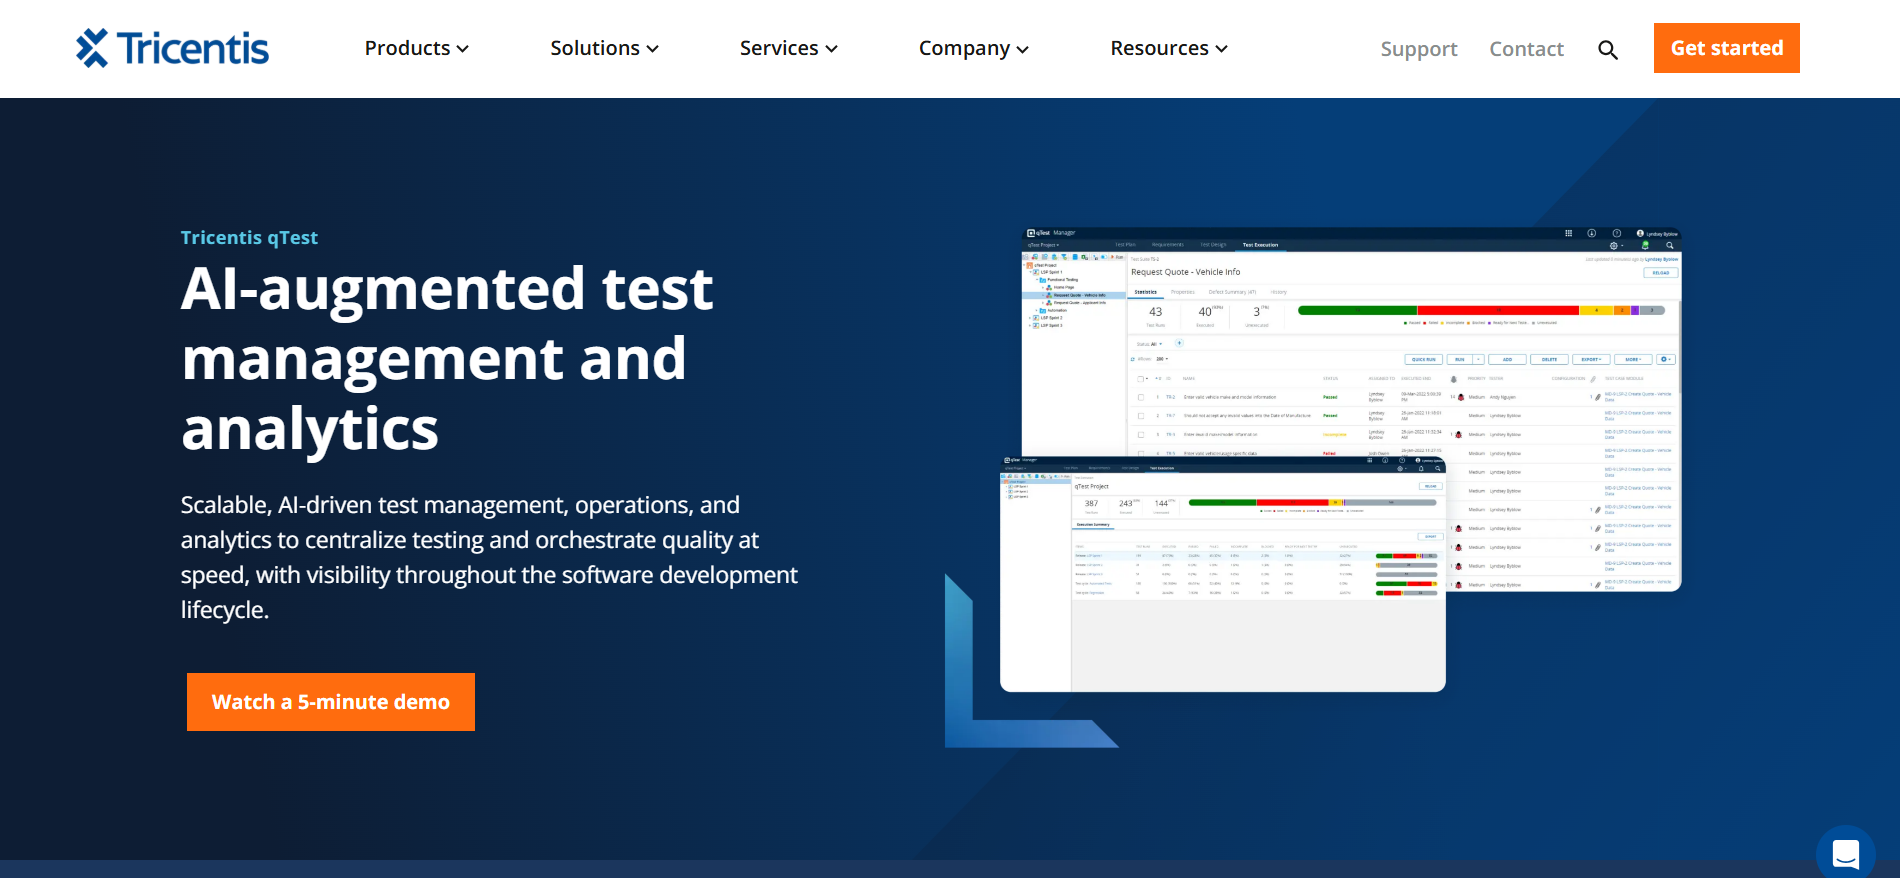
qTest is Tricentis's enterprise test management platform. It is part of a larger testing ecosystem that includes Tricentis Tosca (codeless testing), NeoLoad (performance testing), and other tools. qTest is designed for large organizations with strict compliance and governance requirements.
How Playwright integration works
qTest integrates with Playwright through its "qTest Manager" module via JUnit/TestNG XML imports, or through "qTest Launch," which connects to CI/CD tools such as Jenkins, GitHub Actions, and GitLab CI.
qTest Launch can trigger Playwright test runs and pull results back into qTest Manager. The setup involves configuring agents, mapping projects, and setting up the CI/CD connection through qTest's interface.
Limitation: Like other legacy tools, qTest does not provide a native Playwright reporter. Integration relies on generic XML formats, and Playwright-specific debugging data is not captured.
What qTest does well for Playwright teams
qTest is built for enterprise scale. If your organization has hundreds of testers across multiple teams, strict audit requirements, and needs centralized test management with role-based access control, qTest delivers that infrastructure.
qTest Insights provides analytics across projects, and qTest Pulse enables workflow automation (for example, automatically creating a Jira bug when a test fails). The platform integrates with a wide range of tools in the enterprise testing ecosystem.
Where qTest falls short for Playwright
-
No native Playwright reporter. Standard XML import only.
-
No AI capabilities. No failure classification, no flaky detection, no intelligent triage.
-
No proactive suggestions. Does not analyze coverage, assertions, or CI performance.
-
Heavy setup and onboarding. Enterprise tools mean enterprise implementation. Expect a minimum of 2-4 hrs for initial setup, potentially more for full configuration.
-
Enterprise pricing. qTest uses custom enterprise pricing. It is significantly more expensive than developer-focused tools and typically requires an annual contract.
-
Designed for QA teams, not developers. The UI and workflow are optimized for dedicated QA professionals, not developers who write Playwright tests and want quick feedback in their IDE.
-
No MCP server or AI assistant integration.
Pros
-
Enterprise-grade scalability and security
-
Strong governance and audit controls for test management
-
Part of the broader Tricentis ecosystem (Tosca, NeoLoad, etc.)
-
Advanced workflow automation via qTest Pulse
Cons
-
No native Playwright reporter (relies on XML import)
-
No AI-powered analysis or flaky test intelligence
-
No proactive test improvement suggestions
-
Heavy onboarding and complex setup
-
Enterprise pricing model not suitable for small or mid-size teams
-
Developer experience is secondary to QA workflow optimization
-
No MCP server, IDE integration, or PR-level reporting
Best for
Large enterprises (100+ testers) with strict compliance requirements, multi-tool CI/CD environments, and a need for centralized test governance across teams.
Pricing
Custom enterprise pricing only. Tricentis does not publish list prices for qTest; it is sold via sales quote, typically as an annual contract, and is the most expensive option on this list.
How to evaluate a Playwright test management tool
Before committing to a tool, run this evaluation framework against your shortlist.
Step 1: The 15-minute test
Install the tool's Playwright reporter (or integration) and run your existing suite. If you cannot see meaningful results in a dashboard within 15 minutes, the tool has too much setup friction for a Playwright-first team.
Step 2: Check what data gets captured
Run a test that fails. Open the failure in the tool. Can you see the Playwright trace? Screenshots? Step-by-step execution? If the tool only shows a pass/fail status and a generic error message, it is not capturing Playwright-specific data.
Step 3: Test the flaky detection
If you have known flaky tests, run the suite 5 to 10 times. Does the tool automatically identify which tests are flaky? Does it show flake rates and trends? Or does it just show pass/fail without historical analysis?
Step 4: Check test case management & import
Import a sample of your existing test cases (a TestRail CSV works well). Can the tool auto-map the columns and rebuild your suite hierarchy without a custom script? Once imported, can you classify, version, and manually run those cases, and link them to your automated Playwright tests? A reporter-only tool will not let you do this; a real test management platform will.
Step 5: Check for proactive suggestions
Does the tool tell you where your test coverage has gaps? Does it flag weak assertions? Does it recommend CI optimizations? A reactive tool shows you what happened. A proactive tool tells you what to do next.
Step 6: Evaluate the developer workflow
Ask your engineers to use the tool for a sprint. Do they need to leave their IDE to access test data? Can they get test failure information from their PR? Can they triage failures using AI classification? The less context-switching required, the higher the adoption rate.
Step 7: Check for AI and MCP support
Ask: "Can I interact with this tool from Claude Code, Cursor, or Copilot?" If the answer is no, the tool was built for the cloud-dashboard era, not the AI-native era. MCP server support is the clearest signal that a tool was built for how engineers work in 2025.
Playwright Test Management tools: Benefits & challenges
Benefits of using Playwright test management tools
Playwright test management tools help QA and development teams create a structured, scalable, and reliable automated testing workflow. They make it easy to organize Playwright test suites, monitor execution in real time, and maintain consistent quality across fast-moving releases.
These tools integrate seamlessly with CI/CD pipelines, providing faster feedback and better visibility into automated test results. They also improve collaboration between QA, developers, and product stakeholders by centralizing test cases and execution history.
Advanced dashboards and reporting give teams actionable insights into test coverage, flakiness, and quality risks. By reducing redundant tests and highlighting potential issues early, Playwright test management tools increase release confidence and help prevent defects from reaching production.
Challenges solved by Playwright test management tools
As teams adopt modern architectures, fast release cycles, and automated testing with Playwright, QA and development teams often struggle to maintain quality and visibility.
Playwright test management tools help create a unified view of test activities and results, addressing challenges such as:
-
Playwright test cases are scattered across different scripts, repositories, or spreadsheets
-
Limited visibility into test execution progress and test results
-
Missing links between requirements, test scripts, and reported defects
-
Manual reporting and tracking of test runs
-
Poor insight into Playwright automation results and flakiness
-
Delayed feedback in CI/CD pipelines and slower bug detection
-
Inconsistent Playwright testing practices across teams and projects
FAQs

Pratik Patel
Co-founder